

Global Mobility
Global leadership, global education.
- Global (home)
Brazil & Latin America
Australasia
New Zealand
Europe & the UK
Isle of Man
Netherlands
Scandinavia
Switzerland
Middle East
- Think Global People
K-12 Curriculum and pupil assessment
What is the K-12 system and how are pupils assessed along the way? Relocate takes a look at how the US education system differs from other countries around the world.

- China's expanding international school options
- Education in Germany
- Relocating to the US
Common Core standardised testing in the US
Relocate global’s new annual guide to international education & schools provides a wealth of advice to anyone searching for a new school in the uk and in an international setting, and offers insights into what it takes to make the right school choice. .

©2024 Re:locate magazine, published by Profile Locations, Spray Hill, Hastings Road, Lamberhurst, Kent TN3 8JB. All rights reserved. This publication (or any part thereof) may not be reproduced in any form without the prior written permission of Profile Locations. Profile Locations accepts no liability for the accuracy of the contents or any opinions expressed herein.
Related Articles

The Role of Artificial Intelligence in Education: Merging Innovation with Tradition at Mougins School

Mougins School

New release International Education & Schools' Fair webinars

The Benefits of a Bilingual Education

Choosing a school in Malaysia

Editor's Choice

Global News

Immigration
International Assignments
Mobility Industry
Employee Benefits
Partner & Family Support
Residential Property
Remote Working
Serviced Apartments
Global Expansion
Leadership & Management
Talent Management
Human Resources
Business Travel
Culture & Language
Learning and Development
Education & Schools
Country Guides to Education & Schools
Featured Schools and Directory
Guide to International Education and Schools Articles
Schools' Fair
Online Schools Webinars
Education Webinars
Research and Higher Education
Education Consultants
School Groups
Online Schools
About Relocate Global
Contact Relocate Global
Meet the Relocate team
Employment Opportunities
Newsletters
Relocate Global Mobility App
Get in touch
+44 (0)1892 891334
Relocate Global Privacy Policy
Privacy and Cookies
- Society ›
Education & Science
K-12 education in the United States - statistics and facts
Public school politics, inequalities in education, key insights.
Detailed statistics
School enrollment in public and private institutions in the U.S. 2022
Expenditure on public and private elementary and secondary schools U.S. 1970-2021
Editor’s Picks Current statistics on this topic
Educational Institutions & Market
Share of Americans who are concerned about select issues in public schools U.S. 2023
Top three reasons K-12 public school teachers fear for their safety U.S. 2023
U.S. states restricting schools from teaching race, sex, or inequality 2021-2023
Further recommended statistics
- Basic Statistic Number of elementary and secondary schools in the U.S. 2020/21, by type
- Premium Statistic Share of U.S. public schools 2021/22, by enrollment size and school type
- Basic Statistic School enrollment in public and private institutions in the U.S. 2022
- Basic Statistic Enrollment in public and private elementary schools 1960-2022
- Basic Statistic High school enrollment in public and private institutions U.S. 1965-2031
- Premium Statistic Enrollment in public elementary and secondary schools U.S. 2022, by state
- Basic Statistic Primary and secondary school enrollment rates in the U.S. in 2022, by age group
- Basic Statistic Share of students enrolled in U.S. public K-12 schools 2021, by ethnicity and state
- Basic Statistic U.S. public school enrollment numbers 2000-2021, by ethnicity
Number of elementary and secondary schools in the U.S. 2020/21, by type
Number of elementary and secondary schools in the United States in 2020/21, by school type*
Share of U.S. public schools 2021/22, by enrollment size and school type
Share of public schools in the United States in 2021/22, by enrollment size and school type
Enrollment in public and private schools in the United States in 2022 (in millions)
Enrollment in public and private elementary schools 1960-2022
Enrollment in public and private elementary schools in the United States from 1960 to 2022 (in millions)
High school enrollment in public and private institutions U.S. 1965-2031
High school enrollment for public and private schools in the U.S. from 1965 to 2020, with projections up to 2031 (in 1,000s)
Enrollment in public elementary and secondary schools U.S. 2022, by state
Enrollment in public elementary and secondary schools in the United States in 2022, by state (in 1,000s)
Primary and secondary school enrollment rates in the U.S. in 2022, by age group
Share of population enrolled in primary and secondary education in the United States in 2022, by age group
Share of students enrolled in U.S. public K-12 schools 2021, by ethnicity and state
Share of students enrolled in K-12 public schools in the United States in 2021, by ethnicity and state
U.S. public school enrollment numbers 2000-2021, by ethnicity
K-12 public school enrollment numbers in the United States from 2000 to 2021 by ethnicity (in 1,000s)
Revenue and expenditure
- Basic Statistic School expenditure on public and private institutions 1970-2020
- Basic Statistic Expenditure on public and private elementary and secondary schools U.S. 1970-2021
- Premium Statistic U.S. per pupil public school expenditure FY 2023, by state
- Basic Statistic U.S. public schools - average expenditure per pupil 1980-2020
- Basic Statistic U.S. education - total expenditure per pupil in public schools 1990-2021
- Basic Statistic Revenue of public elementary and secondary schools U.S. 1980-2020
- Premium Statistic Average annual tuition for private K-12 schools U.S. 2024, by state
- Premium Statistic Estimated average salary of public school teachers U.S. 2021/22, by state
School expenditure on public and private institutions 1970-2020
School expenditure in public and private institutions in the United States from 1970 to 2020 (in billion U.S. dollars)
School expenditure on public and private elementary and secondary schools in the United States from 1970 to 2021 (in billion U.S. dollars)
U.S. per pupil public school expenditure FY 2023, by state
Per pupil public elementary and secondary school expenditure in the United States in the fiscal year of 2023, by state (in U.S. dollars)
U.S. public schools - average expenditure per pupil 1980-2020
Average expenditure per pupil in average daily attendance in public elementary and secondary schools from academic years 1980 to 2020 (in U.S. dollars)
U.S. education - total expenditure per pupil in public schools 1990-2021
Total expenditure per pupil in public elementary and secondary schools in the United States from 1990 to 2021 (in constant 2022-23 U.S. dollars)
Revenue of public elementary and secondary schools U.S. 1980-2020
Revenue of public elementary and secondary schools in the United States from the academic years 1980 to 2020 (in billion U.S. dollars)
Average annual tuition for private K-12 schools U.S. 2024, by state
Average annual tuition for private K-12 schools in the United States in 2024, by state (in U.S. dollars)
Estimated average salary of public school teachers U.S. 2021/22, by state
Estimated average salary of public school teachers in the United States in 2021-2022, by state (in constant 2020-21 U.S. dollars)
State laws and book bans
- Premium Statistic U.S. states restricting schools from teaching race, sex, or inequality 2021-2023
- Premium Statistic Proposed bans on sex or gender identity in K-12 schools U.S. 2023, by grade level
- Premium Statistic Share of transgender youth subject to bans on school sport participation U.S 2024
- Premium Statistic Share of U.S. transgender population subject to bathroom bills 2024
- Premium Statistic Instances of book bans in U.S. public schools 2022/23, by ban status
- Basic Statistic Books banned in schools in the U.S. H2 2022, by state
- Premium Statistic Book titles banned in schools in the U.S. H2 2022, by subject matter
- Premium Statistic Topics that K-12 librarians would ban from their school libraries U.S. 2023
Legal action taken to restrict teaching critical race theory or limit how teachers can discuss racism, sexism, and systemic inequality in the United States from 2021 to 2023, by state
Proposed bans on sex or gender identity in K-12 schools U.S. 2023, by grade level
Number of proposed bans on instruction related to sexual orientation or gender identity in K-12 schools in the United States in 2023*, by grade level of ban
Share of transgender youth subject to bans on school sport participation U.S 2024
Share of transgender youth aged 13 to 17 living in states that restrict transgender students from participating in sports consistent with their gender identity in the United States as of March 14, 2024
Share of U.S. transgender population subject to bathroom bills 2024
Share of transgender population aged 13 and over living in states that ban transgender people from using bathrooms and facilities consistent with their gender identity in the United States as of March 14, 2024
Instances of book bans in U.S. public schools 2022/23, by ban status
Total number of instances of books banned from K-12 public libraries and classrooms in the United States in the 2022/23 school year, by ban status
Books banned in schools in the U.S. H2 2022, by state
Number of books banned in school classrooms and libraries in the United States from July 1, 2022 to December 31, 2022, by state
Book titles banned in schools in the U.S. H2 2022, by subject matter
Share of book titles banned in school classrooms and libraries in the United States from July 1, 2022 to December 31, 2022, by subject matter
Topics that K-12 librarians would ban from their school libraries U.S. 2023
Share of library staff working in K-12 schools and districts who believe that libraries in their district or school should not include any books that depict certain topics in the United States in 2023
- Premium Statistic Share of K-12 public students attending predominately same-race schools U.S 2021
- Premium Statistic Share of public schools who feel understaffed U.S. 2024, by students of color
- Premium Statistic Estimated average months of learning lost due to COVID-19 by ethnicity U.S. 2020
- Premium Statistic NAEP reading scores for nine year olds U.S. 2022, by race
- Premium Statistic NAEP math scores for nine year olds U.S. 2022, by race
- Premium Statistic Share of K-12 students who feel their school respects who they are U.S. 2023, by race
- Premium Statistic Schools in the U.S.: victims of threats/injuries by weapons, by ethnicity 2021
- Premium Statistic Share of students who have experienced school shootings U.S. 1999-2024, by race
- Basic Statistic Share of teachers afraid of school shootings U.S. 2022, by location and student race
Share of K-12 public students attending predominately same-race schools U.S 2021
Share of students attending K-12 public schools in which 75 percent or more of the students are of their own race or ethnicity in the United States in the 2020-21 school year
Share of public schools who feel understaffed U.S. 2024, by students of color
Share of public schools who feel that their school is understaffed in the United States entering the 2023-24 school year, by students of color
Estimated average months of learning lost due to COVID-19 by ethnicity U.S. 2020
Estimated average months of learning lost compared with in-classroom learning due to COVID-19 in the United States in 2020, by ethnicity
NAEP reading scores for nine year olds U.S. 2022, by race
Reading scores from the National Assessment of Educational Progress for nine year old students in the United States from 2020 to 2022, by race
NAEP math scores for nine year olds U.S. 2022, by race
Mathematics scores from the National Assessment of Educational Progress for nine year old students in the United States from 2020 to 2022, by race
Share of K-12 students who feel their school respects who they are U.S. 2023, by race
Share of K-12 students who feel that their school respects who they are, regardless of their race, ethnicity, gender, or identity in the United States in 2023, by race
Schools in the U.S.: victims of threats/injuries by weapons, by ethnicity 2021
Percentage of U.S. students in grades 9–12 who reported being threatened or injured with a weapon at school in 2021, by ethnicity
Share of students who have experienced school shootings U.S. 1999-2024, by race
Share of students who have experienced school shootings in the United States from 1999 to 2024*, by race
Share of teachers afraid of school shootings U.S. 2022, by location and student race
Share of K-12 teachers who reported feeling afraid that they or their students would be a victim of attack or harm at school in the United States in 2022, by school locale and student racial composition
K-12 teachers
- Basic Statistic Teachers in elementary and secondary schools U.S. 1955-2031
- Basic Statistic U.S. elementary and secondary schools: pupil-teacher ratio 1955-2031
- Premium Statistic Impacts of restricting race, sex, and identity topics for K-12 teachers U.S. 2023
- Premium Statistic Share of public K-12 teachers who limit political or social topics in class U.S. 2023
- Premium Statistic Top reasons K-12 public school teachers limit political or social topics U.S. 2023
- Premium Statistic K-12 teachers' views on how gender identity should be taught at school U.S. 2023
- Premium Statistic K-12 teachers' support for parents to opt children out of race/gender topics U.S 2023
- Premium Statistic Top three reasons K-12 public school teachers fear for their safety U.S. 2023
- Premium Statistic Share of school staff who received concerns from parents on K-12 curriculum 2023
Teachers in elementary and secondary schools U.S. 1955-2031
Number of teachers in public and private elementary and secondary schools in the United States from 1955 to 2031 (in 1,000s)
U.S. elementary and secondary schools: pupil-teacher ratio 1955-2031
Pupil-teacher ratio in public and private elementary and secondary schools in the United States from 1955 to 2031
Impacts of restricting race, sex, and identity topics for K-12 teachers U.S. 2023
Share of public K-12 teachers who say that current debates on how public K-12 schools should be teaching certain topics like race and gender identity has impacted their ability to do their job in the United States in 2023
Share of public K-12 teachers who limit political or social topics in class U.S. 2023
Have you ever decided on your own, without being directed by school or district leaders, to limit discussion of political and social issues in class?
Top reasons K-12 public school teachers limit political or social topics U.S. 2023
What are the top three reasons you decided, on your own, to limit discussion of political and social topics in your classroom?
K-12 teachers' views on how gender identity should be taught at school U.S. 2023
Share of public K-12 teachers with various beliefs on what students should learn about gender identity at school in the United States in 2023, by grade level
K-12 teachers' support for parents to opt children out of race/gender topics U.S 2023
Share of public K-12 teachers who believe parents should be able to opt their children out of learning about racism and racial inequality or sexual orientation and gender identity if the way they are taught conflicts with the parents' personal beliefs in the United States in 2023, by party
What are the top three reasons you fear for your physical safety when you are at school?
Share of school staff who received concerns from parents on K-12 curriculum 2023
About which topics have parents expressed concerns to you?
Parent perceptions
- Premium Statistic Main reasons why parents enroll their children in private or public schools U.S. 2024
- Premium Statistic Share of Americans with various views on what school type has the best education 2023
- Premium Statistic Share of parents with select views on what school type is best U.S 2024, by gender
- Premium Statistic Parents' beliefs on how gender identity is taught in school U.S. 2022, by party
- Premium Statistic Parents with select beliefs on how slavery is taught in school U.S. 2022, by party
- Premium Statistic Perceptions on the influence of K-12 parents or school boards U.S 2022, by party
- Premium Statistic Parents who believe teachers should lead students in prayers U.S. 2022, by party
- Premium Statistic Share of K-12 parents concerned about a violent intruder at school U.S. 2023
- Premium Statistic K-12 parents' concerns on the effects of AI on their child's learning U.S. 2023
Main reasons why parents enroll their children in private or public schools U.S. 2024
Share of parents with various reasons why they chose to enroll their youngest child in a private or public school in the United States in 2024
Share of Americans with various views on what school type has the best education 2023
If it were your decision and you could select any type of school, and financial costs and transportation were of no concern, what type of school would you select in order to obtain the best education for your child?
Share of parents with select views on what school type is best U.S 2024, by gender
If given the option, what type of school would you select in order to obtain the best education for your child?
Parents' beliefs on how gender identity is taught in school U.S. 2022, by party
Share of parents of K-12 students with select beliefs on what children should learn about gender identity in school in the United States in 2022, by party
Parents with select beliefs on how slavery is taught in school U.S. 2022, by party
Share of parents of K-12 students with select beliefs on what children should learn about slavery in school in the United States in 2022, by party
Perceptions on the influence of K-12 parents or school boards U.S 2022, by party
Share of parents who believe that parents or the local school board have too much influence on what public K-12 schools are teaching in the United States in 2022, by political party
Parents who believe teachers should lead students in prayers U.S. 2022, by party
Share of parents who believe that public school teachers should be allowed to lead students in Christian prayers in the United States in 2022, by party
Share of K-12 parents concerned about a violent intruder at school U.S. 2023
Share of K-12 parents who were extremely concerned or very concerned about a violent intruder, such as a mass shooter, entering their child's/children's school in the United States in 2023, by grade of child
K-12 parents' concerns on the effects of AI on their child's learning U.S. 2023
How concerned are you about the effects of artificial intelligence, or AI, on your youngest/oldest child's learning this school year?
U.S. opinion
- Premium Statistic Share of Americans who are concerned about select issues in public schools U.S. 2023
- Premium Statistic U.S. views on who should influence LGBTQ-related school policies 2023
- Premium Statistic U.S. views on how slavery and racism should be taught in schools 2023
- Premium Statistic U.S. preferences for race-related curricula in K-12 schools 2023, by race
- Premium Statistic U.S. views on whether teachers should use students' preferred pronouns 2023
- Premium Statistic U.S. teens' comfortability with race and LGBTQ+ topics in the classroom 2023
- Premium Statistic Share of LBGTQ+ students with various reasons to drop out of high school U.S. 2021-22
- Premium Statistic Adults’ opinion on how K–12 schools should handle AI advances U.S. 2023-24
How concerned are you about the following issues in public schools in your local area?
U.S. views on who should influence LGBTQ-related school policies 2023
Share of adults who believe select groups should have a great deal of influence in deciding how to set school policy concerning discussion of LGBTQ people in the United States in 2023
U.S. views on how slavery and racism should be taught in schools 2023
Which of the following statements comes closest to your views?
U.S. preferences for race-related curricula in K-12 schools 2023, by race
Share of adults who believe various race-related curricula should be taught in K-12 schools in the United States in 2023, by race and ethnicity
U.S. views on whether teachers should use students' preferred pronouns 2023
If a teenager asks a teacher to use a particular pronoun – he, she or they – which do you think is the best policy?
U.S. teens' comfortability with race and LGBTQ+ topics in the classroom 2023
Share of teenagers who say they feel comfortable or uncomfortable when topics related to racism, racial inequality, sexual orientation, or gender identity come up in class in the United States in 2023
Share of LBGTQ+ students with various reasons to drop out of high school U.S. 2021-22
Share of LGBTQ+ students with various reasons why they do not plan to graduate high school or are unsure if they will graduate in the United States during the 2021-22 academic year
Adults’ opinion on how K–12 schools should handle AI advances U.S. 2023-24
Which of the following comes closest to your view on how K-12 schools should respond to advances in artificial intelligence (AI)?
Further reports
Get the best reports to understand your industry.
Mon - Fri, 9am - 6pm (EST)
Mon - Fri, 9am - 5pm (SGT)
Mon - Fri, 10:00am - 6:00pm (JST)
Mon - Fri, 9:30am - 5pm (GMT)
How much does the government spend on education? What percentage of people are college educated? How are kids doing in reading and math?
Table of Contents
What is the current state of education in the us.
How much does the US spend per student?
Public school spending per student
Average teacher salary.
How educated are Americans?
People with a bachelor's degree
Educational attainment by race and ethnicity.
How are kids doing in reading and math?
Proficiency in math and reading
What is the role of the government in education?
Spending on the education system
Agencies and elected officials.
The education system in America is made up of different public and private programs that cover preschool, all the way up to colleges and universities. These programs cater to many students in both urban and rural areas. Get data on how students are faring by grade and subject, college graduation rates, and what federal, state, and local governments spending per student. The information comes from various government agencies including the National Center for Education Statistics and Census Bureau.
During the 2019-2020 school year, there was $15,810 spent on K-12 public education for every student in the US.
Education spending per k-12 public school students has nearly doubled since the 1970s..
This estimate of spending on education is produced by the National Center for Education Statistics. Instruction accounts for most of the spending, though about a third includes support services including administration, maintenance, and transportation. Spending per student varies across states and school districts. During the 2019-2020 school year, New York spends the most per student ($29,597) and Idaho spends the least ($9,690).
During the 2021-2022 school year , the average public school teacher salary in the US was $66,397 .
Instruction is the largest category of public school spending, according to data from the National Center for Educational Statistics. Adjusting for inflation, average teacher pay is down since 2010.
In 2021 , 35% of people 25 and over had at least a bachelor’s degree.
Over the last decade women have become more educated than men..
Educational attainment is defined as the highest level of formal education a person has completed. The concept can be applied to a person, a demographic group, or a geographic area. Data on educational attainment is produced by the Census Bureau in multiple surveys, which may produce different data. Data from the American Community Survey is shown here to allow for geographic comparisons.
In 2021 , 61% of the Asian 25+ population had completed at least four years of college.
Educational attainment data from the Census Bureau's Current Population Survey allows for demographic comparisons across the US.
In 2022, proficiency in math for eighth graders was 26.5% .
Proficiency in reading in 8th grade was 30.8% ., based on a nationwide assessment, reading and math scores declined during the pandemic..
The National Assessment of Educational Progress (NAEP) is the only nationally representative data that measures student achievement. NAEP is Congressionally mandated. Tests are given in a sample of schools based on student demographics in a given school district, state, or the US overall. Testing covers a variety of subjects, most frequently math, reading, science, and writing.
In fiscal year 2020, governments spent a combined total of $1.3 trillion on education.
That comes out to $4,010 per person..
USAFacts categorizes government budget data to allocate spending appropriately and to arrive at the estimate presented here. Most government spending on education occurs at the state and local levels rather than the federal.
Government revenue and expenditures are based on data from the Office of Management and Budget, the Census Bureau, and the Bureau of Economic Analysis. Each is published annually, although due to collection times, state and local government data are not as current as federal data. Thus, when combining federal, state, and local revenues and expenditures, the most recent year for a combined number may be delayed.
SIGN UP FOR THE NEWSLETTER
Keep up with the latest data and most popular content.
A primer on elementary and secondary education in the United States
Editor’s Note: This report is an excerpt, with minor edits, from Addressing Inequities in the US K-12 Education System , which first appeared in Rebuilding the Pandemic Economy , published by the Aspen Economic Strategy Group in 2021.
This report reviews the basics of the American elementary and secondary education system: Who does what and how do we pay for it? While there are some commonalities across the country, the answers to both questions, it turns out, vary considerably across states. 1
Who does what?
Schools are the institution most visibly and directly responsible for educating students. But many other actors and institutions affect what goes on in schools. Three separate levels of government—local school districts, state governments, and the federal government—are involved in the provision of public education. In addition, non-governmental actors, including teachers’ unions, parent groups, and philanthropists play important roles.
Most 5- to 17-year-old children – about 88%– attend public schools. 2 (Expanding universal schooling to include up to two years of preschool is an active area of discussion which could have far-reaching implications, but we focus on grades K-12 here.) About 9% attend private schools; about a quarter of private school students are in non-sectarian schools, and the remaining three-quarters are about evenly split between Catholic and other religious schools. The remaining 3% of students are homeschooled.
Magnet schools are operated by local school districts but enroll students from across the district; magnet schools often have special curricula—for example, a focus on science or arts—and were sometimes designed specifically to encourage racial integration. Charter schools are publicly funded and operate subject to state regulations; private school regulations and homeschooling requirements are governed by state law and vary across states. Nationally, 6.8% of public school students are enrolled in charter schools; the remainder attend “traditional public schools,” where students are mostly assigned to schools based on their home address and the boundaries school districts draw. Washington, D.C. and Arizona have the highest rates of charter enrollment, with 43 and 19% of their public school students attending charter schools. Several states have little or no charter school enrollment. Prior to the COVID-19 pandemic, nearly all public schooling took place in person, with about 0.6% of students enrolled in virtual schools.
Local School Districts
Over 13,000 local education agencies (LEAs), also known as school districts, are responsible for running traditional public schools. The size and structure of local school districts, as well as the powers they have and how they operate, depend on the state. Some states have hundreds of districts, and others have dozens. District size is mostly historically determined rather than a reflection of current policy choices. But while districts can rarely “choose” to get smaller or larger, district size implicates important trade-offs . Having many school districts operating in a metropolitan area can enhance incentives for school and district administrators to run schools consistent with the preferences of residents, who can vote out leaders or vote with their feet by leaving the district. On the other hand, fragmentation can lead to more segregation by race and income and less equity in funding, though state laws governing how local districts raise revenue may address the funding issues. Larger districts can benefit from economies of scale as the fixed costs of operating a district are spread over more students and they are better able to operate special programs, but large districts can also be difficult to manage. And even though large districts have the potential to pool resources between more- and less-affluent areas, equity challenges persist as staffing patterns lead to different levels of spending at schools within the same district.
School boards can be elected or appointed, and they generally are responsible for hiring the chief school district administrator, the superintendent. In large districts, superintendent turnover is often cited as a barrier to sustained progress on long term plans, though the causation may run in the other direction: Making progress is difficult, and frustration with reform efforts leads to frequent superintendent departures. School districts take in revenue from local, state, and federal sources, and allocate resources—primarily staff—to schools. The bureaucrats in district “central offices” oversee administrative functions including human resources, curriculum and instruction, and compliance with state and federal requirements. The extent to which districts devolve authority over instructional and organizational decisions to the school level varies both across and within states.
State Governments
The U.S. Constitution reserves power over education for the states. States have delegated authority to finance and run schools to local school districts but remain in charge when it comes to elementary and secondary education. State constitutions contain their own—again, varying—language about the right to education, which has given rise to litigation over the level and distribution of school funding in nearly all states over the past half century. States play a major role in school finance, both by sending aid to local school districts and by determining how local districts are allowed to tax and spend, as discussed further below.
State legislatures and state education agencies also influence education through mechanisms outside the school finance system. For example, states may set requirements for teacher certification and high school graduation, regulate or administer retirement systems, determine the ages of compulsory schooling, decide how charter schools will (or will not) be established and regulated, set home-schooling requirements, establish curricular standards or approve specific instructional materials, choose standardized tests and proficiency standards, set systems for school accountability (subject to federal law), and create (or not) education tax credits or vouchers to direct public funds to private schools. Whether and how states approach these issues—and which functions they delegate to local school districts—varies considerably.
Federal Government
The authority of the federal government to direct schools to take specific actions is weak. Federal laws protect access to education for specific groups of students, including students with disabilities and English language learners. Title IX prohibits sex discrimination in education, and the Civil Rights Act prohibits discrimination on the basis of race. The U.S. Department of Education issues regulations and guidance on K-12 laws and oversees grant distribution and compliance. It also collects and shares data and funds research. The Bureau of Indian Education is housed in the Department of the Interior, not the Department of Education.
The federal government influences elementary and secondary education primarily by providing funding—and through the rules surrounding the use of those funds and the conditions that must be met to receive federal funding. Federal aid is typically allocated according to formulas targeting particular populations. The largest formula-aid federal programs are Title I of the Elementary and Secondary Education Act (ESEA), which provides districts funds to support educational opportunity, and the Individuals with Disabilities Education Act (IDEA), for special education. Both allocate funding in part based on child poverty rates. State and school district fiscal personnel ensure that districts comply with rules governing how federal funds can be spent and therefore have direct influence on school environments. Since 1965, in addition to specifying how federal funds can be spent, Congress has required states and districts to adopt other policies as a condition of Title I receipt. The policies have changed over time, but most notably include requiring school districts to desegregate, requiring states to adopt test-based accountability systems, and requiring the use of “evidence-based” approaches.
IDEA establishes protections for students with disabilities in addition to providing funding. The law guarantees their right to a free and appropriate public education in the least restrictive setting and sets out requirements for the use of Individualized Educational Programs. Because of these guarantees, IDEA allows students and families to pursue litigation. Federal law prohibits conditioning funding on the use of any specific curriculum. The Obama Administration’s Race to the Top program was also designed to promote specific policy changes—many related to teacher policy—but through a competitive model under which only select states or districts “won” the funds. For the major formula funds, like Title I and IDEA, the assumption (nearly always true) is that states and districts will adopt the policies required to receive federal aid and all will receive funds; in some cases, those policy changes may have more impact than the money itself. The federal government also allocated significant funding to support schools during the Great Recession and during the COVID-19 pandemic through specially created fiscal stabilization or relief funds; federal funding for schools during the COVID crisis was significantly larger than during the Great Recession.
The federal tax code, while perhaps more visible in its influence on higher education, also serves as a K-12 policy lever. The controversial state and local tax deduction, now limited to $10,000, reduces federal tax collections and subsidizes progressive taxation for state and local spending, including for education. As of 2018, 529 plans, which historically allowed tax-preferred savings only for higher education expenses, can also be used for private K-12 expenses.
Non-Governmental Actors
Notable non-governmental actors in elementary and secondary education include teachers’ unions and schools of education, along with parents, philanthropists, vendors, and other advocates.The nation’s three million public school teachers are a powerful political force, affecting more than just teachers’ compensation. For example, provisions of collective bargaining agreements meant to improve teachers working conditions also limit administrator flexibility. Teachers unions are also important political actors; they play an active role in federal, state, and school board elections and advocate for (or, more often, against) a range of policies affecting education. Union strength varies considerably across U.S. states.
Both states and institutions of higher education play important roles in determining who teaches and the preparation they receive. Policies related to teacher certification and preparation requirements, ranging from whether teachers are tested on academic content to which teachers are eligible to supervise student teachers, vary considerably across states. 3 Meanwhile, reviews of teacher training programs reveal many programs do not do a good job incorporating consensus views of research-based best practices in key areas. To date, schools of education have not been the focus of much policy discussion, but they would be critical partners in any changes to how teachers are trained.
Parents play an important role, through a wide range of channels, in determining what happens in schools. Parents choose schools for their children, either implicitly when they choose where to live or explicitly by enrolling in a charter school, private school, participating in a school district choice program, or homeschooling, though these choices are constrained by income, information, and other factors. They may also raise money through Parent Teacher Associations (PTAs) or other foundations—and determine how it is spent. And they advocate for (or against) specific policies, curriculum, or other aspects of schooling through parent organizations, school boards, or other levels of government. Parents often also advocate for their children to receive certain teachers, placements, evaluation, or services; this is particularly true for parents of students with disabilities, who often must make sure their children receive legally required services and accommodations. Though state and federal policymakers sometimes mandate parent engagement , these mechanisms do not necessarily provide meaningful pathways for parental input and are often dominated by white and higher-SES parents .
Philanthropy also has an important influence on education policy, locally and nationally. Not only do funders support individual schools in traditional ways, but they are also increasingly active in influencing federal and state laws. Part of these philanthropic efforts happen through advocacy groups, including civil rights groups, religious groups, and the hard-to-define “education reform” movement. Finally, the many vendors of curriculum, assessment, and “edtech” products and services bring their own lobbying power.
Paying for school
Research on school finance might be better termed school district finance because districts are the jurisdictions generating and receiving revenue, and districts, not schools, are almost always responsible for spending decisions. School districts typically use staffing models to send resources to schools, specifying how many staff positions (full-time equivalents), rather than dollars, each school gets.
Inflation-adjusted, per-pupil revenue to school districts has increased steadily over time and averaged about $15,500 in 2018-19 (total expenditure, which includes both ongoing and capital expenditure, is similar but we focus on revenue because we are interested in the sources of revenue). Per-pupil revenue growth tends to stall or reverse in recessions and has only recently recovered to levels seen prior to the Great Recession (Figure 1). On average, school districts generated about 46% of their revenue locally, with about 80% of that from property taxes; about 47% of revenue came from state governments and about 8% from the federal government. The share of revenue raised locally has declined from about 56% in the early 1960s to 46% today, while the state and federal shares have grown. Local revenue comes from taxes levied by local school districts, but local school districts often do not have complete control over the taxes they levy themselves, and they almost never determine exactly how much they spend because that depends on how much they receive in state and federal aid. State governments may require school districts to levy certain taxes, limit how much local districts are allowed to tax or spend, or they may implicitly or explicitly redistribute some portion of local tax revenue to other districts.
Both the level of spending and distribution of revenue by source vary substantially across states (Figure 2), with New York, the highest-spending state, spending almost $30,000 per pupil, while Idaho, Utah, and Oklahoma each spent under $10,000 per pupil. (Some, but far from all, of this difference is related to higher labor costs in New York.) Similarly, the local share of revenue varies from less than 5% in Hawaii and Vermont to about 60% in New Hampshire and Nebraska. On average, high-poverty states spend less, but there is also considerable variation in spending among states with similar child poverty rates.
Discussions of school funding equity—and considerable legal action—focus on inequality of funding across school districts within the same state . While people often assume districts serving disadvantaged students spend less per pupil than wealthier districts within a state, per-pupil spending and the child poverty rate are nearly always uncorrelated or positively correlated, with higher-poverty districts spending more on average. Typically, disadvantaged districts receive more state and federal funding, offsetting differences in funding from local sources. Meanwhile, considerable inequality exists between states, and poorer states spend less on average. Figure 3 illustrates an example of this dynamic, showing the relationship between district-level per-pupil spending and the child poverty rate in North Carolina (a relatively low-spending state with county- and city-based districts) and Illinois (a higher-spending state with many smaller districts). In North Carolina, higher poverty districts spend more on average; Illinois is one of only a few states in which this relationship is reversed. But this does not mean poor kids get fewer resources in Illinois than in North Carolina. Indeed, nearly all districts in Illinois spend more than most districts in North Carolina, regardless of poverty rate.
Figure 4 gives a flavor of the wide variation in per-pupil school spending. Nationally, the district at the 10th percentile had per-pupil current expenditure of $8,800, compared to $18,600 at the 90th percentile (for these calculations we focus on current expenditure, which is less volatile year-to-year, rather than revenue). Figure 4 shows that this variation is notably not systematically related to key demographics. For example, on average, poor students attend school in districts that spent $13,023 compared to $13,007 for non-poor students. The average Black student attends school in a district that spent $13,485 per student, compared to $12,918 for Hispanic students and $12,736 for White students. 4 School districts in high-wage areas need to spend more to hire the same staff, but adjusting spending to account for differences in prevailing wages of college graduates (the second set of bars) does not change the picture much.
Does this mean the allocation of spending is fair? Not really. First, to make progress reducing the disparities in outcomes discussed above, schools serving more disadvantaged students will need to spend more on average. Second, these data are measured at the school district level, lumping all schools together. This potentially masks inequality across (as well as within) schools in the same district.
The federal government now requires states to report some spending at the school level; states have only recently released these data. One study using these new data finds that within districts, schools attended by students of color and economically-disadvantaged students tend to have more staff per pupil and to spend more per pupil. These schools also have more novice teachers. How could within-district spending differences systematically correlate with student characteristics, when property taxes and other revenues for the entire district feed into the central budget? Most of what school districts buy is staff, and compensation is largely based on credentials and experience. So schools with less-experienced teachers spend less per pupil than those with more experienced ones, even if they have identical teacher-to-student ratios. Research suggests schools enrolling more economically disadvantaged students, or more students of color, on average have worse working conditions for teachers and experience more teacher turnover. Together, this means that school districts using the same staffing rules for each school—or even allocating more staff to schools serving more economically disadvantaged students—would have different patterns in spending per pupil than staff per pupil.
[1] : For state-specific information, consult state agency websites (e.g., Maryland State Department of Education) for more details. You can find data for all 50 states at the U.S. Department of Education’s National Center for Education Statistics , and information on state-specific policies at the Education Commission of the States .
[2] : The numbers in this section are based on the most recent data available in the Digest of Education Statistics, all of which were collected prior to the COVID-19 pandemic.
[3] : See the not-for-profit National Council on Teacher Quality for standards and reviews of teacher preparation programs, and descriptions of state teacher preparation policies.
[4] : These statistics may be particularly surprising to people given the widely publicized findings of the EdBuild organization that, “ Nonwhite school districts get $23 billion less than white school districts. ” The EdBuild analysis estimates gaps between districts where at least 75% of students are non-White versus at least 75% of students are White. These two types of districts account for 53% of enrollment nationally. The $23 billion refers to state and local revenue (excluding federal revenue), whereas we focus on current expenditure (though patterns for total expenditure or total revenue are similar).
Disclosures: The Brookings Institution is financed through the support of a diverse array of foundations, corporations, governments, individuals, as well as an endowment. A list of donors can be found in our annual reports published online here . The findings, interpretations, and conclusions in this report are solely those of its author(s) and are not influenced by any donation .
About the Authors
Sarah reber, joseph a. pechman senior fellow – economic studies, nora gordon, professor – mccourt school of public policy, georgetown university.
State Grades on K-12 Achievement: 2021 Map and Rankings
- Share article
Examine the grades and scores that states and the nation earned on the K-12 Achievement Index in Quality Counts 2021, along with how they scored on a host of indicators that go into those rankings.
For a description of what these education indicators mean, view the grading scale and methodology .
In March 2024, Education Week announced the end of the Quality Counts report after 25 years of serving as a comprehensive K-12 education scorecard. In response to new challenges and a shifting landscape, we are refocusing our efforts on research and analysis to better serve the K-12 community. For more information, please go here for the full context or learn more about the EdWeek Research Center .
Sign Up for EdWeek Update
Edweek top school jobs.

Sign Up & Sign In

Show/Hide Columns:
Featured Publication:
Report card on american education: 22nd edition.
The status quo is not working. Whether by international comparisons, state and national proficiency measures, civic literacy rates, or career preparedness, American students are falling behind. The 22nd edition of the Report Card on American Education ranks states on their K-12 education and policy performance.
Keep up-to-date on the latest campaigns & news
The Bottom Line What Will It Take to Put U.S. K-12 Education on a Better Path?
There’s no question that public school students have experienced learning loss since the COVID-19 pandemic began in March 2020. Closed schools, remote instruction, and reduced school hours have made the loss inevitable for most. The exceptions are students who received supplemental learning support beyond what their public schools provided – whether from parents, grandparents, older siblings, tutors, learning centers, or online resources.
Northwest Evaluation Association (NWEA), a research-based nonprofit that assesses student progress and proficiency, recently released a report on learning during COVID-19. It found that students started the 2021–2022 school year with a 9- to 11-percentile-point decline in math and a 3- to 7-percentile-point decline in reading. The learning loss was greater among Hispanic, American Indian, and black students than among Asian and white students. Additionally, high-poverty students had greater than average learning loss.
The learning loss leads to substantial economic effects. According to an analysis from Dan Goldhaber, Thomas Kane, and Andrew McEachin, the deficit represents $43,800 in lifetime earnings per student. Multiply that by the 50 million students currently enrolled in public schools, and the figure is staggering: $2 trillion. Clearly, the impact is not only hurting our students today but will also be carried with them into their adult years.
The U.S. K-12 education system must change from adult-focused to student-focused, input-focused to output-focused, teaching-focused to learning-focused, group-focused to individual-focused, and time-focused to competency-focused. Keri D. Ingraham
Goldhaber, Kane, and McEachin provide additional insights regarding how long it will take for students to recover. For example, they noted that in grades four and five, it would take “an additional eight to 10 weeks of instruction to cover the loss in reading and math, respectively. In grades 6 through 8, where the material is more complex and students’ rate of progress slows, it would take an additional 14 and 19 weeks of instruction to cover those losses in reading and math, respectively.”
Parents want this learning loss remedied. At-home remote learning not only revealed to them how inefficient the education system was but also demonstrated the vastly differing learning needs among students. Consequently, parents are no longer satisfied with the ineffective one-size-fits-all approach – 95 percent of parents support tailored instruction as the key to recovering student learning loss and improving K-12 education. Parents understand that every child is uniquely wired, with differing strengths and interests. It’s illogical to conclude that all children will learn in the same way and at the same rate – but that’s how our current system operates.
This leads to a pivotal question: What stands in the way of personalizing education? With $800 billion annually devoted to K-12 public education (expanded by an additional nearly $200 billion of federal funding during the pandemic), the problem is clearly not lack of money. Nor can it be a lack of technology, as virtually every student now has an Internet-connected device during the school day. Ultimately, what stands in the way is a stagnant system, with its dearth of leadership and innovation and its entrenched interests that staunchly maintain the status quo.
We can and must do better for our students. What will it take to make up for the learning loss and set the United States’ K-12 education system on a better trajectory? It’s going to take one state to set an example – one state to show the courage to make policy changes that challenge entrenched interests, break down constraints to innovation, and open the door for a new breed of education leaders who will champion personalized learning.
These policy changes must address everything from increasing competition through universal school choice, allowing funding to follow students, promoting and expanding education savings accounts, supporting charter schools, awarding credit for learning activities outside school, redesigning the school year and day, and revamping grade levels and graduation requirements. Additionally, changes must be made to the curriculum, instruction methods, assessments, teacher and administrator certification, teacher seniority pay, and school-board selection processes. Foundational to making the required reforms is granting schools and districts the flexibility to innovate. And making these changes will only be possible if we transform how we select and train education leaders.
It’s going to take one state changing the system from adult-focused to student-focused, input-focused to output-focused, teaching-focused to learning-focused, group-focused to individual-focused, and time-focused to competency-focused. This will require the governor, state legislature, and state educational establishment to unite around a common vision and work together. Such a transformation can only occur in a state willing to break the power of teacher unions and their domination of employment policies, teaching philosophies and practices, and educational purse strings.
If we can get just one state to flip K-12 education on its head, other states will follow, in time.
Which state has the courage and leadership to lead the way?
- assessments
- changing the education system
- closed school
- competency focused
- education savings accounts
- funding following students
- graduation requirements
- instruction methods
- K-12 education
- learning focused
- learning loss
- math scores
- parent dissatisfaction
- personalized education
- policy changes
- public schools
- reading scores
- remote learning
- school choice
- school closures
- state level
- student focused
- student learning
- teacher certification
- teacher performance pay
- teacher unions

The State of Education: Rebuilding a More Equitable System
Covid-19 has exposed long-standing inequities in america’s education system..
The pandemic’s toll on our education system has had a broader effect on academic regressions than initially predicted. And the most vulnerable learners—students of color, those from low socioeconomic backgrounds, and students with additional learning needs—have been impacted the most. While the pandemic has exacerbated existing disparities, it’s also presented a unique opportunity to dramatically overhaul our education system.
We convened education advocates and practitioners, from both K–12 and higher education, to explain how the disruption of the pandemic is pushing forward long-overdue pedagogical reform. And we outlined the innovative solutions that should be implemented to create an equitable learning environment for all students.
Atlantic subscribers enjoy access to exclusive sessions and experiences.
Sign up to receive updates.
Subject to The Atlantic's Privacy Policy and Terms and Conditions .
Underwritten by
Dr. Mildred García
President, American Association of State Colleges and Universities
Adam Harris
Staff writer, The Atlantic
Dr. John B. King, Jr.
President and CEO, The Education Trust
Dr. Sonja Santelises
CEO, Baltimore City Schools
Susan Saulny
Contributor, AtlanticLIVE
Agenda Mar 3
Virtual or in-person.
Virtual / In-Person
Where Does Education Reform Go from Here?
A session presented by bill & melinda gates foundation.
Produced by our underwriter and not The Atlantic ’s editorial team.
Implementing Solutions
Closing remarks, event details, virtual event.
Wednesday, March 3, 2021
1:00 pm EDT
Subscribe to The Atlantic
Unlock unlimited access to The Atlantic, including exclusive events for subscribers. Join us today and help ensure a bright future for independent journalism.
Related Events
The education summit.
October 27, 2022 Virtual Event
October 26, 2021 Virtual Event
May 14, 2019 Washington, D.C.
Education Summit 2018
May 1, 2018 Washington, D.C.
U.S. Government Accountability Office
K-12 Education
Issue summary.
The U.S. Department of Education and other federal agencies work to ensure that 50 million students in K-12 public schools have access to a safe, quality education. However, a history of discriminatory practices has contributed to inequities in education, which are intertwined with disparities in wealth, income, and housing. Moreover, there are ongoing concerns about the safety and well-being of all students. To help address these issues, Education should strengthen its oversight of key programs, policies, and data collections.
For example:
- The COVID-19 pandemic disrupted learning for millions of students during the 2020-21 school year. Certain student populations were more likely to face significant obstacles to learning in a virtual environment—such as high-poverty students and students learning English. Some children also never attended class during the 2020-2021 school year.
- As the COVID-19 pandemic has led to increased use of remote education, K-12 schools across the nation have increasingly reported ransomware and other types of cyberattacks. Federal agencies offer products and services to help schools prevent and respond to cyberattacks. But Education's plan for addressing risks to schools was issued in 2010 and needs an update to deal with changing cybersecurity risks.
- The U.S. is experiencing a shortage of teachers – a problem that worsened during the COVID-19 pandemic amid reports of teachers leaving the profession, fewer new teachers entering, and schools struggling to hire teachers. While Education has introduced a strategy to address these issues, progress can be made to ensure its efforts are working.
- While nearly all public school districts require students to adhere to dress codes, concerns about equity in school dress codes have included the detrimental effects of removing students from the classroom for dress code violations. A review of a nationally representative sample of public school district dress codes revealed school dress codes more frequently restrict items typically worn by girls. Additionally, rules about hair and head coverings can disproportionately affect Black students and those of certain religions and cultures.
- School districts spend billions of dollars a year (primarily from local government sources) on building and renovating facilities at the nearly 100,000 K-12 public schools nationwide. A survey of school facilities brought up common issues and priorities, such as improving security , expanding technology, and addressing health hazards. Additionally, about half of districts reported needing to update or replace multiple systems like heating, ventilation, and air conditioning (HVAC) or plumbing. Accessing public school facilities was also reported as a challenge, with survey results showing that two-thirds of school districts had facilities with physical barriers that may limit access for students with disabilities.
- Even before the pandemic, virtual public school enrollment was growing—mostly in virtual charter schools. Compared to students in brick-and-mortar public schools, 2018-2019 data showed that a lower percentage of virtual school students took state achievement tests, and their scores were significantly lower. Also, Education officials said the virtual environment makes it harder to monitor attendance. Certain federal funds are allocated using attendance data, so there's a risk that virtual schools could get more or less funding than they should.
- Education requires public school districts to biennially report incidents of restraint (restricting a student’s movement) and seclusion (confining a student to a space alone). However, Education’s data quality checks may not catch misreporting or statistical outliers. For instance, 70% of districts reported 0 incidents of restraint and seclusion, but Education’s quality check only applies to fewer than 100 large districts. Education also doesn’t have a quality check for districts reporting relatively high incident rates—such as one that reported an average of 71 restraint incidents per student per year.
- A review of school shooting data found that half were committed by current or former students. Suburban and rural, wealthier, and low-minority schools had more school-targeted shootings; such shootings were the most fatal and most commonly committed by students. Urban, poor, and high-minority schools had more shootings overall and were more motivated by disputes; these shootings were often committed by non-students or unknown shooters.

Recent Reports
K-12 Education: DOD Should Assess Whether Troops-to-Teachers is Meeting Program Goals
K-12 Education: Additional Guidance Could Improve the Equitable Services Process for School Districts and Private Schools
K-12 Education: New Charter Schools Receiving Grants to Open Grew Faster Than Peers
K-12 Education: Education Should Assess Its Efforts to Address Teacher Shortages
K-12 Education: Department of Education Should Provide Information on Equity and Safety in School Dress Codes
K-12 Education: Charter Schools That Received Federal Funding to Open or Expand Were Generally Less Likely to Close Than Other Similar Charter Schools
K-12 Education: Student Population Has Significantly Diversified, but Many Schools Remain Divided Along Racial, Ethnic, and Economic Lines
Pandemic Learning: Less Academic Progress Overall, Student and Teacher Strain, and Implications for the Future
Pandemic Learning: Teachers Reported Many Obstacles for High-Poverty Students and English Learners As Well As Some Mitigating Strategies
Special Education: DOD Programs and Services for Military-Dependent Students with Disabilities
District of Columbia Charter Schools: DC Public Charter School Board Should Include All Required Elements in Its Annual Report
Related Pages
Related Coronavirus Oversight
Related Race in America
GAO Contacts

- Share full article
Advertisement
Supported by
current events conversation
What Students Are Saying About How to Improve American Education
An international exam shows that American 15-year-olds are stagnant in reading and math. Teenagers told us what’s working and what’s not in the American education system.

By The Learning Network
Earlier this month, the Program for International Student Assessment announced that the performance of American teenagers in reading and math has been stagnant since 2000 . Other recent studies revealed that two-thirds of American children were not proficient readers , and that the achievement gap in reading between high and low performers is widening.
We asked students to weigh in on these findings and to tell us their suggestions for how they would improve the American education system.
Our prompt received nearly 300 comments. This was clearly a subject that many teenagers were passionate about. They offered a variety of suggestions on how they felt schools could be improved to better teach and prepare students for life after graduation.
While we usually highlight three of our most popular writing prompts in our Current Events Conversation , this week we are only rounding up comments for this one prompt so we can honor the many students who wrote in.
Please note: Student comments have been lightly edited for length, but otherwise appear as they were originally submitted.
Put less pressure on students.
One of the biggest flaws in the American education system is the amount of pressure that students have on them to do well in school, so they can get into a good college. Because students have this kind of pressure on them they purely focus on doing well rather than actually learning and taking something valuable away from what they are being taught.
— Jordan Brodsky, Danvers, MA
As a Freshman and someone who has a tough home life, I can agree that this is one of the main causes as to why I do poorly on some things in school. I have been frustrated about a lot that I am expected to learn in school because they expect us to learn so much information in such little time that we end up forgetting about half of it anyway. The expectations that I wish that my teachers and school have of me is that I am only human and that I make mistakes. Don’t make me feel even worse than I already am with telling me my low test scores and how poorly I’m doing in classes.
— Stephanie Cueva, King Of Prussia, PA
I stay up well after midnight every night working on homework because it is insanely difficult to balance school life, social life, and extracurriculars while making time for family traditions. While I don’t feel like making school easier is the one true solution to the stress students are placed under, I do feel like a transition to a year-round schedule would be a step in the right direction. That way, teachers won’t be pressured into stuffing a large amount of content into a small amount of time, and students won’t feel pressured to keep up with ungodly pacing.
— Jacob Jarrett, Hoggard High School in Wilmington, NC
In my school, we don’t have the best things, there are holes in the walls, mice, and cockroaches everywhere. We also have a lot of stress so there is rarely time for us to study and prepare for our tests because we constantly have work to do and there isn’t time for us to relax and do the things that we enjoy. We sleep late and can’t ever focus, but yet that’s our fault and that we are doing something wrong. School has become a place where we just do work, stress, and repeat but there has been nothing changed. We can’t learn what we need to learn because we are constantly occupied with unnecessary work that just pulls us back.
— Theodore Loshi, Masterman School
As a student of an American educational center let me tell you, it is horrible. The books are out dated, the bathrooms are hideous, stress is ever prevalent, homework seems never ending, and worst of all, the seemingly impossible feat of balancing school life, social life, and family life is abominable. The only way you could fix it would be to lessen the load dumped on students and give us a break.
— Henry Alley, Hoggard High School, Wilmington NC
Use less technology in the classroom (…or more).
People my age have smaller vocabularies, and if they don’t know a word, they just quickly look it up online instead of learning and internalizing it. The same goes for facts and figures in other subjects; don’t know who someone was in history class? Just look ‘em up and read their bio. Don’t know how to balance a chemical equation? The internet knows. Can’t solve a math problem by hand? Just sneak out the phone calculator.
My largest grievance with technology and learning has more to do with the social and psychological aspects, though. We’ve decreased ability to meaningfully communicate, and we want everything — things, experiences, gratification — delivered to us at Amazon Prime speed. Interactions and experiences have become cheap and 2D because we see life through a screen.
— Grace Robertson, Hoggard High School Wilmington, NC
Kids now a days are always on technology because they are heavily dependent on it- for the purpose of entertainment and education. Instead of pondering or thinking for ourselves, our first instinct is to google and search for the answers without giving it any thought. This is a major factor in why I think American students tests scores haven’t been improving because no one wants to take time and think about questions, instead they want to find answers as fast as they can just so they can get the assignment/ project over with.
— Ema Thorakkal, Glenbard West HS IL
There needs to be a healthier balance between pen and paper work and internet work and that balance may not even be 50:50. I personally find myself growing as a student more when I am writing down my assignments and planning out my day on paper instead of relying on my phone for it. Students now are being taught from preschool about technology and that is damaging their growth and reading ability. In my opinion as well as many of my peers, a computer can never beat a book in terms of comprehension.
— Ethan, Pinkey, Hoggard High School in Wilmington, NC
Learning needs to be more interesting. Not many people like to study from their textbooks because there’s not much to interact with. I think that instead of studying from textbooks, more interactive activities should be used instead. Videos, websites, games, whatever might interest students more. I’m not saying that we shouldn’t use textbooks, I’m just saying that we should have a combination of both textbooks and technology to make learning more interesting in order for students to learn more.
— Vivina Dong, J. R. Masterman
Prepare students for real life.
At this point, it’s not even the grades I’m worried about. It feels like once we’ve graduated high school, we’ll be sent out into the world clueless and unprepared. I know many college students who have no idea what they’re doing, as though they left home to become an adult but don’t actually know how to be one.
The most I’ve gotten out of school so far was my Civics & Economics class, which hardly even touched what I’d actually need to know for the real world. I barely understand credit and they expect me to be perfectly fine living alone a year from now. We need to learn about real life, things that can actually benefit us. An art student isn’t going to use Biology and Trigonometry in life. Exams just seem so pointless in the long run. Why do we have to dedicate our high school lives studying equations we’ll never use? Why do exams focusing on pointless topics end up determining our entire future?
— Eliana D, Hoggard High School in Wilmington, NC
I think that the American education system can be improved my allowing students to choose the classes that they wish to take or classes that are beneficial for their future. Students aren’t really learning things that can help them in the future such as basic reading and math.
— Skye Williams, Sarasota, Florida
I am frustrated about what I’m supposed to learn in school. Most of the time, I feel like what I’m learning will not help me in life. I am also frustrated about how my teachers teach me and what they expect from me. Often, teachers will give me information and expect me to memorize it for a test without teaching me any real application.
— Bella Perrotta, Kent Roosevelt High School
We divide school time as though the class itself is the appetizer and the homework is the main course. Students get into the habit of preparing exclusively for the homework, further separating the main ideas of school from the real world. At this point, homework is given out to prepare the students for … more homework, rather than helping students apply their knowledge to the real world.
— Daniel Capobianco, Danvers High School
Eliminate standardized tests.
Standardized testing should honestly be another word for stress. I know that I stress over every standardized test I have taken and so have most of my peers. I mean they are scary, it’s like when you take these tests you bring your No. 2 pencil and an impending fail.
— Brennan Stabler, Hoggard High School in Wilmington, NC
Personally, for me I think standardized tests have a negative impact on my education, taking test does not actually test my knowledge — instead it forces me to memorize facts that I will soon forget.
— Aleena Khan, Glenbard West HS Glen Ellyn, IL
Teachers will revolve their whole days on teaching a student how to do well on a standardized test, one that could potentially impact the final score a student receives. That is not learning. That is learning how to memorize and become a robot that regurgitates answers instead of explaining “Why?” or “How?” that answer was found. If we spent more time in school learning the answers to those types of questions, we would become a nation where students are humans instead of a number.
— Carter Osborn, Hoggard High School in Wilmington, NC
In private school, students have smaller class sizes and more resources for field trips, computers, books, and lab equipment. They also get more “hand holding” to guarantee success, because parents who pay tuition expect results. In public school, the learning is up to you. You have to figure stuff out yourself, solve problems, and advocate for yourself. If you fail, nobody cares. It takes grit to do well. None of this is reflected in a standardized test score.
— William Hudson, Hoggard High School in Wilmington, NC
Give teachers more money and support.
I have always been told “Don’t be a teacher, they don’t get paid hardly anything.” or “How do you expect to live off of a teachers salary, don’t go into that profession.” As a young teen I am being told these things, the future generation of potential teachers are being constantly discouraged because of the money they would be getting paid. Education in Americans problems are very complicated, and there is not one big solution that can fix all of them at once, but little by little we can create a change.
— Lilly Smiley, Hoggard High School
We cannot expect our grades to improve when we give teachers a handicap with poor wages and low supplies. It doesn’t allow teachers to unleash their full potential for educating students. Alas, our government makes teachers work with their hands tied. No wonder so many teachers are quitting their jobs for better careers. Teachers will shape the rest of their students’ lives. But as of now, they can only do the bare minimum.
— Jeffery Austin, Hoggard High School
The answer to solving the American education crisis is simple. We need to put education back in the hands of the teachers. The politicians and the government needs to step back and let the people who actually know what they are doing and have spent a lifetime doing it decide how to teach. We wouldn’t let a lawyer perform heart surgery or construction workers do our taxes, so why let the people who win popularity contests run our education systems?
— Anders Olsen, Hoggard High School, Wilmington NC
Make lessons more engaging.
I’m someone who struggles when all the teacher does is say, “Go to page X” and asks you to read it. Simply reading something isn’t as effective for me as a teacher making it interactive, maybe giving a project out or something similar. A textbook doesn’t answer all my questions, but a qualified teacher that takes their time does. When I’m challenged by something, I can always ask a good teacher and I can expect an answer that makes sense to me. But having a teacher that just brushes off questions doesn’t help me. I’ve heard of teachers where all they do is show the class movies. At first, that sounds amazing, but you don’t learn anything that can benefit you on a test.
— Michael Huang, JR Masterman
I’ve struggled in many classes, as of right now it’s government. What is making this class difficult is that my teacher doesn’t really teach us anything, all he does is shows us videos and give us papers that we have to look through a textbook to find. The problem with this is that not everyone has this sort of learning style. Then it doesn’t help that the papers we do, we never go over so we don’t even know if the answers are right.
— S Weatherford, Kent Roosevelt, OH
The classes in which I succeed in most are the ones where the teachers are very funny. I find that I struggle more in classes where the teachers are very strict. I think this is because I love laughing. Two of my favorite teachers are very lenient and willing to follow the classes train of thought.
— Jonah Smith Posner, J.R. Masterman
Create better learning environments.
Whenever they are introduced to school at a young age, they are convinced by others that school is the last place they should want to be. Making school a more welcoming place for students could better help them be attentive and also be more open minded when walking down the halls of their own school, and eventually improve their test scores as well as their attitude while at school.
— Hart P., Bryant High School
Students today feel voiceless because they are punished when they criticize the school system and this is a problem because this allows the school to block out criticism that can be positive leaving it no room to grow. I hope that in the near future students can voice their opinion and one day change the school system for the better.
— Nico Spadavecchia, Glenbard West Highschool Glen Ellyn IL
The big thing that I have struggled with is the class sizes due to overcrowding. It has made it harder to be able to get individual help and be taught so I completely understand what was going on. Especially in math it builds on itself so if you don’t understand the first thing you learn your going to be very lost down the road. I would go to my math teacher in the morning and there would be 12 other kids there.
— Skyla Madison, Hoggard High School in Wilmington, NC
The biggest issue facing our education system is our children’s lack of motivation. People don’t want to learn. Children hate school. We despise homework. We dislike studying. One of the largest indicators of a child’s success academically is whether or not they meet a third grade reading level by the third grade, but children are never encouraged to want to learn. There are a lot of potential remedies for the education system. Paying teachers more, giving schools more funding, removing distractions from the classroom. All of those things are good, but, at the end of the day, the solution is to fundamentally change the way in which we operate.
Support students’ families.
I say one of the biggest problems is the support of families and teachers. I have heard many success stories, and a common element of this story is the unwavering support from their family, teachers, supervisors, etc. Many people need support to be pushed to their full potential, because some people do not have the will power to do it on their own. So, if students lived in an environment where education was supported and encouraged; than their children would be more interested in improving and gaining more success in school, than enacting in other time wasting hobbies that will not help their future education.
— Melanie, Danvers
De-emphasize grades.
I wish that tests were graded based on how much effort you put it and not the grade itself. This would help students with stress and anxiety about tests and it would cause students to put more effort into their work. Anxiety around school has become such a dilemma that students are taking their own life from the stress around schoolwork. You are told that if you don’t make straight A’s your life is over and you won’t have a successful future.
— Lilah Pate, Hoggard High School in Wilmington, NC
I personally think that there are many things wrong with the American education system. Everyone is so worried about grades and test scores. People believe that those are the only thing that represents a student. If you get a bad grade on something you start believing that you’re a bad student. GPA doesn’t measure a students’ intelligence or ability to learn. At young ages students stop wanting to come to school and learn. Standardized testing starts and students start to lose their creativity.
— Andrew Gonthier, Hoggard High School in Wilmington, NC
Praise for great teachers
Currently, I’m in a math class that changed my opinion of math. Math class just used to be a “meh” for me. But now, my teacher teachers in a way that is so educational and at the same time very amusing and phenomenal. I am proud to be in such a class and with such a teacher. She has changed the way I think about math it has definitely improve my math skills. Now, whenever I have math, I am so excited to learn new things!
— Paulie Sobol, J.R Masterman
At the moment, the one class that I really feel supported in is math. My math teachers Mrs. Siu and Ms. Kamiya are very encouraging of mistakes and always are willing to help me when I am struggling. We do lots of classwork and discussions and we have access to amazing online programs and technology. My teacher uses Software called OneNote and she does all the class notes on OneNote so that we can review the class material at home. Ms. Kamiya is very patient and is great at explaining things. Because they are so accepting of mistakes and confusion it makes me feel very comfortable and I am doing very well in math.
— Jayden Vance, J.R. Masterman
One of the classes that made learning easier for me was sixth-grade math. My teacher allowed us to talk to each other while we worked on math problems. Talking to the other students in my class helped me learn a lot quicker. We also didn’t work out of a textbook. I feel like it is harder for me to understand something if I just read it out of a textbook. Seventh-grade math also makes learning a lot easier for me. Just like in sixth-grade math, we get to talk to others while solving a problem. I like that when we don’t understand a question, our teacher walks us through it and helps us solve it.
— Grace Moan, J R Masterman
My 2nd grade class made learning easy because of the way my teacher would teach us. My teacher would give us a song we had to remember to learn nouns, verbs, adjectives, pronouns, etc. which helped me remember their definitions until I could remember it without the song. She had little key things that helped us learn math because we all wanted to be on a harder key than each other. She also sang us our spelling words, and then the selling of that word from the song would help me remember it.
— Brycinea Stratton, J.R. Masterman
- How It Started
- The Policy Circle Team
- Civic Leadership Engagement Roadmap
- In The News
- 2022 Annual Report & Stories of Impact
- Join Our Community
- Join The Policy Circle: Invest in Your Future
- The Conversation Blog
Education: K-12
Education is the pathway to a productive life. All people need basic literacy, math skills, and knowledge of the world around them to function in today’s society and to be informed citizens. But despite increased spending, our educational outcomes as a nation are stagnant. How can the U.S. education system better prepare young people for their adulthood and careers? This brief gives an overview of the major topics within K-12 education and some ideas for reform with the goal of every student having access to an education that equips them with the knowledge and skills they need to be self-reliant and successful in the 21st century.
Table of Contents
Introduction, putting it in context, role of government, challenges and areas for reform, ways to get involved/what you can do, thought leaders and additional resources.
- Suggestions for Your Next Conversation
View the Executive Summary for this brief.
Listen to the Trust Your Voice Podcast for an audio version of this brief.
Watch The Policy Circle’s Conversation with Education Trailblazer Ian Rowe
Why it Matters
A quality education provides the foundation upon which one can build a productive life. Yet, based on recent evaluations, U.S. education lags behind other developed nations and declined in the wake of the Covid-19 pandemic. The latest 2023 report from the National Assessment of Educational Progress (NAEP), otherwise known as the Nation’s Report Card, ” revealed the “ single largest drop in math in 50 years and no signs of academic recovery following the disruptions of the pandemic. “
Prior to the pandemic, studies of American students indicate little improvement in education over the last several decades, even though spending continues to increase.
Through education, students obtain a breadth of knowledge and learn fundamental skills for critical thinking, future learning, employment, independence, and the confidence to accomplish their dreams. A quality education provides opportunities to learn about the world and opens doors to determining and fulfilling dreams and ambitions, enabling individuals to establish themselves and contribute to society.
George Washington proposed the U.S.’s first public education system as he left office in 1796 “to grow the country economically, but also to create a well-informed populace to participate in America’s newly founded democracy.” In the 17th century, New England colonies and townships first established mostly religious-based schools, which evolved to primarily teach elite children how to read and write. The general public’s education depended almost entirely on families, communities, and churches.
The earliest form of what we now understand as “public schools” were called Common Schools . These schools were parent-funded by tuition and housed students of all ages – as young as five to adults – in one room with one teacher and sparse materials. With rapid population growth and mass immigration in the late 1800-early 1900s, public education became a way to provide social integration, English learning, and a shared experience among children from a variety of backgrounds in addition to academics. By the mid-19th century, education became almost entirely a public endeavor . A systematic structure for education truly began to take shape when schools became more publicly available and the federal government created the Department of Education in 1867 . The purpose of the agency remains the same today: to collect information on educational outcomes and teaching, and to assist states in providing effective education systems. Federal aid to states periodically increased throughout the 20th century to include vocational education in agriculture and industry, and a surge in scientific, mathematical, and technical fields for national defense.
By the Numbers
The National Center for Education Statistics(NCES) report from 2019-2020 indicates U.S. schools number just under 130,000:
Public schools: 98,469
Pre-kindergarten, elementary, and middle: 70,039
Secondary and high school: 23,529
Other: 4,901
Private Schools: 30,492
Pre-kindergarten, elementary, and middle: 18,870
Secondary and high school: 3,626
Other: 7,996
NCES reports that pre-k through grade 12 public school enrollment in the fall of 2021 totaled approximately 49.5 million , and 4.7 million students attend private schools.
As of the 2020-2021 school year, public schools employ approximately 3,032,471 teachers , while private schools employ about half a million teachers .
Women make up just over 75% of all public and private school teachers. In public schools particularly, women comprise 89% of elementary school teachers, 72% of middle school teachers, and 60% of high school teachers.
Over $751 billion was spent on public K-12 education across local, state, and federal levels for the 2020 fiscal year . Here’s a regional look . Per pupil expenditures, also known as PPE, averaged $13,200 per student nationwide.
The U.S. Constitution does not directly address education. The 10th Amendment states:
“ The powers not delegated to the United States by the Constitution, nor prohibited by it to the States, are reserved to the States respectively, or to the people.”
In plain terms, this amendment limits the federal government only to the powers provided by the Constitution and gives states, and thereby the people, the power to govern themselves. The real beauty of this amendment is that our founding fathers sought to ensure State autonomy.
How does this work in education? First, the federal government passes legislation. In turn, the federal agency establishes regulations to implement the legislation, states determine their own laws and regulations, and, finally, local education agencies (school districts) establish policies to implement state laws and regulations.
Legislation
Presently, the mission of the U.S. Department of Education is to promote “ educational excellence and equal access ” and provide a portion of monetary support to states. The U.S.’s very first piece of education legislation was the National Defense Education Act (NDEA) passed by Congress in 1958 to provide monetary support for schools to boost American competition with the Soviet Union” in response to the Soviet launch of Sputnik .
The next decade brought significant change to legislation addressing education in the U.S. and widely addressed equal access for all students. The Civil Rights Act of 196 4 expressly provides protections against discrimination in public education on the basis of race, Title IX of the Education Amendments of 1972 prohibits discrimination on the basis of gender, and the Rehabilitation Act of 1973 (specifically Section 504 ) expressly provides protections against discrimination against individuals with disabilities.
Not only were these three pieces of legislation pivotal in providing protections against discrimination, but they also prohibit discrimination by recipients of federal funds. Quite simply, any state or local education agency that receives federal funds is prohibited from discriminating against students on the basis of race, sex, or disability.
Additionally, the 1965 Elementary and Secondary Education Act (ESEA) provides federal grants to improve the overall quality of elementary and secondary education. Title I of the ESEA is a program that provides federal aid to local education agencies and schools with high percentages of low-income children. The funds are intended to help schools with additional resources to provide all children meet state academic standards.
In 2002, the No Child Left Behind Act (NCLB) updated the ESEA and increased school accountability to educate disadvantaged students to the federal government. The law required states to test all K-12 students to indicate educational progress or lack thereof and linked federal funds based on test results.
In 2015, the Every Student Succeeds Act (ESSA) reauthorized the ESEA, replacing NCLB but maintaining the federal government’s requirements for schools to continually work to improve educational outcomes for disadvantaged students. The improved ESSA offered new grants and funding for schools to provide more support to districts, schools, and resources for teachers to work towards the goal of a “full educational opportunity” for all students.
Federal money flows to states primarily through grants designed to minimize funding gaps. These grants rely on formulas that consider the needs of each state, the average cost of education for students, and estimated poverty data from the Census. For this reason, some states receive more than others ; Alaska, Mississippi, South Dakota, and New Mexico all received at least 13% of their revenue from the federal government in 2019, while New Jersey, New Hampshire, Massachusetts, Connecticut, and New York received less than 5% of their revenue from the federal government.
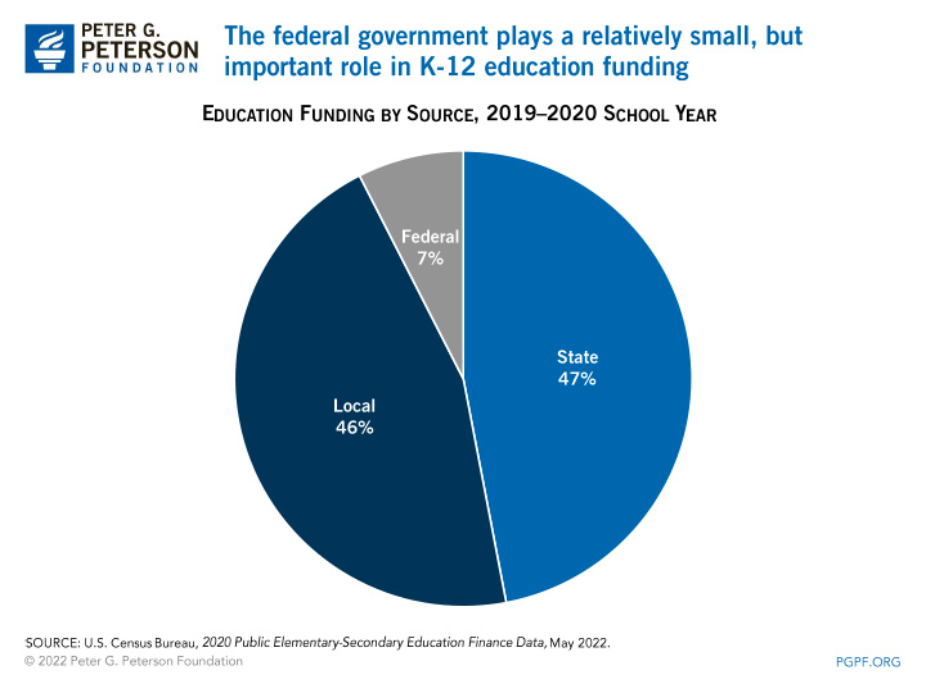
According to recent data, of the roughly $771.1 billion in expenditures for public elementary and secondary schools during the 2019-2020 school year, only 8% came from the federal government. This includes contributions from the U.S. Department of Education and other federal agencies including the Department of Health and Human Services (which runs the Head Start program ) and the Department of Agriculture (which runs the School Lunch program ). The majority of federal funding usually comes in the form of Title I funds, special education programs, and child nutrition programs.
Another important source of federal funding is supplemental funds for K-12 schools to educate children with disabilities. The Individuals with Disabilities Act , specifically Part B, stipulates the U.S. government will assist states in the endeavor to provide special education and related services to ensure children with disabilities receive a free and appropriate public education, also called FAPE. In the 2020-2021 school year, the U.S. provided $11.6 billion to states for the purpose of educating 7.2 million (15% of the total) children enrolled in special education. The majority of the responsibility falls to the states, as outlined above.
State and Local
The Equal Protection Clause of the 14th Amendment requires states to provide each child equal access to public education. Children are assigned to the nearest public schools based on where they live, also known as zoning . There are just under 50 million students attending 91,328 public schools in 13,452 school districts in the U.S. See a full list here .
At the local level, school districts are “governed by multiple-member boards that oversee school district policies, finances, superintendents, and collective bargaining agreements with teachers and other staff.” At the state level, each state has a department or agency that oversees elementary and secondary public education. An elected or appointed state executive , usually referred to as the superintendent of schools or chief school administrator, heads the department. At both the state and local levels, school board members are either elected or appointed by mayors or governors. School boards share authority with local government or state departments of education. See The Policy Circle’s Understanding School Boards Engagement Guide for more on this topic.
State legislators set state budgets and use funding formulas to determine how much each school district will receive from the state. Each state’s funding formula is meant “to diminish somewhat the high degree of inequality in revenues per pupil that would result if funding were based only on local taxable resources and the willingness of local citizens to tax themselves,” and thus “provide at least some limited degree of ‘equalization’ of spending and resources” for all districts across the state. The state applies funding towards operations (e.g. salaries and benefits for teaching, guidance counseling, materials like textbooks, transportation, and facilities like libraries) as well as maintenance and construction of public schools.
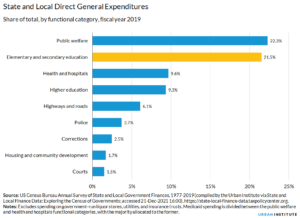
State and local funding are almost equal to a national average, with state governments providing around 47% of revenue and local governments providing about 45%. But individual state shares vary widely ; Hawaii has no local educational agencies, so almost 90% of funding comes from the state. On the other hand, the District of Columbia has no state government, so almost 90% of its revenue comes from local sources. You can see your state’s distribution in this Congressional Research Service Report (last updated 2019).
Revenues are raised mainly from taxes; state revenues mostly come from income and sales taxes, while property taxes generate local revenue.
Spending and Outcomes
According to data from the National Center for Education Statistics (NCES), total public elementary and secondary school spending amounted to $800 billion for the 2018-2019 school year). Per-pupil spending increased every year since 2015. The largest increase of 5% occurred during the 2019-2020 school year in response to the COVID-19 pandemic.
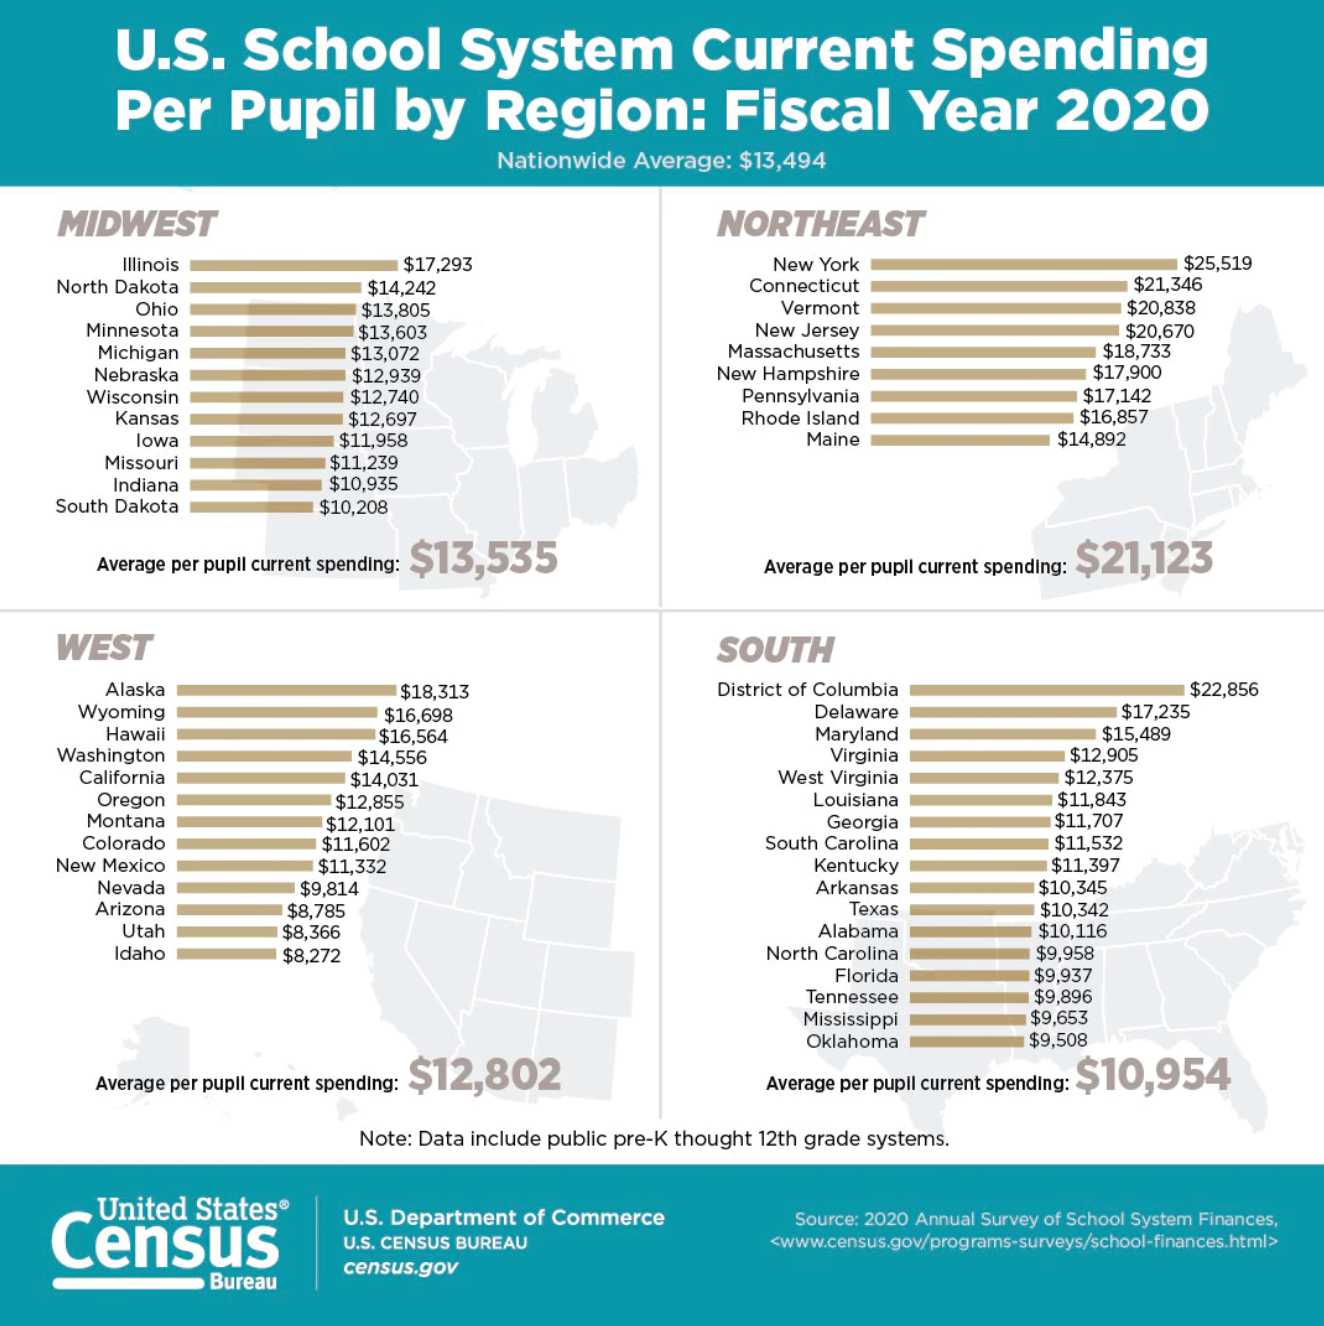
“Money can matter, but spending more on schools does not yield big improvements,” explains Mark Dynarski of Brookings Institution . Despite overall spending increases, the “ Nation’s Report Card ” from the National Assessment of Educational Progress (NAEP) reveals there has been little improvement in student performance since 2011. A 2019 report from Michigan State University analyzing long-term education spending trends found that, based on the NAEP scores, “ there was no clear correlation between spending increases and test improvements from 2003-2015.” According to the latest NAEP results as of June 2023, students scores in reading and math plunged.
U.S. student performance amidst higher spending has remained stagnant at an international level as well. In 2018, the U.S. average spending per K-12 student ($14,400, including capital expenditures) was 34% higher than the average spending for Organization for Economic Cooperation and Development (OECD) countries ($10,800). Despite the spending differences, results from the Programme for International Student Assessment (PISA), which measures performance in reading, math, and science among 15-year-olds in dozens of countries every three years, show U.S. scores have not significantly changed since the early 2000s. The most recent PISA results, from 2018 , placed the U.S. 13th in reading, 37th in math, and 17th in science out of 77 education systems.
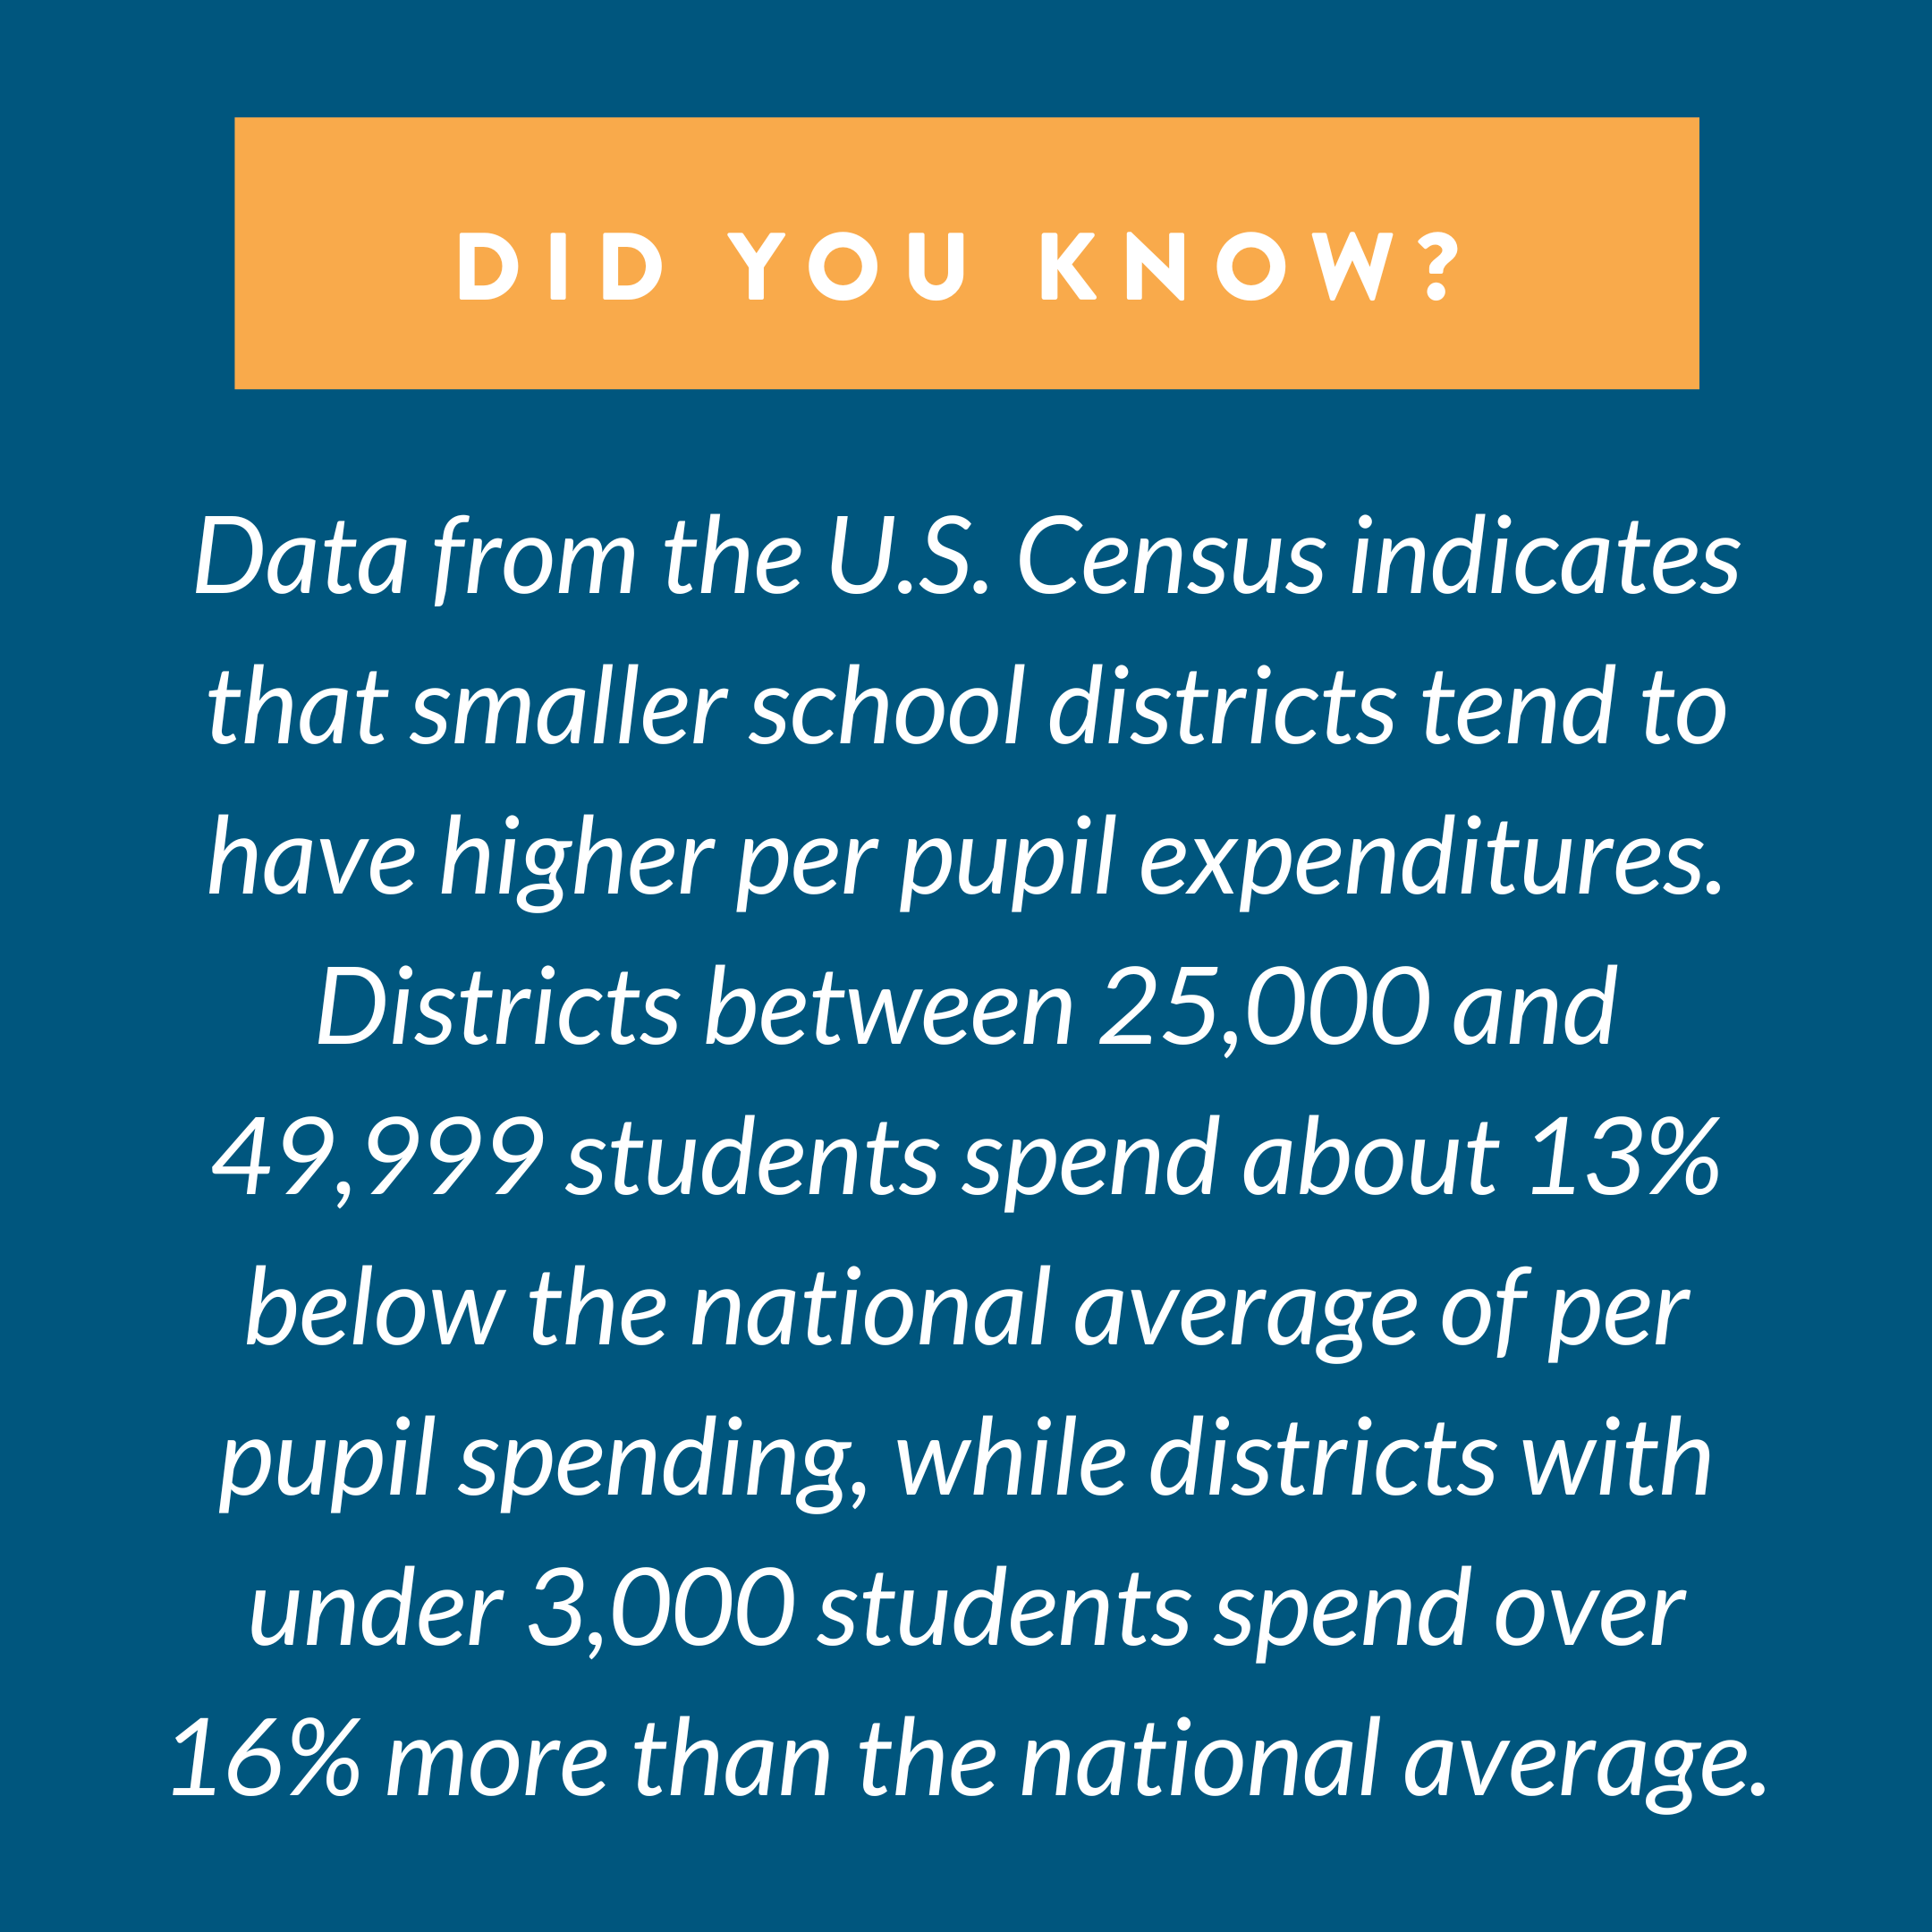
Evidence that indicates how money is spent, rather than how much money is spent, plays an important role in the conversation about funding for public schools. Students in predominantly low-income districts often have the greatest need for educational services and resources. A 2018 report from the Education Trust compared the most recent data on educational spending and found that even if governments could decrease the per pupil spending gap with additional funds, the issue of equitable spending was still significant; meaning additional funds did not quite close the gap between available resources to schools, teachers, and, ultimately, students.
How does this influence educational outcomes?
Preliminary data suggest a link between state education finance reforms and higher test scores among students, higher rates of high school graduation, and better earnings among graduates. State education finance reforms typically increase overall spending and specifically increase spending in low-income districts relative to high-income districts. Because some reforms are not temporary increases, they allow lower-income schools to make long-term investments. Finance reforms have been shown to reduce achievement gaps between high- and low-income school districts. A National Bureau of Economic Research paper found “ significant gains for students in poorer school districts in the wake of court-ordered state funding increases.” However, if either temporary or long-term finance reforms do not address or provide improvements to resources, curricula, and teacher development, the increase in outcomes is short-term.
“ Equalizing resources among districts is a poorly targeted approach for mitigating achievement gaps arising from differences in household incomes that exist within districts.”
Many education policy leaders, parents, and advocates are now increasingly raising concerns about how school funding is really being spent and where money is allocated. The national conversation about education, teachers, and funding has gained traction in the last couple of years as the country returns to pre-COVID conditions and outcomes are reported .
Literacy is one of the most impactful areas of education. Explore how spending and other factors that impact education influence literacy in our brief: Failing Grade: Literacy in America
According to reports from state education agencies to NCES, the projected number of public school teachers is 3,032,471 in 2021, which puts the student/teacher ratio at 15.4. This is a 17% drop from 3,679,000 public school teachers in 2019.
Each state requires its own qualifications to teach in K-12 schools; a teaching certificate, a bachelor’s degree, state licensure, or advanced degrees depending on the subject or “assignment” taught. At a minimum, states require individuals to become certified in the state to teach. The U.S. Department of Education indicates states are required to report teacher qualifications to the federal government to ensure qualified individuals teach students and that the state distributes qualified teachers equally. Information regarding teacher qualifications is “public information” which means the public has access to some, but not all, personnel records of district employees. The Freedom of Information Act (FOIA) protects the information. If you are curious about your child’s educator, contact your state or school district administration to inquire.
Teachers’ pay is determined by qualifications, undergraduate and postgraduate degrees, advanced certifications, and experience. A public school teacher’s total earned income in 2018 was $62,200, while a private school teacher’s salary started at $50,340. Salary estimates for the 2020-2021 school year put public school teachers at $65,090 . Teacher pay fluctuates between states and even between neighboring school districts. See what your state pays teachers here .
In his 2017 study, “ Back to the Staffing Surge, ” Professor Ben Scafidi notes that “the productivity of American public schools has fallen rather dramatically over the past few decades. And, in retrospect, the staffing surge in American public schools has appeared to have been a costly failure.”
This video synopsis explains further (8 min):
Teacher quality matters when it comes to student outcomes. Hoover Institute Senior Fellow Eric Hanushek comments on a 2012 article “Great Teaching” that the “evidence shows that bad teachers cost hundreds of thousands of dollars in lost income and productivity each year that they remain in the classroom.” According to a University of Melbourne review of over 65,000 papers exploring the effects of various classroom interventions, “‘[a]ll of the 20 most powerful ways to improve school-time learning identified by the study depended on what a teacher did in the classroom.’”
PolicyEd explains why investing in good teachers pays off (1 min):
Since teachers must obtain minimum qualifications to teach K-12, which determines salaries coupled with experience, many seek to advance their qualifications.
The U.S. Department of Education’s TEACH Grant Program offers up to $4,000 yearly to students who plan to become teachers who agree to serve four (4) years teaching in a high-need teaching field and underserved school. Another federal program offered by the DOE is the Teacher Quality Programs (TQP) which aims to “improve our nation’s schools and student achievement” by supporting state efforts to improve and retain quality teachers and principals and encouraging local education agencies to partner with communities and postsecondary schools.
Similarly, the National Education Association ( NEA ), one of the two main teacher unions in the nation (discussed below) offers grants to teachers for professional development and prospective teachers to aid in the costs associated with obtaining state licensure or certification.
Teach For America is a program that finds educational leaders and offers extensive leadership courses and opportunities to enhance their understanding of the needs of underserved populations. The program requires members to teach low-income students in a public school setting for at least two years with the goal of partnering with the community to better meet the needs of the students.
In the 2021 fiscal year, the federal government appropriated $5,571,845 for the National Professional Development Program which aims to improve instruction for English Learners.
Teacher unions originated as local associations and “grassroots efforts to support teachers through improved salaries, benefits, and working conditions.” The two largest unions, the National Education Association (NEA) and the American Federation of Teachers (AFT) were first organized in 1857 and 1916, respectively, to represent the interests of the profession and improve salaries and working conditions for teachers. Now, almost 70% of all public school teachers affiliate with teachers’ unions or an employee association.
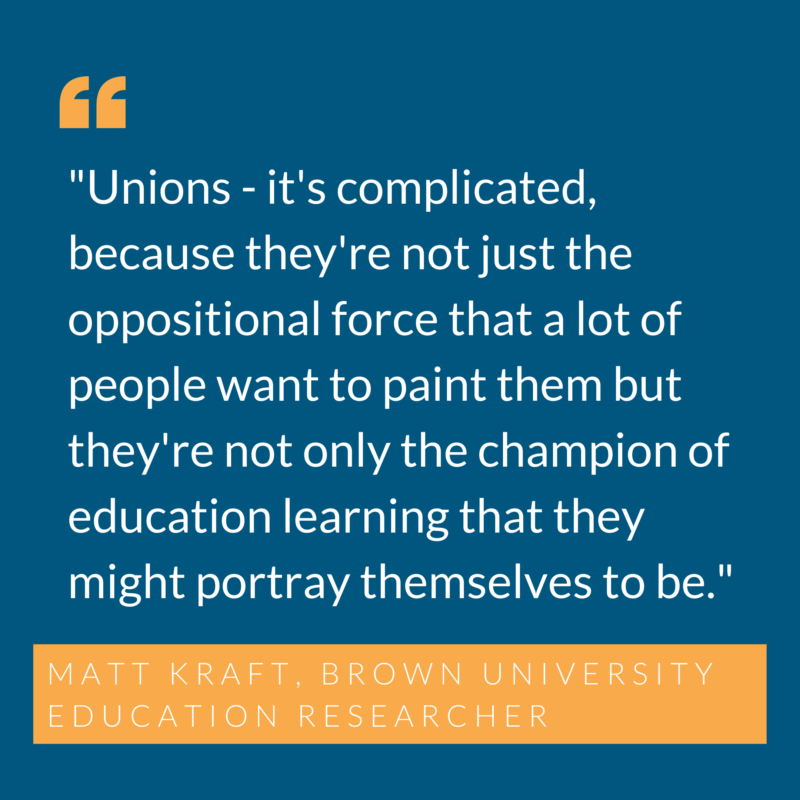
Whether teachers’ unions’ effect is positive or negative remains a key debate in education reform. A 2018 study from the University of Michigan found that “ states with stronger unions saw more of the money earmarked for education actually reach the classrooms” or used for teacher compensation; whereas states with weak unions saw funding for schools being used to cut local property taxes.
Unions acquire funding through donations, dues, and fees paid by members and non-members who stand to benefit from union efforts. Political spending and endorsements by teacher unions is an area of debate. . A Pennsylvania-based education policy organization, the Commonwealth Foundation , reported the NEA spent roughly $45 million on political activities in 2016-2017.
Unions faced considerable scrutiny over their resistance to returning students to in-person learning in some states in the fall of 2020 and 2021. Forbes reports private and religious-based schools found creative ways to get their students learning again, which public school districts could have, but failed to, model to deliver students similar learning and instructional opportunities.
Compensation
What was once occasional news, teacher strikes made headlines at the beginning of the 2022-2023 school year. The strikes bring attention to the issue of teacher pay, as it has in previous years, but additional federal funds in response to the COVID-19 pandemic spurred additional requests by teacher unions. Teachers in Columbus, Ohio went on strike for the first time since 1975 over salaries, classrooms, building conditions, student-to-teacher ratios, and resources, among other issues.
According to NCES data from 2016, 16% of public elementary and secondary school teachers have summer jobs and 6% have second jobs during the school year, which makes up 5-10% of their annual income. See this Business Insider report for a state-by-state ranking accounting for salary.
Real spending on education has increased by almost 40% since the 1990s , but teachers have seen little of this in their salaries. Per pupil spending increased between 1992 and 2014 by 27%, but teacher salaries decreased by 2% over that same period. Education scholar Frederick Hess calculated teacher salaries in West Virginia would have increased by more than $17,000 since the early 1990s if salaries had increased at the same rate as per-pupil spending.
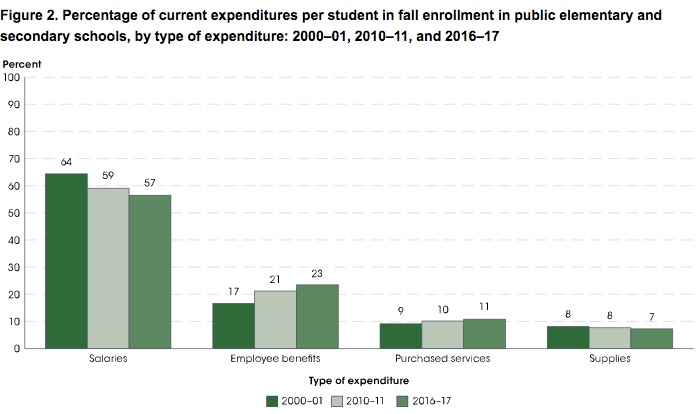
On the other hand, substantial retirement and healthcare benefits make total teacher compensation higher than average salaries indicate. Public school teachers receive over $6 per hour in retirement compensation; the average civilian employee receives less than $2 per hour in retirement benefits. However, in some cases where school funding has gone up, payments go to paying down pension debt rather than funding better benefits for current teachers. According to Chad Adleman of Bellwether Education Partners , teacher salaries in Kentucky would be $11,400 higher “if the state wasn’t forced to spend vast sums paying down pension debt.” Paying for existing obligations remains a challenge that many states have yet to figure out.
The teacher strikes that were common in 2018 and 2019 had a lull during the coronavirus pandemic, during which time teachers had to manage “ unprecedented classroom concerns , such as masking, vaccinations, remote learning, and hybrid learning,” and found themselves “ on the front lines of a mental health crisis among adolescents who also incurred significant academic losses due to remote learning[.]” These demands and pressures have left many teachers citing burnout. In 2020, there was a record drop in public education employment, and in 2022 strikes restarted in cities from Minneapolis to Chicago to Sacramento.
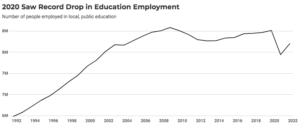
Some states and districts are considering using leftover funds from the American Rescue Plan to offer raises and signing bonuses, but whether these incentives can spark long-term change and offset problems in the education system that have been growing for years remains to be seen. For example, staffing shortages are not new; student loan debt has increased, and many college graduates tend to select careers that pay more than teaching.
Education Choice
Another component of education reform debates centers around school choice. Some argue that families should be able to access the best school for their child, particularly among low-income or minority student groups, or students with specific educational needs such as autism or physical needs such as cerebral palsy. Advocates argue that if parents can choose the school that is best for their child, it can generate better quality educational options and promote greater access to higher quality or more specifically designed education.
This report maintains that the public school system is designed to provide an equal education for all students to promote an equal, standardized education in the U.S.’s economic prosperity, funded by taxpayer dollars. As determined earlier in this brief, public schools are funded by the number of students who attend them; therefore, funding streams diminish if students seek an education outside the public education system.
Recently, religious-based schools have received harsh criticism for taking federal funds but failing to provide a basic education to students . Students interviewed for the article stated they “graduated” from one of these schools but still had to teach themselves how to read and write. NYC Mayor Eric Adams called for an independent investigation. Here’s the link for the New York Times investigation .
Some are concerned that school choice may negatively affect public schools by taking students and funding away from struggling district schools, or those lower-income families with few additional resources will not be able to take advantage of school choice options.
The latest polling and report from Edchoice.org also showcases continued support for school choice policies from both school parents and the general public alike.
This video by Kite & Key Media gives an overview of the origins of and some of the problems with the education system (7 min):
School Choice Week further breaks down the types of schools in K-12 Education (2 min):
According to Edchoice.org , “School vouchers give parents the freedom to choose a private school for their children, using all or part of the public funding set aside for their children’s education. Under such a program, funds typically spent by a school district would be allocated to a participating family in the form of a voucher to pay partial or full tuition for their child’s private school, including both religious and non-religious options.”
There are 29 voucher programs operating in 16 states , Washington, D.C., and Puerto Rico, of which just under 250,000 students are recipients.
Tax Credit Scholarships
Tax credit scholarships “allow taxpayers to receive full or partial tax credits when they donate to nonprofits that provide private school scholarships. Eligible taxpayers can include both individuals and businesses. In some states, scholarship-giving nonprofits also provide innovation grants to public schools and/or transportation assistance to students choosing alternative public schools.”
There are 26 tax credit scholarship programs in 21 states , of which just under 330,000 students are recipients.
Education Savings Account (ESA)
Education Savings Accounts (ESAs) are a more recent innovation in parent choice programs that “allow parents to withdraw their children from public district or charter schools and receive a deposit of public funds into government-authorized savings accounts with restricted, but multiple uses such as private school tuition or outside educational services.”
ESAs gained attention due to the coronavirus pandemic when Congress proposed the Education Freedom Scholarships and Opportunity Act (EFS). Through an annual federal tax credit for businesses and individuals who donate to certain certified organizations, funds would pay for K-12 education options such as private school tuition, private tutoring, online classes, instructional materials for home education, and even after-school or daycare programs. In the short term, EFS serves as a means of providing emergency assistance to students and their families. The California Policy Center , for example, notes parents have been investigating options such as virtual schools, homeschooling, and private schools. Others argue this would undermine public schools that are struggling and facing budget cuts amidst the pandemic. Conversely, educational innovation has been a positive result of the COVID-19 pandemic as parents explore alternative, and possibly more appropriate, options outside of the public school system, and districts must now compete.
For more on ESAs and EFS, see The Policy Circle’s Education Savings Accounts Brief , or watch The Policy Circle’s Virtual Circle Discussion (46 min):
For a deeper exploration into School Choice listen to Sylvie Legeré’s Podcast Episode: Hostages No More with Guest Former US Secretary of Education Betsy DeVos.
For what school choice options exist in your state, see the National Conference of State Legislature’s guide .
Vocational Schools
Vocational and career and technical education (CTE) is “‘organized education programs offering a sequence of courses which are directly related to the preparation of individuals in paid or unpaid employment.’” This avenue of career training provided students with labor market skills while preparing them for jobs in technical fields.
In the 1980s, there was a shift away from vocational and CTE classes as schools increased academic requirements for students. In an effort to push high school graduates to apply to college, vocational and CTE classes were dismissed by claims that vocational training in high school would lead to “dead end jobs.” Conversely, some high school graduates likely will not succeed in college and seek gainful employment in a vocational skill or trade after graduation. This argument , combined with the reality of worker shortages in skilled professions , led to increased attention towards vocational and CTE training as the potential difference between high- and low-paying jobs for many students. In 2018, legislators proposed over 250 CTE-related bills in 42 states , mostly to increase state funding for programs, and the numbers have only increased since.
The development of regional vocational and technical high schools , entire schools devoted to vocational and career-oriented instruction, also indicates vocational training is viewed as more than just auto mechanics. Today, it “ encompasses everything from welding, to sports management, to computer science.” Programs such as P-Tech , a partnership with IBM, and other programs incorporate dual enrollment opportunities with local community colleges or apprenticeships. Engaging with local businesses can also ensure students are getting skills that lead to employment, especially in a local job market. For more on CTE and vocational training, see The Policy Circle’s Creating Career Pathways Brief .
Early Childhood Education
Research is fairly clear that high-quality early childhood education is an important part of student success. Longitudinal studies find that “those who participated in these early childhood educational interventions persist in education, have higher earnings and commit fewer crimes than the control group.”
Some studies of government-funded preschool programs, such as Head Start, have found evidence of “ fadeout, ” which indicates that higher test scores early on fade as they move into grade school. While other studies show the programs work “particularly for students who otherwise would not be in center-based care.” According to the RAND Corp. , in preliminary assessments, “researchers found that returns of $2 to $4 were typical for every dollar invested in early childhood programs,” on top of social benefits such as school readiness that continue into adulthood.
Summer Learning Loss
“ Summer learning loss ” describes scores that decline over the summer, which results in students starting the year behind where they should be. According to a Brookings report, studies found on average, “students’ achievement scores declined over summer vacation by one month’s worth of school-year learning.”
This disproportionally particularly affects low-income students based on the “ faucet theory, ” that all students have access to resources during the school year, but the flow of resources slows or stops for students from low-income backgrounds.
Summer vacation can be important to help students retain, or even master, academic skills. Professor Paul T. von Hipper of the University of Texas at Austin claims “ every summer offers children who are behind a chance to catch up .” However, summer program coordinators have trouble attracting high-quality teachers as well as appealing to students and families to participate. Program costs are another dilemma, especially for low-income students. Professors David Quinn and Morgan Polikoff of the University of Southern California suggest that lower-cost home-based summer programming can still positively affect learning outcomes. Additionally, when extensive school-based options are infeasible, districts can pursue more cost-effective strategies such as targeted interventions for “students most at risk of backsliding.”
“The educational attainment of people living in rural (nonmetropolitan) areas has increased markedly over time but has not kept pace with urban (metropolitan) gains,” says the U.S. Department of Agriculture Economic Research Service. Low populations of students and difficulty recruiting teachers present a challenge in rural areas. On the opposite end of the spectrum, inner cities and urban districts also face staffing and funding shortages. Problems associated with urban poverty, including housing, food insecurity, high dropout rates, criminal justice system involvement, and high proportions of students whose first language is not English, also pose challenges to educators in inner cities.
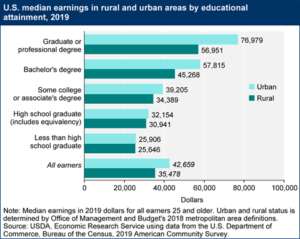
Online Learning & The Digital Divide
Online education can be a cost-effective means to fill gaps and offer more course choices and access, but the quality of online schools varies greatly . Additionally, the issue of the “ digital divide ,” that not all households have access to reliable high-speed internet, presents a problem for many students. See The Policy Circle’s Digital Landscape Brief for more on the digital divide.
The problem has become even more prominent due to the coronavirus pandemic. A poll in California at the beginning of the pandemic revealed 50% of low-income families said they lack sufficient devices to access distance learning at home. Nationally, principals in the highest-poverty schools reported a full 20% of students did not have adequate access to internet services at home.
Online learning also requires technology proficiency for teachers and access to resources necessary to teach and virtually engage students. A RAND analysis of the American Educator Panel’s Fall 2020 COVID-19 Surveys found 80% of teachers reported feelings of burnout since the start of the pandemic, and two-thirds reported they did not receive adequate guidance on how to support students. Resources that support teachers can help them best implement personalized learning through flexible approaches and interventions for students at risk of falling behind or dropping out.
Detailed assessments of each school in the district can help identify what stressors impact the ability of children to learn, which, in turn, will help determine what resources can be leveraged to meet students’ needs. Understanding the needs of students, families, and communities can open avenues of communication with local philanthropic organizations, utility and technology providers, and businesses for public-private partnerships.
Professor Paul Reville of Harvard’s Graduate School of Education suggests taking advantage of youth-serving organizations and institutions to form “children’s cabinets,” which can “bring together community members, government officials, business leaders, parent organizations, and student organizations to develop strategies to better student outcomes.” For example , school buses outfitted with Wi-Fi were used as hotspots in South Carolina; Staples in Tennessee began printing materials free of charge for students who could not afford it; and partnerships with Comcast brought free internet to students in school districts including Caldo Parish, Louisiana, and Philadelphia, Pennsylvania .
The Coronavirus & The Future of Schools
While some believe the negative side effects of learning disruptions will fade by the time students complete their education, the abrupt shutdowns brought to the forefront “ needs which have been so glaringly exposed in this crisis ,” ranging from food deficits and inadequate access to health and mental health resources to housing instability and inadequate access to educational technology and internet services. The resource-based advantages and disadvantages between students will likely affect the extent to which K-12 students experience learning loss .
The most recently reported findings by NCES in The Nation’s Report Card compared learning in 2020 to 2022. The study indicates decreases in math and reading scores in all student categories, high- and low-performing students alike.
Congressional relief aid for K-12 schools came in the form of the $2 trillion stimulus package (CARES Act) in March 2021, which included $13.2 billion for K-12 schools. Calls for action at the federal level continue, as states and school districts “are not only overstrained but also facing imminent budget cuts caused by the pandemic, with an inability to incur deficit spending.” The federal spending bill passed in March 2022 increased public school spending by $2 billion over 2021 funding levels.
According to the State Policy Network , a significant weakness in the education system is that it is “built for one approach and a single learning style,” causing the pivot to virtual learning all the more difficult for schools, teachers, and students. Emma García, an education economist at the Economic Policy Institute, highlights the limitations of standardized testing , especially in a virtual learning environment. Assessments besides standardized tests tailored towards online learning or representative of various learning styles, such as diagnostic tests, project-based assessments, or capstone projects, can better measure students’ progress.
Finally, schools play essential roles in non-academic areas . The CARES Act touched upon this with over $25 billion for SNAP and child nutrition programs, as well as a key provision that gave school districts greater flexibility in providing meals to students and their families. This provision, which Congress extended through September 2021, allowed schools to use summer rules when distributing food, allowing families to pick up food at community locations. Still, one study reported that just over 60% of families who were supposed to receive free or reduced-price meals during the school year received meal assistance during school closures.
The Economic Policy Institute takes this one step further and recommends “institutions that create education policy and practice must make many changes to ensure that schools teach and reward the development of cognitive and socioemotional skills,” rather than only academic skills. Brookings Institution’s Emiliana Vegas, EdD, argues for “ teaching students transferable skills , including creativity, problem-solving, and analytical thinking.” The March 2022 federal spending bill includes $1.2 billion in grants supporting school safety and student health.
Over the past few decades, increases in educational spending have not led to improved educational outcomes, nor have they closed achievement gaps. Students, teachers, and schools face complicated dilemmas – from food insecurity to the digital divide – all of which were exacerbated by the coronavirus pandemic. Providing students, parents, and teachers with the necessary resources and flexibility is key to the U.S. education system’s ability to best prepare young people for successful careers beyond school and far into adulthood.
Measure : Find out what your state and district are doing about K-12 education.
- Do you know how your district’s public school ranks ? Are there private or vocational options?
- Are there afterschool programs to engage children, or local organizations dedicated to this?
- Do you know your school district’s budget ? How are teachers compensated while they teach and after retirement?
- Does your state offer tax credit or similar scholarships?
Identify: Who are the influencers in your state, county, or community? Learn about their priorities and consider how to contact them, including elected officials , attorneys general, law enforcement, boards of education, city councils, journalists, media outlets, community organizations, and local businesses.
- Who are the members of the school board in your community? Who is your state’s superintendent of schools ?
- Who is your school district’s superintendent, and who are the principals?
- What steps have your state’s or community’s elected or appointed officials taken in terms of education?
Reach out: You are a catalyst. Finding a common cause is a great opportunity to develop relationships with people who may be outside of your immediate network. All it takes is a small team of two or three people to set a path for real improvement.
- Find allies in your community or in nearby towns and elsewhere in the state.
- Foster collaborative relationships with community organizations, school boards, or local businesses.
Plan: Set some milestones based on your state’s legislative calendar .
- Don’t hesitate to contact The Policy Circle team, [email protected], for connections to the broader network, advice, and insights on how to build rapport with policymakers and establish yourself as a civic leader.
Execute: Give it your best shot. You can:
- Meet with a family who chooses private or charter schools as an option for educating their children, and ask their views.
- Volunteer at your child’s school to learn how the school runs and how decisions are made.
- Volunteer as a mentor or tutor for an organization or support an after-school program, maybe by sharing your own professional talents such as cooking or gardening.
- Ask to meet with a school board member, or attend school board meetings to ask questions, find out about priorities, and review annual budgets.
Working with others, you may create something great for your community. Here are some tools to learn how to contact your representatives and write an op-ed .
Thought Leaders and Organizations
- Economist Roland Fryer, founder and faculty director of the Education Innovation Laboratory at Harvard University on why he was drawn to education reform and why accidents of birth should not determine our access to a high-quality education:
- Dr. Fryer was also the lead on a research project that determined the five effective habits of charter schools.
- The Education Trust is a nonprofit organization that promotes closing opportunity gaps by expanding excellence and equity in education for students of color and those from low-income families from pre-kindergarten through college.
- Foundation for Excellence in Education focuses on personalized learning, in addition to choice and accountability.
- The American Federation for Children website compiles data on parent choice programs available across various states in an easy-to-use map format.
Suggestions for your Next Conversation
Explore the series.
This brief is part of a series of recommended conversations designed for circle's wishing to pursue a specific focus for the year. Each series recommends "5" briefs to provide a year of conversations.
The Community Series
Want to dive deeper on Education: K-12? Consider exploring the following:
Education Savings Accounts
Schools in communities, state briefs.
Want to learn more about how states are dealing with this issue? Read our state-specific briefs below:
Numbers, Facts and Trends Shaping Your World
Read our research on:
Full Topic List
Regions & Countries
- Publications
- Our Methods
- Short Reads
- Tools & Resources
Read Our Research On:
U.S. public, private and charter schools in 5 charts

While children in the United States are guaranteed a free education at their local public school through state constitutional law, many families weigh other educational options for their children. Even before the coronavirus pandemic upended families’ usual routines, 36% of parents with K-12 students say they considered multiple schools for their child in the 2018-19 school year.
Students’ school environments vary widely – sometimes even for children living in the same community – depending on whether they attend traditional public, private or charter schools.
Here are some key distinctions between these three types of schools, based on data from the National Center for Education Statistics (NCES). All figures reflect the most recent school year with data for all three types of schools.
Pew Research Center conducted this analysis to better understand how U.S. students’ school experiences might differ depending on whether they attend a traditional public school, a private school or a charter school.
Data comes from the Institute of Education Sciences’ National Center for Education Statistics . We used the most recent year in which data is available for all three school types.
Public, private and charter schools include those that teach students in kindergarten through 12th grade, unless otherwise specified. Racial categories used in this analysis include those who report being a single race and non-Hispanic. Hispanics are of any race. National School Lunch Program data for 2021-22 is not available for Alaska.
What’s the difference between public, private and charter schools?
Until a few decades ago, parents with kids in elementary, middle or high school could choose to send them to either a traditional public school or a private one. More recently, many states have added a third option: public charter schools.
- Traditional public schools are taxpayer funded, are tuition free and must adhere to standards set by a school district or state board of education. These are the most common schooling option in the U.S.
- Private schools are known for being selective, religiously affiliated or sometimes both, and charge tuition rather than receive public money. In addition to tuition dollars, private schools may be funded through a combination of donations, endowments or grants from other private sources. As a result, they have more autonomy when it comes to curriculum and other academic standards. During the 2021-22 school year, about three-quarters of private school K-12 students (77%) attended a religiously affiliated school. The largest share went to Catholic schools, which accounted for 35% of all private school enrollment. Another 23% of private school students attended secular institutions.
- Public charter schools are legally allowed to operate in nearly all states, plus the District of Columbia, as of 2024. Like traditional public schools, these are taxpayer funded and tuition free. They’re open to any student who wishes to enroll. But unlike their traditional counterparts, agreements – or charters – with the state or local government allow them flexibility when it comes to curriculum and other standards. They also may turn students away due to space constraints.

Differences exist in the size and locale of each type of school, NCES data from the 2021-22 school year shows.
Traditional public schools tend to be larger than the other types. For instance, 39% of public schools enroll 500 or more students, compared with 32% of charter schools and 8% of private schools. And while 31% of public schools have fewer than 300 students, 44% of charter schools and 82% of private schools do.
Public schools are relatively evenly distributed across urban, suburban and rural areas, while most charter and private school campuses are located in either cities or suburbs.
(Traditional public and charter school environment data includes prekindergarten students, who account for less than 1% of enrollment at these types of schools.)
Where is enrollment growing and shrinking?
During the 2021-22 school year, the vast majority of the country’s roughly 54.6 million public, private and charter school students in pre-K through 12th grade (83%) attended traditional public schools. Another 10% were enrolled in private schools, and 7% went to public charter schools.
Enrollment numbers have shifted over the last decade:

- Traditional public school enrollment has declined. In fall 2011, about 47.2 million students attended public elementary, middle and secondary schools, accounting for 87% of all school enrollment. By fall 2021, the number of public school students dropped to about 45.4 million, resulting in a small drop in public schools’ share of total enrollment.
- The popularity of charter schools has grown. Minnesota became the first state to pass legislation allowing charter schools in 1991. In the last 10 years alone, enrollment has risen from about 2.1 million students in fall 2011 to nearly 3.7 million in fall 2021, an increase from 4% to 7% of total enrollment.
- Private school enrollment has held relatively steady. Private school students have consistently made up about 10% of school enrollment, with numbers that have fluctuated from a 10-year low of fewer than 5.3 million in 2011 to a peak of almost 5.8 million in 2015.
How does enrollment look at the state level?
Nationwide, the vast majority of students in pre-K through 12th grade attend traditional public schools – but shares vary somewhat from state to state. In Wyoming, for example, nearly all students (97%) attend public school, while 45% do in D.C.
The states with the highest percentages of public school enrollment include some of those with the lowest population density . In addition to Wyoming, West Virginia (95%), Montana (93%), Kansas and Alaska (91% each) round out the top five states by share of public school enrollment.
In most states, students are more likely to attend a private school than a charter school. Charter school students make up a larger share of enrollment than private school students in just 12 states and D.C. (Data is unavailable for seven states because they did not have any charter schools or legislation allowing them in fall 2021.)
Among the places where students are the least likely to attend traditional public schools:
- D.C. has the highest share of charter school students, at 36%. Just 45% of K-12 students there attend traditional public schools. Another 19% attend private schools.
- D.C. and Hawaii have the largest percentage of students in private schools, at 19% each. In Hawaii, another 76% of students are enrolled in public school, and 6% are enrolled in charter schools.

How do student demographics vary by school type?
Charter schools had the most racial and ethnic diversity during the 2021-22 school year. Hispanic students make up the largest share of enrollment there (36%), followed by White (29%), Black (24%) and Asian American students (4%).

In contrast, 47% of traditional public school students and 65% of private school students are White. Smaller shares are Hispanic, Black or Asian.
Differences also exist by household income level. Nearly all public and charter schools are part of the National School Lunch Program , which provides free or reduced-price meals to students based on family income.
In general, charter school students are more likely than public school kids to qualify for the program. For instance, 31% of charter students and 21% of traditional public school students are enrolled at a school where more than three-quarters of their peers qualify for free or reduced-price lunch.
Because a relatively small share of private schools participate in this program, 2021-22 data is not available for them. However, research shows that private school enrollment rates are highest among upper-income families .
What does the teaching staff look like at each type of school?
More than 4.2 million full- and part-time teachers worked at public, private and charter schools during the 2020-21 school year, the most recent year with available data. That year, about 3.5 million teachers (83%) taught at traditional public schools. Another 466,000 (11%) worked in private schools, and 251,000 (6%) taught at public charters.
The teaching force in each environment varies based on race and ethnicity, age, experience, and educational attainment.

- Charter school teachers are the most racially and ethnically diverse: 69% of charter school teachers are White, compared with about eight-in-ten at both traditional public and private schools. Charters also employ the largest shares of Black and Hispanic teachers.
- Private school teachers skew slightly older, while charter school teachers are the youngest: About 17% of private school teachers are ages 60 and older, compared with 8% in public schools and 7% in charter schools. And in charter schools, 21% of teachers are under 30, compared with 14% each in public and private schools.
- Charters employ a larger share of teachers with fewer years of experience: For instance, 13% of both private and charter school teachers have fewer than three years of experience, compared with 7% of public school teachers. And 43% of charter school teachers have between three and nine years of experience, compared with 28% each in public and private schools.
- Public school teachers are the most likely to have a master’s degree: 52% of public school teachers have a master’s degree, compared with about 41% each in charter and private schools.

Katherine Schaeffer is a research analyst at Pew Research Center .
A quarter of U.S. teachers say AI tools do more harm than good in K-12 education
Most americans think u.s. k-12 stem education isn’t above average, but test results paint a mixed picture, about 1 in 4 u.s. teachers say their school went into a gun-related lockdown in the last school year, about half of americans say public k-12 education is going in the wrong direction, what public k-12 teachers want americans to know about teaching, most popular.
1615 L St. NW, Suite 800 Washington, DC 20036 USA (+1) 202-419-4300 | Main (+1) 202-857-8562 | Fax (+1) 202-419-4372 | Media Inquiries
Research Topics
- Email Newsletters
ABOUT PEW RESEARCH CENTER Pew Research Center is a nonpartisan fact tank that informs the public about the issues, attitudes and trends shaping the world. It conducts public opinion polling, demographic research, media content analysis and other empirical social science research. Pew Research Center does not take policy positions. It is a subsidiary of The Pew Charitable Trusts .
© 2024 Pew Research Center
Find the Best K-12 Schools for You
Use this directory of public and private schools across the U.S. to help you find the right school for your child.
The U.S. News & World Report K-12 directory encompasses 103,099 preschools, elementary, middle school and high schools that you can search based on the state, district or city near you. The data on student diversity, teachers, counselors, test scores and district spending can help you find the right school for your child.
View by Grade Level
Check out our directories of preschools, elementary schools and middle schools. You can also find our Best High Schools rankings, which, in addition to traditional high schools, encompass charter; magnet; and science, technology, engineering and math-focused schools.

Elementary Schools

Middle Schools

High Schools
Featured school districts.
Find your school district and explore others across the country. Districts may serve preschool, kindergarten, elementary school, middle school and high school students.
- Broward County Public Schools, FL
- Charlotte-Mecklenburg Schools, NC
- Chicago Public Schools, IL
- Clark County School District, NV
- Dallas Independent School District, TX
- Denver Public Schools, CO
- Duval County Public Schools, FL
- Fairfax County Public Schools, VA
- Hawaii Department of Education, HI
- Hillsborough County Public Schools, FL
- Houston Independent School District, TX
- Los Angeles Unified School District, CA
- Memphis-Shelby County Schools, TN
- Miami-Dade County Public Schools, FL
- Montgomery County Public Schools, MD
- New York City Public Schools, NY
- Orange County Public Schools, FL
- Philadelphia City School District, PA
- Prince George's County Public Schools, MD
- The School District of Palm Beach County, FL
- Wake County Schools, NC
U.S. News High School Rankings
The Best High Schools rankings include data on nearly 25,000 public high schools in 50 states and the District of Columbia. Discover how your school stacks up against others in the same state, district and metro area.

National Rankings
The 2023-2024 Best High Schools ranks 17,655 public high schools.

Best Charter Schools
Charter schools are public schools that operate under charters, tend to have limited enrollment and usually accept students through an application process.

Best Magnet Schools
Magnet schools may attract the most talented students in a region via an application process, often involving test scores and grade-point averages.

Best STEM Schools
U.S. News looked at the top 2,000 public high schools to identify the top 500 best in science, technology, engineering and math education.
Search K-8 Schools By State
Search by state for institutions that teach kindergarten, elementary or middle school students. School pages have data like enrollment by grade, student-teacher ratio and percentage of full-time teachers who are certified.
- Connecticut
- District of Columbia
- Massachusetts
- Mississippi
- New Hampshire
- North Carolina
- North Dakota
- Pennsylvania
- Rhode Island
- South Carolina
- South Dakota
- West Virginia
Search Best High Schools By State
Institutions in all 50 states and the District of Columbia are included in the rankings, which use metrics like standardized test scores to assess math and reading proficiency. See how your school compares with others around the state.
K-12 Advice

What Is a Montessori School?

Choosing a High School: What to Consider

Metro Areas With Top-Ranked High Schools

States With Highest Test Scores

Map: Top 100 Public High Schools

U.S. News Releases High School Rankings
- Newsletters
IE 11 Not Supported
Nyc schools test remote learning system after snow day failure, almost four months after their online learning system was overwhelmed by too many log-ins at once on a snow day, new york city public schools asked students to participate in a simulated test thursday..

Explore how Microsoft's partnership with Khan Academy is enhancing the future of education with AI innovation and tools for teachers >
- Higher education
- Published Oct 26, 2023
Enhancing school security and decreasing costs with Microsoft 365 Education A5
- Content Type
- Cybersecurity
- Device management
- Education decision makers
- IT professionals
- Microsoft 365
With the rapid transition to digital learning and the increased need for device management in education institutions, we understand the importance of providing secure digital environments for all staff and students. Microsoft 365 Education A5 includes a comprehensive set of management, security, privacy, and compliance solutions to help schools meet this need and more, including features like Learning Accelerators , Education Insights , and Unified Communications that enhance teaching, learning, and working. Paid users, such as faculty and staff, benefit from all of these features, and the student use benefit makes a subset of the features available to students at no cost.
In 2023, Microsoft commissioned Forrester Consulting to conduct two Total Economic Impact™ (TEI) studies that examine the potential security-related return on investment (ROI) that K-12 school systems and higher education institutions may realize by deploying Microsoft 365 Education A5. Prior to upgrading to A5, many of these institutions noted that limitations with their prior systems led to costly security-related events in terms of ransomware payments, recovery efforts, brand damage, and disruption to educational continuity.
Upgrading to A5 resulted in decreased complexity and difficulty in responding to security threats and compliance requirements, the ability to meet cyber insurance requirements, and increased cost savings over time.
The impact of Microsoft 365 Education A5 on K-12 schools
For the purposes of the K-12 TEI study , Forrester aggregated the experiences of the respondents and combined the results into a single composite organization that is a K-12 (primary and secondary education) school system with 60,000 students and 10,000 employees.
We were able to cut our security license costs 25% by moving to A5. More important than saving money is that we now have better security and user experiences. Chief Information Officer in a K-12 public school district
Within the composite K-12 organization, the study notes the following benefits of Microsoft 365 Education A5.
- Improved security and compliance posture: The annual number of significant breaches that cross multiple systems and large portions of users is reduced by 15% for the composite organization, and the cost to remediate the remaining breaches is reduced by 29%. These savings include the actual remediation costs as well as fines and additive audit and compliance costs. Over three years, this is worth about $972,800 to the composite organization.
- Security solution vendor consolidation reduces license costs by 30%: Consolidating from multiple vendors to Microsoft also reduces the total license/subscription and maintenance spend. The three-year value to the composite organization is $1.1 million.
- Efficiencies in detection, remediation, and efficiency reduces future IT security team staff growth: Consolidating to Microsoft 365 Education A5 makes it possible to provide the composite organization with necessary improved protection and response to threats without growing the IT security team by the 50% it would need with the prior solutions. In doing so, the composite organization realizes about $545,700 in added labor savings over three years. This is an especially important benefit because of the difficulty the composite organization’s school system has with hiring, training, and/or retaining IT security professionals.
- Improved security and using security features save employees fifteen minutes per week: After very conservatively reducing this benefit by 75% because not all time saved translates into additional work getting done, the three-year value to the composite organization is $1.7 million.
The overall financial analysis, which is based on the interviews and survey, found that a composite K-12 organization experiences benefits of $4.22 million over three years versus costs of $1.94 million, adding up to a net present value (NPV) of $2.28 million and an ROI of 118% .

Executive summary data of the K-12 Forrester study “The Total Economic Impact™ Of Microsoft 365 Education A5 Security For K-12 Schools.”
The impact of Microsoft 365 Education A5 on higher education institutions
For the purposes of the higher education TEI study , Forrester aggregated the experiences of the respondents and combined the results into a single composite organization that is a higher ed organization with a teaching hospital, 50,000 students, and 15,000 employees.
A big benefit is improved availability. A cloud-first approach means employees are not down as much because of technical or security issues. A Vice President of technology and Chief Information Officer at a four-year university
Within the composite higher education organization, the study notes the following benefits of Microsoft 365 Education A5.
- Improved security and compliance posture: The annual number of significant breaches that cross multiple systems and large portions of users is reduced by 15% for the composite organization, and the cost to remediate the remaining breaches is reduced by 29%. These savings include the actual remediation costs as well as fines and additive audit and compliance costs. Over three years, this is worth $1.2 million to the composite organization.
- Security solution vendor consolidation reduces license costs by 30%: Consolidating from multiple vendors to Microsoft also reduces the total license/subscription and maintenance spend. The three-year value to the composite organization is $1.7 million.
- Efficiencies in detection, remediation, and efficiency reduces future IT security team staff growth: Consolidating to Microsoft 365 Education A5 makes it possible to provide the composite organization with necessary improved protection and response to threats without growing the IT security team by the 40% it would need with the prior solutions. In doing so, the composite organization realizes about $1.1 million in added labor savings over three years. This is an especially important benefit because of the difficulty the higher education composite organization has with hiring, training, and/or retaining IT security professionals.
- Improved security and using security features save employees fifteen minutes per week: After very conservatively reducing this benefit by 75% (because not all time saved translates into additional work getting done), the three-year value to the composite organization is $3.3 million.
The financial analysis, which is based on the interviews and survey, found that a composite higher education organization experiences benefits of $7.28 million over three years versus costs of $3.19 million, adding up to a net present value (NPV) of $4.09 million and an ROI of 128% .
Executive summary data of the Higher Education Forrester study “The Total Economic Impact™ Of Microsoft 365 Education A5 Security For Higher Education.”
Both studies recognize the unquantifiable benefits of Microsoft 365 Education A5 as well. A5 provides additional features, like Microsoft Teams Phone and Power BI, that support communication efforts and provide expanded data analytics. A5 also helps schools put in place insurance-mandated solutions faster and at less cost than many other alternatives, and it can help slow down the increases in policy premiums. Moreover, with the prevention of unexpected security issues, education institutions with Microsoft 365 Education A5 can focus on improving learning outcomes with a comprehensive learning environment that is safe, secure, and compliant for online and remote learning and digital collaboration.
Learn more about how Microsoft 365 Education A5 can enhance privacy and security for your K-12 school system or higher education institution to accelerate teaching, learning, and working for students and staff.
Related Posts

Inspiring students during Women’s History Month 2024

- Customer stories
Streamline messaging with Dynamics 365 Customer Insights

- Professional development
Comprehensive quick start guides for Microsoft Education tools
Ai in education brings opportunity to life.
Watch Reimagine Education
Connect with us on social

Subscribe to our newsletter
Stay up to date with monthly newsletters from Microsoft Education.
School stories
Get inspired by stories from Microsoft Education customers.
Microsoft Learn Educator Center
Expand possibilities with educator training and professional development resources.
Contact sales
Connect with a Microsoft Education sales specialist to explore solutions for your school.
Discover a collection of resources to support a variety of educational topics.
IMAGES
VIDEO
COMMENTS
Graduation ceremony in Oregon's Tigard High School, 2017. K-12 education in the United States includes primary education starting in kindergarten, and secondary education ending in grade 12. Government-funded free schools are generally provided for these grades, but private schools and homeschooling are also possible. Most children begin elementary education with kindergarten (usually five to ...
The expression "K-12" is a shortening of kindergarten (K) for 5-6 year olds through twelfth grade (12) for 17-18 year-olds, as the first and last grades, respectively, of free education [5] in these countries. The related term " P-12 " is also occasionally used in Australia and the United States to refer to the sum of K-12 plus ...
1 June 2017. The K-12 system stands for 'from kindergarten to 12th grade'. This equates roughly to a school starting age of around five through to Grade 12 at around the age of 18. The system is broken down into three stages: elementary school (Grades K-5), middle school (Grades 6-8) and high school (Grades 9-12). Year in England.
Typically, children enter the K-12 system at five to six years of age and progress through three stages of study: elementary school (grades K-5), middle school (grades 6-8), and high school ...
In the United States, education is provided in public and private schools and by individuals through homeschooling. State governments set overall educational standards, often mandate standardized tests for K-12 public school systems and supervise, usually through a board of regents, state colleges, and universities.
Education in the USA. In the United States, the law requires all children to go to school. Elementary, middle, and high school are all free if your child attends public school. The ages of the students for each grade can vary from state to state. U.S. education levels . In the USA, there are 12 grade levels after the first year of kindergarten.
K-12, a term used in education and educational technology in the United States, Canada, and possibly other countries, is a short form for the publicly-supported school grades prior to college. These grades are kindergarten (K) and the 1st through the 12th grade (1-12). (If the term were used, "13th grade" would be the first year of college.)
Find statistics and data trends about the American education system: public and private programs from preschools to colleges and universities that serve millions of students in urban and rural settings. ... During the 2019-2020 school year, there was $15,810 spent on K-12 public education for every student in the US. Education spending per K-12 ...
Editor's Note: This report is an excerpt, with minor edits, from Addressing Inequities in the US K-12 Education System, which first appeared in Rebuilding the Pandemic Economy, published by the ...
School Pulse Panel Dashboard Monthly data on the impact of the COVID-19 pandemic on K-12 education are now available. ... The Condition of Education is an annual report to Congress summarizing important developments and trends in the U.S. education system. The report presents 50 indicators on topics ranging from prekindergarten through ...
K-12 US Education System Aliza Fones, Language, Literacy and Culture Lorena Guillen, Teacher Education Anthony Longoria, Multicultural Education ... K-12 Average Class Size public school ratio: 16/1 private school ratio: 12/1 24.8 White 7.7 Black 2.6 API
US News ranks states on education, including pre-K-12 and college, based on graduation rates, test scores and more. ... testing requirement but rolled back the federal government's involvement ...
State Grades on K-12 Achievement: 2021 Map and Rankings. By EdWeek Research Center — September 01, 2021 1 min read. Examine the grades and scores that states and the nation earned on the K-12 ...
The status quo is not working. Whether by international comparisons, state and national proficiency measures, civic literacy rates, or career preparedness, American students are falling behind. The 22nd edition of the Report Card on American Education ranks states on their K-12 education and policy performance. Learn More
United States Education Dashboard shows what the U.S. Department of Education considers to be important indicators of how the nation, and each state, is progressing on the outcomes necessary to achieve the national goal of once again having the highest proportion of college graduates in the world. The Dashboard is meant to spur and inform conversations about how to improve educational results ...
Similar shares of K-12 parents and adults who don't have a child in K-12 schools say the system is going in the wrong direction. A separate Center survey of public K-12 teachers found that 82% think the overall state of public K-12 education has gotten worse in the past five years. And many teachers are pessimistic about the future.
The U.S. K-12 education system must change from adult-focused to student-focused, input-focused to output-focused, teaching-focused to learning-focused, group-focused to individual-focused, and time-focused to competency-focused. Keri D. Ingraham. Goldhaber, Kane, and McEachin provide additional insights regarding how long it will take for ...
We convened education advocates and practitioners, from both K-12 and higher education, to explain how the disruption of the pandemic is pushing forward long-overdue pedagogical reform. And we ...
Issue Summary. The U.S. Department of Education and other federal agencies work to ensure that 50 million students in K-12 public schools have access to a safe, quality education. However, a history of discriminatory practices has contributed to inequities in education, which are intertwined with disparities in wealth, income, and housing.
The answer to solving the American education crisis is simple. We need to put education back in the hands of the teachers. The politicians and the government needs to step back and let the people ...
The United States spent $34,036 per postsecondary student in 2018, the second-highest amount after Luxembourg and nearly double the OECD average ($17,065). Also, U.S. spending on postsecondary education as a percentage of GDP (2.5 percent) was substantially higher than the OECD average (1.4 percent). These total expenditures include amounts ...
A public school teacher's total earned income in 2018 was $62,200, while a private school teacher's salary started at $50,340. Salary estimates for the 2020-2021 school year put public school teachers at $65,090. Teacher pay fluctuates between states and even between neighboring school districts.
NCES's 'Condition of Education' Sheds Light on Enrollment Trends, From Early Childhood to K-12 and Postsecondary Education. May 30, 2024. Enhanced report provides data on trends in enrollment, graduation rates, career and technical education, teacher turnover, education finance, and more
More than 4.2 million full- and part-time teachers worked at public, private and charter schools during the 2020-21 school year, the most recent year with available data. That year, about 3.5 million teachers (83%) taught at traditional public schools. Another 466,000 (11%) worked in private schools, and 251,000 (6%) taught at public charters.
The U.S. News & World Report K-12 directory encompasses 103,099 preschools, elementary, middle school and high schools that you can search based on the state, district or city near you. The data ...
Legislation, regulations, guidance, and other policy documents can be found here for the Every Student Succeeds Act (ESSA), and other topics. Please note that in the U.S., the federal role in education is limited. Because of the Tenth Amendment, most education policy is decided at the state and local levels. So, if you have a question about a ...
Almost four months after their online learning system was overwhelmed by too many log-ins at once on a snow day, ... K-12 Education. FCC Approves $200M Pilot Program for K-12 Cybersecurity. June ...
Jun 6, 2024. The State Board of Education approved 11 grant proposals for 10 public school units today that will fund effective digital learning practices in North Carolina's K-12 public schools. The state-funded competitive grant program under the state's Digital Learning Initiative supports the development and dissemination of local ...
Fargo Public Schools has had a Board of Education (its formal name) since the founding of its first public school in 1874. (It became a nine member board in 1885.) Since the beginning, its top priority has been student achievement. The Board has only one employee that it supervises - the superintendent of schools, effectively the CEO of the ...
The impact of Microsoft 365 Education A5 on K-12 schools . For the purposes of the K-12 TEI study, Forrester aggregated the experiences of the respondents and combined the results into a single composite organization that is a K-12 (primary and secondary education) school system with 60,000 students and 10,000 employees.