- Skip to main content
- Skip to FDA Search
- Skip to in this section menu
- Skip to footer links

The .gov means it’s official. Federal government websites often end in .gov or .mil. Before sharing sensitive information, make sure you're on a federal government site.
The site is secure. The https:// ensures that you are connecting to the official website and that any information you provide is encrypted and transmitted securely.

U.S. Food and Drug Administration
- Search
- Menu
- For Industry
- FDA Data Standards Advisory Board
- Structured Product Labeling Resources
Units of Presentation
NCI Thesaurus OID: 2.16.840.1.113883.3.26.1.1
NCI concept code for potency units: C48470
| AMPULE | C48473 | 1 |
| APPLICATOR | C62412 | 1 |
| BAG | C48474 | 1 |
| BAR | C48475 | 1 |
| BEAD | C53495 | 1 |
| BLISTER | C54564 | 1 |
| BLISTER PACK | C61569 | 1 |
| BLOCK | C53498 | 1 |
| BOLUS | C48476 | 1 |
| BOTTLE | C48477 | 1 |
| BOX | C48478 | 1 |
| CAN | C48479 | 1 |
| CANISTER | C62413 | 1 |
| CAPSULE | C48480 | 1 |
| CARTON | C54702 | 1 |
| CARTRIDGE | C48481 | 1 |
| CASE | C62414 | 1 |
| CELLO PACK | C62274 | 1 |
| CLINICAL UNITS | C48482 | 1 |
| COAT | C48483 | 1 |
| CONTAINER | C48484 | 1 |
| COUNT | C48485 | 1 |
| CUP | C54703 | 1 |
| CYLINDER | C48489 | 1 |
| DEWAR | C62415 | 1 |
| DIALPACK | C62416 | 1 |
| DISK | C48490 | 1 |
| DOSE PACK | C62417 | 1 |
| DROPS | C48491 | 1 |
| DRUM | C48492 | 1 |
| FILM | C53499 | 1 |
| GENERATOR | C48496 | 1 |
| GLOBULE | C91803 | 1 |
| HOMEOPATHIC DILUTION | C48498 | 1 |
| IMPLANT | C48499 | 1 |
| INHALATION | C48501 | 1 |
| INHALER | C62275 | 1 |
| INHALER, REFILL | C62418 | 1 |
| INSERT | C62276 | 1 |
| JAR | C48502 | 1 |
| JUG | C62419 | 1 |
| KALLIKREIN INHIBITOR UNIT | C48503 | 1 |
| KIT | C48504 | 1 |
| LOZENGE | C48506 | 1 |
| PACKAGE | C48520 | 1 |
| PACKET | C48521 | 1 |
| PAIL | C80697 | 1 |
| PARTS | C48522 | 1 |
| PATCH | C48524 | 1 |
| PELLET | C48525 | 1 |
| PIECE | C89446 | 1 |
| POUCH | C48530 | 1 |
| PRESSOR UNITS | C48532 | 1 |
| RING | C62609 | 1 |
| SATURATED | C48535 | 1 |
| SCOOPFUL | C48536 | 1 |
| SPONGE | C53502 | 1 |
| SPRAY | C48537 | 1 |
| SQUARE CENTIMETER | C48460 | 1 |
| STICK | C53503 | 1 |
| STRIP | C48538 | 1 |
| SUPERSACK | C62420 | 1 |
| SUPPOSITORY | C48539 | 1 |
| SWAB | C53504 | 1 |
| SYRINGE | C48540 | 1 |
| TABLET | C48542 | 1 |
| TABMINDER | C62421 | 1 |
| TAMPON | C48543 | 1 |
| TANK | C62422 | 1 |
| TEST | C48545 | 1 |
| TRAY | C54704 | 1 |
| TROCHE | C48548 | 1 |
| TUBE | C48549 | 1 |
| UNITS | C44278 | 1 |
| VIAL | C48551 | 1 |
| WAFER | C48552 | 1 |
- Skip to main content
- assistive.skiplink.to.breadcrumbs
- assistive.skiplink.to.header.menu
- assistive.skiplink.to.action.menu
- assistive.skiplink.to.quick.search
SNOMED CT Document Library
- Remove Read Confirmation
- A t tachments (8)
- Scaffolding History
- Page History
- Resolved comments
- Page Information
- View in Hierarchy
- View Source
- View Scaffolding XML
- Export to PDF
- Export to Word
- Hide Inline Comments
- Copy with Scaffolding XML
- Viewtracker
- Read Confirmation
Unit of Presentation Attributes
- Created by Linda Bird on 2021-Jun-04
The following sections discuss the attribute concepts that are used to represent the unit of presentation of concepts in the medicinal product hierarchy.
Unit of Presentation
A unit of presentation is a qualitative concept that describes a countable entity in which the clinical drug is presented, or by which it is bounded. It is used to support expression of presentation strength, where it provides the denominator for the strength ratio, and to differentiate different clinical drug products when the "intimate container" (see below) is clinically important (e.g. differentiating pre-filled syringes from ampoules for a solution for injection product). As described in the Strength section above and detailed further in Appendix A, there are various patterns for describing how unit of presentation and expression of strength relate together, based on whether the unit of presentation relates to the basic dose form or the intimate container (which is therefore the countable unit) of the medicinal product. As the countable entity for a medicinal product, unit of presentation is also important in describing packages, which although out of scope of the international edition, may be of major importance for national extensions describing medicinal products. There are three types of unit of presentation:
- in this type, the solid dosage form, because of its discrete nature, is the countable unit; it provides the physical boundary in which the active ingredient substance(s) of the medicinal product are presented
- in this type, the countable unit is the "actuation" provided by the metering valve; it is the valve that determines (bounds) the physical amount of the active ingredient substance(s) of the medicinal product are presented
- see below for detail
Intimate container
The "intimate container" of a medicinal product is the receptacle or vessel used to contain (or bound) liquid and some solid or semi-solid medicinal products into countable entities. A medicinal product presented in an intimate container will almost always have at least one layer of additional packaging added to it in order to make it into a packaged medicinal product; this external packaging is not described in the international edition. For example: an ampoule is an intimate container to present a solution for injection dosage form; the ampoule will always be supplied in a box or a moulded carton, possibly additionally with a blister strip as intermediate packaging. Particularly for liquid parenteral products for nebuliser liquids, and for some semi-solid presentations, the intimate container/unit of presentation may have clinical significance: providing a patient heparin in a pre-filled syringe is different from supplying that same concentration of heparin in a (multi-dose) vial. Similarly, hormone replacement gels may be supplied in single dose sachets to provide the correct administration amount.
IDMP Compatibility
In IDMP, the " one countable instance of a whole of medicinal product " is managed through the information model: it is (generally) one instance of the Manufactured Item, with its manufactured dose form and unit of presentation or one instance of the Pharmaceutical Product (with its administrable dose form and unit of presentation). The Manufactured Item is therefore the concept/class that most closely resembles the SNOMED CT Clinical Drug, but both Manufactured Item and Pharmaceutical Product contain the key "unit of presentation" attribute. However, the Manufactured Item is a representation of something that is real, with (at least in theory) all its excipient substances described and therefore is not directly compatible to the Clinical Drug - indeed the Clinical Drug could be seen as a grouper concept for similar Manufactured Items, if excipient substances etc. and packaging are disregarded. The unit of presentation in IDMP is what specifies the "real world" units in which the quantity of the manufactured item is described. The unit of presentation can be specified in accordance with ISO 11239 and ISO/TS 20440 and its resulting terminology [implemented through EDQM. IDMP goes on to state: "For items where their quantity is a measured quantity of weight or volume, the "unit of presentation" shall not be given since it is the same as the units of that quantity (that is ml, mg or %). For solid dose forms and other items that are measured by counting integer quantities, the unit for quantity shall be "unit" and the "unit of presentation" shall be the item that is counted." In EDQM, unit of presentation is defined as the "Qualitative term describing the discrete countable entity in which a pharmaceutical product or manufactured item is presented, in cases where strength or quantity is expressed referring to one instance of this countable entity."
EXAMPLE 1: To describe strength: "Contains 100 mg per tablet" ('tablet' is the unit of presentation). EXAMPLE 2: To describe quantity: "Contains 100 mL per bottle" ('bottle' is the unit of presentation).
Unit of Presentation is therefore sometimes known as "the countable unit".
Powered by a free Atlassian Confluence Community License granted to SNOMED International. Evaluate Confluence today .
- Powered by Atlassian Confluence 7.19.21
- Printed by Atlassian Confluence 7.19.21
- Report a bug
- Atlassian News
- Architecture and Design
- Asian and Pacific Studies
- Business and Economics
- Classical and Ancient Near Eastern Studies
- Computer Sciences
- Cultural Studies
- Engineering
- General Interest
- Geosciences
- Industrial Chemistry
- Islamic and Middle Eastern Studies
- Jewish Studies
- Library and Information Science, Book Studies
- Life Sciences
- Linguistics and Semiotics
- Literary Studies
- Materials Sciences
- Mathematics
- Social Sciences
- Sports and Recreation
- Theology and Religion
- Publish your article
- The role of authors
- Promoting your article
- Abstracting & indexing
- Publishing Ethics
- Why publish with De Gruyter
- How to publish with De Gruyter
- Our book series
- Our subject areas
- Your digital product at De Gruyter
- Contribute to our reference works
- Product information
- Tools & resources
- Product Information
- Promotional Materials
- Orders and Inquiries
- FAQ for Library Suppliers and Book Sellers
- Repository Policy
- Free access policy
- Open Access agreements
- Database portals
- For Authors
- Customer service
- People + Culture
- Journal Management
- How to join us
- Working at De Gruyter
- Mission & Vision
- De Gruyter Foundation
- De Gruyter Ebound
- Our Responsibility
- Partner publishers
Your purchase has been completed. Your documents are now available to view.
The Units ppm, ppb, and ppt
Dimensionless quantities, which are also sometimes called quantities of dimension one, are generally defined as the ratio of two quantities of the same kind. Examples are refractive index n (defined as the ratio of the speed of light in vacuum to the speed in a medium, n = c 0 /c ); and mole fraction x i – more properly called amount of substance fraction (defined as the ratio of the amount of a particular substance i in a mixture to the total amount of substance x i = n i / Σ j n j ). Thus the value of a dimensionless quantity is simply a number, and it would seem that no unit is required. The International System of units, the SI, includes no units for dimensionless quantities as it is at present defined.
However important situations arise where the value of a dimensionless quantity is a number, which is very small compared to one, small by many powers of ten, or sometimes very large compared to one. For example the mole fraction of a minor constituent in a mixture may be of the order 10 −6 or 10 −9 or even smaller. When there is a unit in the value of a quantity it is customary and convenient to make use of the SI prefixes, so that instead of writing a small mass as, for example, 2.6×10 −6 g or 2.6×10 −9 g, we would write 2.6 µg or 2.6 ng, using the SI prefixes micro- or nano- for 10 −6 or 10 −9 . The convenience of the SI prefixes avoids the need to use powers of ten with large negative (or positive) exponents, which are clumsy to say and to type. However they are not available for dimensionless quantities, because there is no unit to which they may be prefixed.
The symbols ppm, ppb, and ppt are used to escape this problem. They are best thought of as non-SI units for dimensionless quantities with the meanings 10 −6 , 10 −9 , and 10 −12 respectively. They are abbreviations for the words parts-per-million, parts-per-billion, and parts-per-trillion. These symbols have become commonplace in everyday use, in the media for example, as well as in scientific and technical contexts. If we regard them as units it is important to note that they are not part of the SI. SI units have an unambiguous definition provided by the BIPM, which is accepted for use worldwide. It follows that if we accept the use of symbols like ppm then we have to ensure that they are unambiguously defined. Advice on the use of these symbols is provided by the SI Brochure, 1 the ISO 80000 series of standards, 2 the IUPAC Green book, 3 and the NIST Special Publication 330, 4 in addition to a number of other similar sources. There is also useful advice in a paper by Cvitas. 5
It is sometimes argued that the use of non-SI units should always be deprecated. However there is little point in deprecating their use if almost everyone continues to use them, which is the situation at present regarding ppm, ppb, and ppt. Because there is no official authority for defining their meaning, users of these units must consider these problems for themselves, and if necessary add extra words to ensure that their meaning is unambiguous. A particular problem arises in the meaning of a billion and a trillion: the usual meaning of these words today is 10 9 and 10 12 respectively, but there are still a few countries (notably Scandinavia) where a billion and a trillion are taken to mean 10 12 and 10 18 respectively, with corresponding changes to the meaning of ppb and ppt. For this reason ISO and the SI Brochure recommend that the symbols ppb and ppt should never be used at all, but nonetheless they are still in common use.
Table 1. Some commonly used symbols for dimensionless numbers, with their commonly accepted meanings and examples of their use. The last three entries in this table are rarely seen, and are best not used. See also comments in the text concerning the meaning of billion and trillion.
| Symbol | Value | Examples of use | Possible replacement | |
| Percent, or part percent, or parts per hundred | % or pph | 10 | The degree of dissociation was 1.5 % | Use % rather than pph |
| part per million | ppm | 10 | The mole fraction of CO in the atmosphere is about (CO ) = 300 ppm | µmol/mol |
| part per billion | ppb | 10 | The air quality standard for ozone is a volume fraction of = 120 ppb | nmol/mol for mole fraction, or nL/L for volume fraction |
| part per trillion | ppt | 10 | The volume fraction of NO in air is = 140 ppt | pmol/mol or pL/L |
| part per quadrillion | ppq | 10 | rarely used | |
| part per thousand, or permille | ppt, or ‰ | 10 | The mole fraction of CO in the atmosphere is 0.3 ‰, or 0.3 ppt | Use percent or ppm with a power of ten. Avoid using ppt which is clearly ambiguous. |
| part per hundred million | pphm | 10 | The mass fraction of impurity in the metal was less than 5 pphm | rarely used |
Table 1 gives a number of examples of symbols for dimensionless units of the kind discussed here which are to be found in published literature. There are also a few other rules to note. The SI Brochure advises that none of these non-SI symbols should ever be combined with SI units. It is also a general rule that in specifying the value of a quantity, the definition of the quantity should always be specified—if possible by giving the recommended symbol in addition to the name. Never assume that the unit alone provides sufficient information to specify the quantity involved. The quantity should be clearly distinguished from the definition of the unit, which should preferably not be decorated with information on the quantity involved. Thus symbols such as ppm-V (intended to imply that the quantity is a volume fraction) should not be used; instead specify the quantity involved explicitly (see the examples in the table).
Some of the views expressed in this note are my personal views, with which others may not always agree. Different authors have different levels of tolerance towards the use of non-SI units, and it is a characteristic of the units discussed here that there is not really any general authority to advise on these units.
Ian Mills < [email protected] > is an emeritus professor of chemistry at the University of Reading, UK, and is the former president of CCU (CCU is the Consultative Committee on Units of the International Committee for Weights and Measures (CIPM) of the Bureau International des Poids et Mesures (BIPM)).
1. The International System of Units (the SI Brochure), published by the BIPM, www.bipm.org ; see particularly Chapter 4 on units outside the SI. Search in Google Scholar
2. The International Organisation for Standardisation; see particularly ISO TC12 and ISO TC25, www.iso.org. Search in Google Scholar
3. Quantities, Units and Symbols in Physical Chemistry (the IUPAC Green Book), 3rd edition, the Royal Society of Chemistry, 2007. Search in Google Scholar
4. The International System of Units, NIST Special publication 330, 2008 edition. Search in Google Scholar
5. T. Cvitaš, Quantities describing the compositions of mixtures, Metrologia , 33, 35-39 (1996). Search in Google Scholar
©2014 by Walter de Gruyter GmbH & Co.
- X / Twitter
Supplementary Materials
Please login or register with De Gruyter to order this product.
Journal and Issue
Articles in the same issue.
Improve your practice.
Enhance your soft skills with a range of award-winning courses.
How to Structure your Presentation, with Examples
August 3, 2018 - Dom Barnard
For many people the thought of delivering a presentation is a daunting task and brings about a great deal of nerves . However, if you take some time to understand how effective presentations are structured and then apply this structure to your own presentation, you’ll appear much more confident and relaxed.
Here is our complete guide for structuring your presentation, with examples at the end of the article to demonstrate these points.
Why is structuring a presentation so important?
If you’ve ever sat through a great presentation, you’ll have left feeling either inspired or informed on a given topic. This isn’t because the speaker was the most knowledgeable or motivating person in the world. Instead, it’s because they know how to structure presentations – they have crafted their message in a logical and simple way that has allowed the audience can keep up with them and take away key messages.
Research has supported this, with studies showing that audiences retain structured information 40% more accurately than unstructured information.
In fact, not only is structuring a presentation important for the benefit of the audience’s understanding, it’s also important for you as the speaker. A good structure helps you remain calm, stay on topic, and avoid any awkward silences.
What will affect your presentation structure?
Generally speaking, there is a natural flow that any decent presentation will follow which we will go into shortly. However, you should be aware that all presentation structures will be different in their own unique way and this will be due to a number of factors, including:
- Whether you need to deliver any demonstrations
- How knowledgeable the audience already is on the given subject
- How much interaction you want from the audience
- Any time constraints there are for your talk
- What setting you are in
- Your ability to use any kinds of visual assistance
Before choosing the presentation’s structure answer these questions first:
- What is your presentation’s aim?
- Who are the audience?
- What are the main points your audience should remember afterwards?
When reading the points below, think critically about what things may cause your presentation structure to be slightly different. You can add in certain elements and add more focus to certain moments if that works better for your speech.

What is the typical presentation structure?
This is the usual flow of a presentation, which covers all the vital sections and is a good starting point for yours. It allows your audience to easily follow along and sets out a solid structure you can add your content to.
1. Greet the audience and introduce yourself
Before you start delivering your talk, introduce yourself to the audience and clarify who you are and your relevant expertise. This does not need to be long or incredibly detailed, but will help build an immediate relationship between you and the audience. It gives you the chance to briefly clarify your expertise and why you are worth listening to. This will help establish your ethos so the audience will trust you more and think you’re credible.
Read our tips on How to Start a Presentation Effectively
2. Introduction
In the introduction you need to explain the subject and purpose of your presentation whilst gaining the audience’s interest and confidence. It’s sometimes helpful to think of your introduction as funnel-shaped to help filter down your topic:
- Introduce your general topic
- Explain your topic area
- State the issues/challenges in this area you will be exploring
- State your presentation’s purpose – this is the basis of your presentation so ensure that you provide a statement explaining how the topic will be treated, for example, “I will argue that…” or maybe you will “compare”, “analyse”, “evaluate”, “describe” etc.
- Provide a statement of what you’re hoping the outcome of the presentation will be, for example, “I’m hoping this will be provide you with…”
- Show a preview of the organisation of your presentation
In this section also explain:
- The length of the talk.
- Signal whether you want audience interaction – some presenters prefer the audience to ask questions throughout whereas others allocate a specific section for this.
- If it applies, inform the audience whether to take notes or whether you will be providing handouts.
The way you structure your introduction can depend on the amount of time you have been given to present: a sales pitch may consist of a quick presentation so you may begin with your conclusion and then provide the evidence. Conversely, a speaker presenting their idea for change in the world would be better suited to start with the evidence and then conclude what this means for the audience.
Keep in mind that the main aim of the introduction is to grab the audience’s attention and connect with them.
3. The main body of your talk
The main body of your talk needs to meet the promises you made in the introduction. Depending on the nature of your presentation, clearly segment the different topics you will be discussing, and then work your way through them one at a time – it’s important for everything to be organised logically for the audience to fully understand. There are many different ways to organise your main points, such as, by priority, theme, chronologically etc.
- Main points should be addressed one by one with supporting evidence and examples.
- Before moving on to the next point you should provide a mini-summary.
- Links should be clearly stated between ideas and you must make it clear when you’re moving onto the next point.
- Allow time for people to take relevant notes and stick to the topics you have prepared beforehand rather than straying too far off topic.
When planning your presentation write a list of main points you want to make and ask yourself “What I am telling the audience? What should they understand from this?” refining your answers this way will help you produce clear messages.
4. Conclusion
In presentations the conclusion is frequently underdeveloped and lacks purpose which is a shame as it’s the best place to reinforce your messages. Typically, your presentation has a specific goal – that could be to convert a number of the audience members into customers, lead to a certain number of enquiries to make people knowledgeable on specific key points, or to motivate them towards a shared goal.
Regardless of what that goal is, be sure to summarise your main points and their implications. This clarifies the overall purpose of your talk and reinforces your reason for being there.
Follow these steps:
- Signal that it’s nearly the end of your presentation, for example, “As we wrap up/as we wind down the talk…”
- Restate the topic and purpose of your presentation – “In this speech I wanted to compare…”
- Summarise the main points, including their implications and conclusions
- Indicate what is next/a call to action/a thought-provoking takeaway
- Move on to the last section
5. Thank the audience and invite questions
Conclude your talk by thanking the audience for their time and invite them to ask any questions they may have. As mentioned earlier, personal circumstances will affect the structure of your presentation.
Many presenters prefer to make the Q&A session the key part of their talk and try to speed through the main body of the presentation. This is totally fine, but it is still best to focus on delivering some sort of initial presentation to set the tone and topics for discussion in the Q&A.

Other common presentation structures
The above was a description of a basic presentation, here are some more specific presentation layouts:
Demonstration
Use the demonstration structure when you have something useful to show. This is usually used when you want to show how a product works. Steve Jobs frequently used this technique in his presentations.
- Explain why the product is valuable.
- Describe why the product is necessary.
- Explain what problems it can solve for the audience.
- Demonstrate the product to support what you’ve been saying.
- Make suggestions of other things it can do to make the audience curious.
Problem-solution
This structure is particularly useful in persuading the audience.
- Briefly frame the issue.
- Go into the issue in detail showing why it ‘s such a problem. Use logos and pathos for this – the logical and emotional appeals.
- Provide the solution and explain why this would also help the audience.
- Call to action – something you want the audience to do which is straightforward and pertinent to the solution.
Storytelling
As well as incorporating stories in your presentation , you can organise your whole presentation as a story. There are lots of different type of story structures you can use – a popular choice is the monomyth – the hero’s journey. In a monomyth, a hero goes on a difficult journey or takes on a challenge – they move from the familiar into the unknown. After facing obstacles and ultimately succeeding the hero returns home, transformed and with newfound wisdom.
Storytelling for Business Success webinar , where well-know storyteller Javier Bernad shares strategies for crafting compelling narratives.
Another popular choice for using a story to structure your presentation is in media ras (in the middle of thing). In this type of story you launch right into the action by providing a snippet/teaser of what’s happening and then you start explaining the events that led to that event. This is engaging because you’re starting your story at the most exciting part which will make the audience curious – they’ll want to know how you got there.
- Great storytelling: Examples from Alibaba Founder, Jack Ma
Remaining method
The remaining method structure is good for situations where you’re presenting your perspective on a controversial topic which has split people’s opinions.
- Go into the issue in detail showing why it’s such a problem – use logos and pathos.
- Rebut your opponents’ solutions – explain why their solutions could be useful because the audience will see this as fair and will therefore think you’re trustworthy, and then explain why you think these solutions are not valid.
- After you’ve presented all the alternatives provide your solution, the remaining solution. This is very persuasive because it looks like the winning idea, especially with the audience believing that you’re fair and trustworthy.
Transitions
When delivering presentations it’s important for your words and ideas to flow so your audience can understand how everything links together and why it’s all relevant. This can be done using speech transitions which are words and phrases that allow you to smoothly move from one point to another so that your speech flows and your presentation is unified.
Transitions can be one word, a phrase or a full sentence – there are many different forms, here are some examples:
Moving from the introduction to the first point
Signify to the audience that you will now begin discussing the first main point:
- Now that you’re aware of the overview, let’s begin with…
- First, let’s begin with…
- I will first cover…
- My first point covers…
- To get started, let’s look at…
Shifting between similar points
Move from one point to a similar one:
- In the same way…
- Likewise…
- Equally…
- This is similar to…
- Similarly…
Internal summaries
Internal summarising consists of summarising before moving on to the next point. You must inform the audience:
- What part of the presentation you covered – “In the first part of this speech we’ve covered…”
- What the key points were – “Precisely how…”
- How this links in with the overall presentation – “So that’s the context…”
- What you’re moving on to – “Now I’d like to move on to the second part of presentation which looks at…”
Physical movement
You can move your body and your standing location when you transition to another point. The audience find it easier to follow your presentation and movement will increase their interest.
A common technique for incorporating movement into your presentation is to:
- Start your introduction by standing in the centre of the stage.
- For your first point you stand on the left side of the stage.
- You discuss your second point from the centre again.
- You stand on the right side of the stage for your third point.
- The conclusion occurs in the centre.
Key slides for your presentation
Slides are a useful tool for most presentations: they can greatly assist in the delivery of your message and help the audience follow along with what you are saying. Key slides include:
- An intro slide outlining your ideas
- A summary slide with core points to remember
- High quality image slides to supplement what you are saying
There are some presenters who choose not to use slides at all, though this is more of a rarity. Slides can be a powerful tool if used properly, but the problem is that many fail to do just that. Here are some golden rules to follow when using slides in a presentation:
- Don’t over fill them – your slides are there to assist your speech, rather than be the focal point. They should have as little information as possible, to avoid distracting people from your talk.
- A picture says a thousand words – instead of filling a slide with text, instead, focus on one or two images or diagrams to help support and explain the point you are discussing at that time.
- Make them readable – depending on the size of your audience, some may not be able to see small text or images, so make everything large enough to fill the space.
- Don’t rush through slides – give the audience enough time to digest each slide.
Guy Kawasaki, an entrepreneur and author, suggests that slideshows should follow a 10-20-30 rule :
- There should be a maximum of 10 slides – people rarely remember more than one concept afterwards so there’s no point overwhelming them with unnecessary information.
- The presentation should last no longer than 20 minutes as this will leave time for questions and discussion.
- The font size should be a minimum of 30pt because the audience reads faster than you talk so less information on the slides means that there is less chance of the audience being distracted.
Here are some additional resources for slide design:
- 7 design tips for effective, beautiful PowerPoint presentations
- 11 design tips for beautiful presentations
- 10 tips on how to make slides that communicate your idea
Group Presentations
Group presentations are structured in the same way as presentations with one speaker but usually require more rehearsal and practices. Clean transitioning between speakers is very important in producing a presentation that flows well. One way of doing this consists of:
- Briefly recap on what you covered in your section: “So that was a brief introduction on what health anxiety is and how it can affect somebody”
- Introduce the next speaker in the team and explain what they will discuss: “Now Elnaz will talk about the prevalence of health anxiety.”
- Then end by looking at the next speaker, gesturing towards them and saying their name: “Elnaz”.
- The next speaker should acknowledge this with a quick: “Thank you Joe.”
From this example you can see how the different sections of the presentations link which makes it easier for the audience to follow and remain engaged.
Example of great presentation structure and delivery
Having examples of great presentations will help inspire your own structures, here are a few such examples, each unique and inspiring in their own way.
How Google Works – by Eric Schmidt
This presentation by ex-Google CEO Eric Schmidt demonstrates some of the most important lessons he and his team have learnt with regards to working with some of the most talented individuals they hired. The simplistic yet cohesive style of all of the slides is something to be appreciated. They are relatively straightforward, yet add power and clarity to the narrative of the presentation.
Start with why – by Simon Sinek
Since being released in 2009, this presentation has been viewed almost four million times all around the world. The message itself is very powerful, however, it’s not an idea that hasn’t been heard before. What makes this presentation so powerful is the simple message he is getting across, and the straightforward and understandable manner in which he delivers it. Also note that he doesn’t use any slides, just a whiteboard where he creates a simple diagram of his opinion.
The Wisdom of a Third Grade Dropout – by Rick Rigsby
Here’s an example of a presentation given by a relatively unknown individual looking to inspire the next generation of graduates. Rick’s presentation is unique in many ways compared to the two above. Notably, he uses no visual prompts and includes a great deal of humour.
However, what is similar is the structure he uses. He first introduces his message that the wisest man he knew was a third-grade dropout. He then proceeds to deliver his main body of argument, and in the end, concludes with his message. This powerful speech keeps the viewer engaged throughout, through a mixture of heart-warming sentiment, powerful life advice and engaging humour.
As you can see from the examples above, and as it has been expressed throughout, a great presentation structure means analysing the core message of your presentation. Decide on a key message you want to impart the audience with, and then craft an engaging way of delivering it.
By preparing a solid structure, and practising your talk beforehand, you can walk into the presentation with confidence and deliver a meaningful message to an interested audience.
It’s important for a presentation to be well-structured so it can have the most impact on your audience. An unstructured presentation can be difficult to follow and even frustrating to listen to. The heart of your speech are your main points supported by evidence and your transitions should assist the movement between points and clarify how everything is linked.
Research suggests that the audience remember the first and last things you say so your introduction and conclusion are vital for reinforcing your points. Essentially, ensure you spend the time structuring your presentation and addressing all of the sections.

- SUGGESTED TOPICS
- The Magazine
- Newsletters
- Managing Yourself
- Managing Teams
- Work-life Balance
- The Big Idea
- Data & Visuals
- Reading Lists
- Case Selections
- HBR Learning
- Topic Feeds
- Account Settings
- Email Preferences
How to Make a “Good” Presentation “Great”
- Guy Kawasaki

Remember: Less is more.
A strong presentation is so much more than information pasted onto a series of slides with fancy backgrounds. Whether you’re pitching an idea, reporting market research, or sharing something else, a great presentation can give you a competitive advantage, and be a powerful tool when aiming to persuade, educate, or inspire others. Here are some unique elements that make a presentation stand out.
- Fonts: Sans Serif fonts such as Helvetica or Arial are preferred for their clean lines, which make them easy to digest at various sizes and distances. Limit the number of font styles to two: one for headings and another for body text, to avoid visual confusion or distractions.
- Colors: Colors can evoke emotions and highlight critical points, but their overuse can lead to a cluttered and confusing presentation. A limited palette of two to three main colors, complemented by a simple background, can help you draw attention to key elements without overwhelming the audience.
- Pictures: Pictures can communicate complex ideas quickly and memorably but choosing the right images is key. Images or pictures should be big (perhaps 20-25% of the page), bold, and have a clear purpose that complements the slide’s text.
- Layout: Don’t overcrowd your slides with too much information. When in doubt, adhere to the principle of simplicity, and aim for a clean and uncluttered layout with plenty of white space around text and images. Think phrases and bullets, not sentences.
As an intern or early career professional, chances are that you’ll be tasked with making or giving a presentation in the near future. Whether you’re pitching an idea, reporting market research, or sharing something else, a great presentation can give you a competitive advantage, and be a powerful tool when aiming to persuade, educate, or inspire others.
- Guy Kawasaki is the chief evangelist at Canva and was the former chief evangelist at Apple. Guy is the author of 16 books including Think Remarkable : 9 Paths to Transform Your Life and Make a Difference.
Partner Center
How-To Geek
How to change the measurement unit in microsoft powerpoint.

Your changes have been saved
Email Is sent
Please verify your email address.
You’ve reached your account maximum for followed topics.
Why the Logitech G502 Will Forever Be My Favorite Mouse
Paramount+ will make big changes under new ownership, 8 things you should do after purchasing a new windows laptop, quick links, change powerpoint's measurement unit on windows 10, change powerpoint's measurement unit on mac.
Most of the world uses the Metric system, whereas the U.S. still uses the Imperial system of measurement. Depending on what you are used to, you may want to change the measurement unit in Microsoft PowerPoint. Here's how.
While there's a built-in option for changing the measurement unit in Microsoft Word , that's not the case for PowerPoint. Microsoft PowerPoint actually uses the system of measurement that the computer it's installed on uses, which means that you need to adjust your computer's system settings---not PowerPoint's.
Related: The Best Free Programs and Websites for Converting Units and Currency
Go ahead and close any Microsoft Office applications currently running on your Windows 10 PC. Next, open the Control Panel by clicking the Windows icon found at the bottom of your screen, type "Control Panel" in the Search bar, and select the "Control Panel" app in the search results.

The "All Control Panel Items" window will appear. Click "Region."

The Region window will appear. In the "Formats" tab, which you'll already be in, click "Additional Settings."

You'll now be in the "Numbers" tab of the "Customize Format" window. Here, click the down arrow in the box next to "Measurement System," choose the measurement system you'd like to use (the Imperial system is listed as "U.S." here), and then click "Apply."

The next time you open PowerPoint, the measurement units will have changed to the selected measurement system.
On your Mac, quit any Office applications that are currently running. Next, click the Apple icon in the menu bar and select "System Preferences" from the drop-down menu.

In the "System Preferences" window, click "Language & Region."

Here, click "Advanced."

In the "General" tab, click the up or down arrow next to the "Measurement Units" box and, from the context menu that appears, select your desired measurement system.

Finally, click "OK." The next time you open Microsoft PowerPoint, the measurement units will have changed to the selected measurement system.
- Microsoft Office
- Microsoft PowerPoint
- Request Info
FinTech + AI 413 Startup Launch Series Receives MassMutual Support
Young entrepreneurs turn ideas into action.

Left to right: Sears Merritt, Head of Enterprise Technology and Experience, MassMutual; Patrick Larkin, Deputy Director, Massachusetts Technology Collaborative; WNE Board Chair Nicholas LaPier; WNE Trustee Elena Gervino, Senior Vice President, Travelers; Dr. Robert E. Johnson, President, Western New England University.
Western New England University (WNE) has launched its first FinTech + AI 413 Startup Launch Series, made possible by the generous support of MassMutual. With a donation of $75,000 over three years, MassMutual is the first sponsor of the FinTech + AI 413 Startup Launch Series , comprised of a series of events designed to connect college students and local entrepreneurs who have innovative startup ideas with the training and resources needed to bring those ideas to life. This initiative is further set to make significant contributions to the economic landscape of western Massachusetts by providing an avenue for participants to channel their academic scholarship into entrepreneurial ventures using some the latest financial technology (FinTech) and artificial intelligence (AI) ideas.
MassMutual’s Head of Enterprise Technology and Experience Sears Merritt presented a check to WNE President Dr. Robert E. Johnson during the FinTech + AI 413 Summer Incubator Fellowship (SIF), a six-week residential fellowship in which startup teams advance their FinTech ideas to a prototype phase.
During the official check presentation on July 10, President Johnson emphasized the importance of preparing students for the future, highlighting the University’s commitment to advancing innovation and entrepreneurship and inviting other partners to join the effort. He stated, “Western New England University is committed to fostering a dynamic environment where innovation and entrepreneurship can thrive. This partnership with MassMutual empowers our students by providing them with the resources, mentorship, and practical experiences necessary to bring their FinTech ideas to life. Our mission is to equip students with the skillset and mindset necessary to excel in an ever-evolving technological landscape, ensuring they are well-prepared to contribute meaningfully to the future of the industry and our community. We look forward to working with other sponsors and partners to further build the impact of this program.”
Merritt underscored the shared vision of both institutions to drive economic growth and innovation in western Massachusetts, saying, “We’re proud to support Western New England University as they launch the 413 FinTech & AI accelerator and excited about the impact this program will have in helping students innovate and launch startups that will shape the future. This program also serves to bridge innovation across the state – from Boston to Worcester and now Springfield – and the collaboration demonstrates our commitment to contributing to a thriving ecosystem for innovation right here in western Massachusetts.”
The Mass Fintech Hub , which Merritt recently began to co-chair, was a key driver in helping launch this accelerator, as its mission is to make Massachusetts the global FinTech hub. WNE has been one of the Mass Fintech Hub’s academic partners since the inception of the organization three years ago. The Massachusetts Technology Collaborative also played a key role in launching the Mass Fintech Hub, along with WNE and other leading academic institutions across Massachusetts.
Western New England University and MassMutual are longstanding partners, having previously collaborated on innovative projects that benefit the community and enhance educational opportunities. For example, they launched the Free Legal Kiosk initiative , providing accessible legal resources to underserved populations. WNE and MassMutual also spearheaded the COVID Relief Coalition , offering critical support and services during the pandemic. Additionally, their Consumer Debt Initiative (CDI) aims to educate and assist individuals in managing and overcoming financial challenges. The partnership also supports student development through internships and mentorship programs, offering invaluable real-world experience and professional networking opportunities. These initiatives reflect a shared commitment to social responsibility and community engagement.
About the FinTech + AI 413 Startup Launch Series
The WNE FinTech + AI 413 Startup Launch Series kicked off in April with 11 participants from area institutions including WNE, Springfield College, Worcester Polytechnic Institute, and The Hartford participating in the Idea Jam to share ideas for feedback with industry mentors. The Pitch Camp followed, where mentors helped the participants prepare and practice an elevator pitch of their startup idea in advance of the Elevator Pitch Contest. Judges selected five winning teams to receive the Summer Incubator Fellowship (SIF) and up to a $1,000 micro-grant to launch their startup.
About WNE’s FinTech Incubator
Western New England University’s FinTech Incubator (FTI), housed in the College of Business, is emerging as a central hub for FinTech growth in western Massachusetts. The FTI aims to provide workforce development and technical resources to promote local FinTech initiatives, fostering partnerships with enterprises to drive research and innovation in the region. This initiative is set to make significant contributions to both academic scholarship and practical applications in the fields of finance and technology.
The FinTech + AI 413 Startup Launch Series aims not only to enhance general education about financial technology but also to elevate awareness of the regional resources and culture of entrepreneurship available beyond Boston. By showcasing student innovation and engagement, WNE and MassMutual are setting the stage for broad community and regional benefits through their collaboration.
For more information about the FinTech + AI 413 Startup Launch Series and the FinTech Incubator at WNE, visit wne.edu .
related stories

Free Small Business Legal Clinic Now Accepting Applications

Western New England University Hosts Attorney General Andrea Joy Campbell’s Reproductive Justice Unit Convening

WNE Creates a Campus Where Everyone Feels Welcome
- Share Article

- The Star ePaper
- Subscriptions
- Manage Profile
- Change Password
- Manage Logins
- Manage Subscription
- Transaction History
- Manage Billing Info
- Manage For You
- Manage Bookmarks
- Package & Pricing
Hextar Capital unit secures RM97.04mil contract for student hostels
- Corporate News
Thursday, 11 Jul 2024
Related News

Corporate lenders are locking down protection
Trading ideas: ql resources, genm, solarvest, econpile, ppt synergy, widad, lfe, mui, haily, annum, eurospan, scomi energy, singapore's keppel dc reit enters japan with us$145mil data centre purchase.
KUALA LUMPUR: Hextar Capital Bhd's wholly-owned subsidiary T&J Engineering Sdn Bhd has secured a contract from landasan Kapital (M) Sdn Bhd valued at RM97.04mil to supply materials, labour, tools and equipment for the construction of student hostels at Universiti Malaysia Kelantan in Bachok.
In a filing with Bursa Malaysia, the group said the contract commenced on April 15, 2024, and is expected to be completed on Aug 14, 2026.
As at 12.30pm, shares in Hextar Capital were unchanged at 86 sen a share after 72,700 units done.
Tags / Keywords: Hextar Capital , T&J Engineering , construction
Found a mistake in this article?
Report it to us.
Thank you for your report!

PROTECTING TOMORROW’S GENERATION TODAY
Next in business news.

Trending in Business
Air pollutant index, highest api readings, select state and location to view the latest api reading.
- Select Location
Source: Department of Environment, Malaysia
Others Also Read
Best viewed on Chrome browsers.

We would love to keep you posted on the latest promotion. Kindly fill the form below
Thank you for downloading.
We hope you enjoy this feature!
Home Blog Education How to Present a Lesson Plan
How to Present a Lesson Plan

First days are always exciting, and expectation builds up about the contents of the task ahead, especially if you’re starting a class as a student or professor. This interaction will be significant because it will establish and define the subjects to be covered and the set of expectations flowing from the instructor towards the audience.
Perhaps you are ready to begin your career as a teacher and need some guidance; otherwise, you are a seasoned instructor searching for a refresher in your program. No matter which of the above you represent, the truth of the matter is that you are probably seeking a better way to introduce the subjects you’ll be teaching to your students.
What is a lesson plan?
A lesson plan will be the set of subject matter materials you will be teaching during a specific timeframe. The lesson plan should be an index that students can constantly consult to understand better the parts of the learning journey they will go through during each session.
Teachers and professors should have a lesson plan template that happens in every session. This is different from a syllabus because, in the latter case, the whole curriculum of the program will be laid out; however, for each lesson, there should be one individual lesson plan example to guide the instructor in the set timeframe.
When building the materials for the class or lesson’s attention, it’s always essential to share elements like the purpose or rules that guide the learning process . This article will explore the best way to present a lesson plan and drive a learning session successfully from the instructor or professor’s view.
How to write a lesson plan
Education nowadays guides different sorts of students and target specific learning needs. Therefore, it’s important and relevant to understand how lesson plans can change and be varied to truly implement the best learning path for your students. Once you have this part figured out, the next step is to understand how you will transmit the information and use a PowerPoint Presentation to simplify creating and presenting a lesson plan to your students.
Lesson plans will comprise several different sections that will clarify the first questions students can have: How long will the course be? Will it be an online course ? What will be the main objectives? Which subjects will be discussed along with the class?
1. Introduction
As the lesson begins, it’s essential to place a brief yet descriptive introduction about what the session will cover. A good practice is to create a catchy title for each lesson to have an overall understanding of the information they will be receiving.
Example: Digital Marketing Basics: Industry background, historical review years 1980-2010. In this session, we will cover the birth of digital marketing, including all the touchpoints that shaped today’s industry.
2. Audience
If your class is a one-time-only or recurring session, or even a blended learning journey, it’s essential to explain to your students who this class is for; this will allow them to calibrate their expectations about the matter to be taught ahead.
Example: This lesson is directed to professionals who work in traditional marketing, business owners, or communication specialists seeking to have a profound understanding of how digital marketing came to be.
3. Lesson Objectives
This piece is critical because it will allow the students to assess the intention of each lesson. When thinking about the objectives, it’s vital to consider the acquired skills we expect our students to have at the end of the class. Like any other goals in life or business, each one should be actionable and measurable, meaning after each class, students should be able to use what they have learned and put into action the concepts.
Example : Understand and be able to create a timeline framework of reference to explain the story of the Internet.
4. Materials
Suppose the lesson requires using any specific materials, physical or not, including any software or hardware necessary. In that case, it´s important to list or include within the lesson plan so students can set clear expectations on what they might require. This is particularly important if the session you will be delivering requires them beforehand to bring anything.
Example :
- Computer
- Scratch paper
5. Learning Activities
We´ve covered all the logistics by this point; however, now we need to start sharing the actual activities during the lesson. Ideally, this is a play-by-play of how each activity will guide the lesson towards the already established objectives. To add the list of learning activities that will be helpful for your students, take into account how all of them align with each goal and the requirements students need.
Make sure that you add variety to the activities that you are proposing, go ahead and research trends of how many other teachers or professors, students will appreciate your search to engage them in learning.
Also, consider how much time they will take so that you can note it in the next section.
- Create a timeline on the wall with the most important moments of digital marketing history, including creation of social media, mainstream of email, etc.
Time periods
Pairing each learning activity with a specific timeframe will be useful both for instructors and students. Make sure you calculate a reasonable amount of time for each activity and list it within the lesson plan so everyone can set correct expectations. Assigning time slots for each exercise will also help students and teachers stay on track with the lesson and not waste valuable time invested in learning.
Example : Creation of a timeline – 45 min

How to present a lesson plan
We have now listed the components of the lesson plan structure, everything looks beautiful in the draft, but now we need to start planning how we will present the program to the students. This part is challenging because you have to choose a template that makes sense for you and will be helpful for your students to understand.
A PowerPoint presentation is a great way to showcase all the contents of the lesson plan, however, the trick is to decide how you want to structure it.
Lesson Plan Design
By this point, you’ve structured a lesson plan template that can go through any test. Nevertheless, creating the materials to accompany it can be a key in the commitment generates between the students and the professor.
Design and Style
Before adding any text to your presentation template , think about the requirements you have: Does the academic institution where you work require the use of logos? Do you have to follow any visual guidelines? This might be important for the cohesiveness of your presentation.
It’s essential to think about how you would like to present the lesson plan. You may want to keep it simple and have a 1 pager and talk through it to understand your students fully, or perhaps you need to create one full presentation where every slide will be a relevant piece of information. Let’s explore this a bit further.
One Pager Lesson Plan
If your style is more towards simplicity, this is a great solution: succinct, minimalistic, and straight to the point. You can complete a one-page lesson plan with bullets of the relevant data and send it out to students. A great advantage of this format is that you can either send it as a PDF or even as a single image (JPG or PNG), exporting it directly from PowerPoint.
One significant advantage is that your students will only have to check for one source by choosing this simple format when revising the lesson during the class or afterward.
Several pages lesson plan
Almost like a syllabus, a more extended presentation will include several slides so you can include the information in different formats.
For example, you can use the first slide to include the lesson title; afterward, a new slide can define the purpose or introduction of the lesson. In the upcoming slides, you can include materials, contents, and even ad charts or similar to explain how grades will be affected by each lesson’s assignments on the upcoming slides.
Text in the presentation
It’s always good to follow the reliable practices of presentations and include the necessary information without overwhelming students. Don’t add an excessive amount of text to one slide; actually, make sure that every piece of data is helpful for students to plan their time both during and after class.
However, if you will be sending out the presentation to your students before reviewing it, consider that they will be using it for their reference to follow through with your lesson. So make sure all the information is easy to read and accessible.
Additional elements
Learners of all sorts have become increasingly visual, so don’t be afraid to add infographics, images, photographs, icons or any other elements to make your lesson plan presentation more appealing visually.

Final Words
Remember the lesson plan presentation will be the first approach your students will have with the subject matter. Take your time, enjoy the process, and create comprehensive and attractive lesson plan slides that will inspire your students to have thoughtful and deep learning.
1. 1-Slide Lesson Plan PowerPoint Template
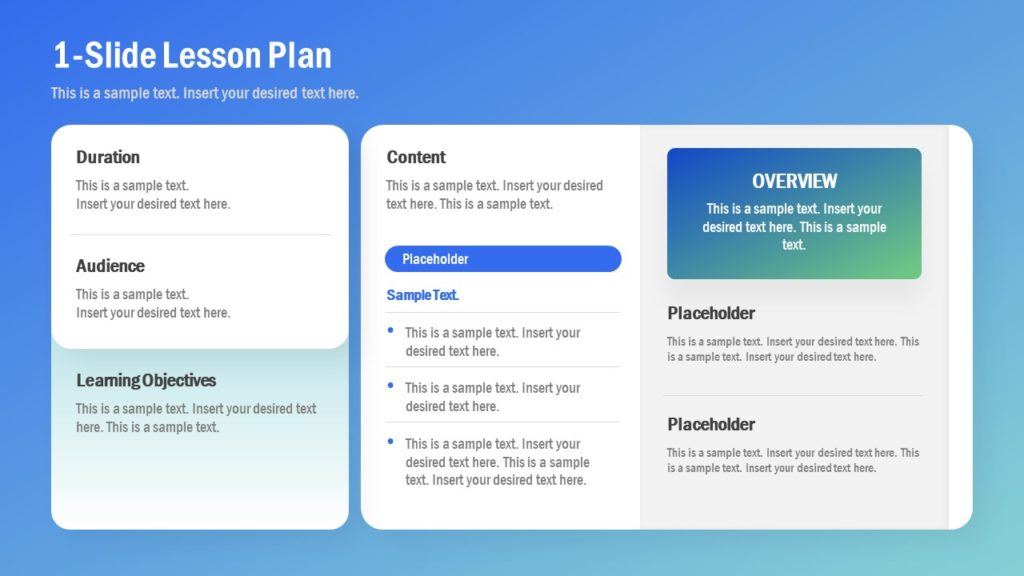
Create a simple and minimalist one-pager lesson plan for your academic uses, course planning, and even as student handouts, with this eye-catching PowerPoint template.
Use This Template
Like this article? Please share
Learning Experience, Learning Styles, Presentation Approaches, Presentation Tips, Presentations Filed under Education
Related Articles

Filed under Education • July 10th, 2024
How to Memorize a Presentation: Guide + Templates
Become a proficient presenter by mastering the art of how to memorize a presentation. Nine different techniques + PPT templates here.

Filed under Design • July 3rd, 2024
ChatGPT Prompts for Presentations
Make ChatGPT your best ally for presentation design. Learn how to create effective ChatGPT prompts for presentations here.

Filed under Design • July 1st, 2024
Calculating the Slide Count: How Many Slides Do I Need for a Presentation?
There’s no magical formula for estimating presentation slides, but this guide can help us approximate the number of slides we need for a presentation.
Leave a Reply

Want to create or adapt books like this? Learn more about how Pressbooks supports open publishing practices.
Unit 32: Presentations – An Overview
Learning objectives.

- demonstrate how to plan a presentation
- understand how to construct the different parts of any presentation
- identify the use of different organizing principles for a presentation
- identify the different methods of speech delivery
- utilize specific techniques to enhance speech delivery
Introduction
To get started, let’s review the video below to gain an understanding of what is required to develop world class and effective presentations.
Planning Your Presentation
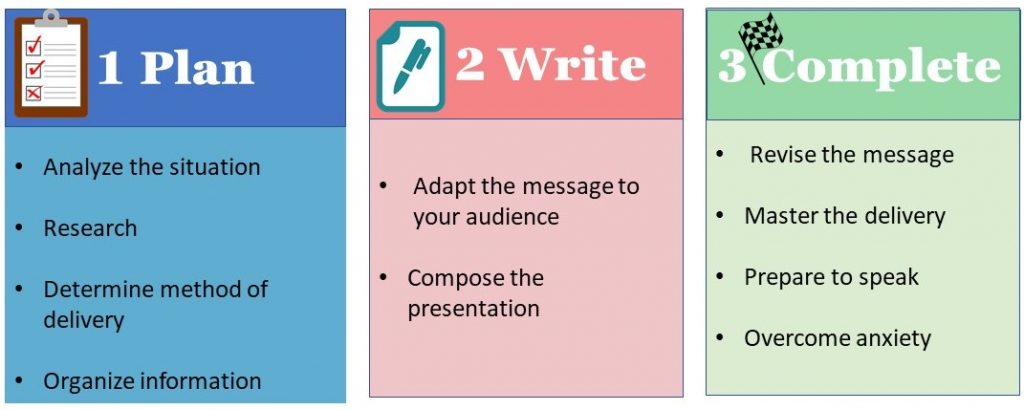
Planning a presentation is much like planning other business documents. There is importance to undertaking and applying a systematic process of planning, researching, drafting, and revising before delivering the final product. Completing this process can take a considerable amount of time. Figure 32.1 provides the planning process
Planning in any presentation is helpful both to you and to your audience. Your audience will appreciate receiving the information presented in an organized way, and being well organized will make the presentation much less stressful for you.
Successful presenters know their material, are prepared, do not read a script or PowerPoint presentation, do not memorize every single word in order (though some parts may be memorized), and do not make it up as you go along. Your presentation is scripted in the sense that it is completely planned from start to finish, yet every word is not explicitly planned, allowing for some spontaneity and adaptation to the audience’s needs in the moment.
Your organization plan will serve you and your audience as a guide, and help you present a more effective speech. Just as there is no substitute for practice and preparation, there is no substitute for planning.
Knowing the Purpose
Speeches have traditionally been seen to have one of three broad purposes: to inform, to persuade, and — well, to be honest, different words are used for the third kind of speech purpose: to inspire, to amuse, to please, or to entertain. These broad goals are commonly known as a speech’s general purpose, since, in general, you are trying to inform, persuade, or entertain your audience without regard to specifically what the topic will be. Perhaps you could think of them as appealing to the understanding of the audience (informative), the will or action (persuasive), and the emotion or pleasure.
Before getting into the specifics of how to create a purpose statement for a presentation, the following video provides an overview of the process.
Now that you know your general purpose (to inform, to persuade, or to entertain), you can start to move in the direction of the specific purpose. A specific purpose statement builds on your general purpose (to inform) and makes it more specific (as the name suggests). So if your first speech is an informative speech, your general purpose will be to inform your audience about a very specific realm of knowledge.
In writing your specific purpose statement, you will take three contributing elements (shown in figure 32.2) that will come together to help you determine your specific purpose :
- You (your interests, your background, past jobs, experience, education, major),
- Your audience
- The context or setting.

Keeping these three inputs in mind, you can begin to write a specific purpose statement , which will be the foundation for everything you say in the speech and a guide for what you do not say. This formula will help you in putting together your specific purpose statement:
To _______________ [Specific Communication Word (inform, explain, demonstrate, describe, define, persuade, convince, prove, argue)] my [ Target Audience (my classmates, the members of the Social Work Club, my coworkers] __________________. [T he Content (how to bake brownies, that Macs are better than PCs].
Example: The purpose of my presentation is to demonstrate for my coworkers the value of informed intercultural communication.
Formulating a Central Idea Statement
While you will not actually say your specific purpose statement during your speech, you will need to clearly state what your focus and main points are going to be. The statement that reveals your main points is commonly known as the central idea statement (or just the central idea). Just as you would create a thesis statement for an essay or research paper, the central idea statement helps focus your presentation by defining your topic, purpose, direction, angle and/or point of view. Here are two examples:
Specific Purpose – To explain to my classmates the effects of losing a pet on the elderly.
Central Idea – When elderly people lose their animal companions, they can experience serious psychological, emotional, and physical effects.
Specific Purpose – To demonstrate to my audience the correct method for cleaning a computer keyboard.
Central Idea – Your computer keyboard needs regular cleaning to function well, and you can achieve that in four easy steps.
Knowing the audience
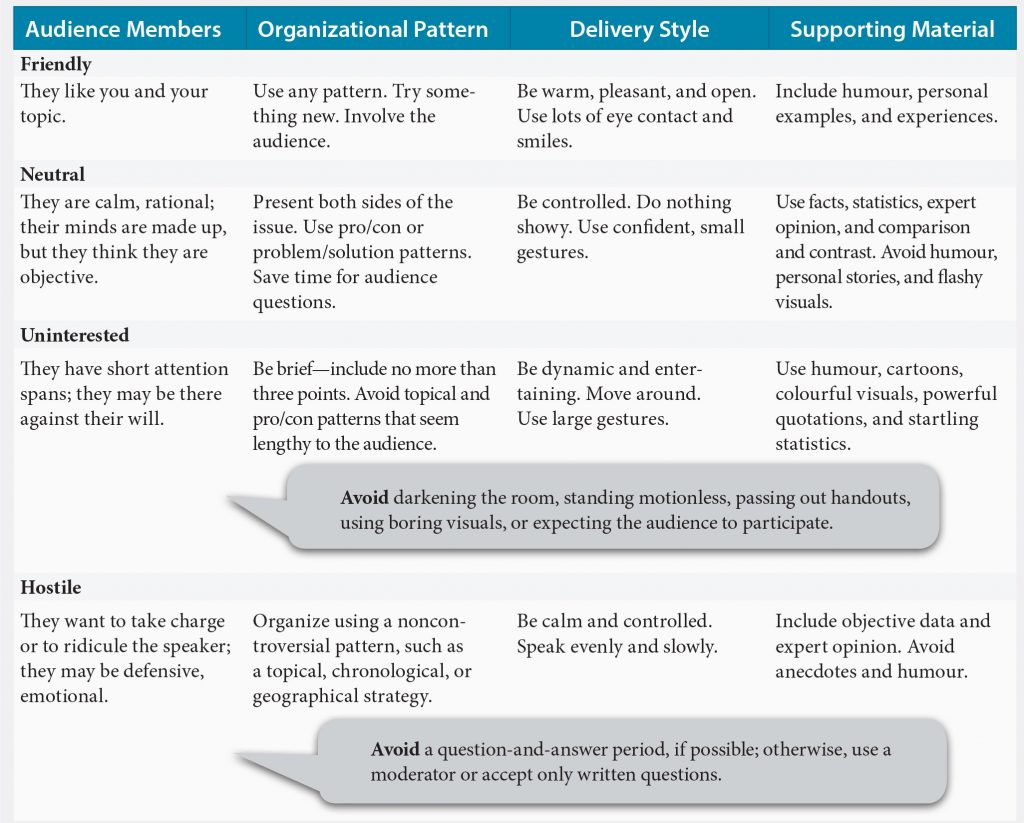
Given the diverse nature of audiences, the complexity of the communication process, and the countless options and choices to make when preparing your presentation, you may feel overwhelmed. One effective way to address this is to focus on ways to reach, interact, or stimulate your audience. All audiences fall into four categories: friendly, neutral, uninterested, or hostile (see Figure 32.3). No matter the audience, your job is to deliver a presentation that will address the needs of your audience. Ask yourself these questions to determine how well your presentation will meet the needs of your audience:
- How will this topic appeal to this audience?
- Does the presentation meet my audience’s needs?
- What strategy or strategies will be most effective in communicating the information to my audience?
- What activities will encourage the audience to remember the main points of the presentation?
Developing and Organizing Content
Presentation outline.
You’re now ready to prepare an outline for your presentation. To be successful in your presentation, you’ll need two outlines: a preparation outline , and a speaking outline .
Preparation outlines are comprehensive outlines that include all of the information in your presentation. Your presentation outline will consist of the content of what the audience will see and hear. Eventually, you will move away from this outline as you develop your materials and practice your presentation.
Your speaking outline will contain notes to guide you; notes that are usually not shared with your audience. It will summarize the full preparation outline down to more usable notes. You should create a set of abbreviated notes for the actual delivery.
Your organizational model will help determine how you will structure (see below) your preparation outline. You can use your presentation outline as a starting point to developing your speaking outline. It’s a good idea to make speaking notes to align with your main points and visuals in each section. See Unit 12 for more information on constructing an outline. Figure 33.4 provides the basic parts of a presentation outline.
Developing the Content
The general organization for presentations include:
- Attention Statement : an engaging or interesting statement that will cause your audience to sit up and take notice.
- Introduction : setting out your general idea statement (LINK) and giving the audience an idea of what to expect.
- Body : This section contains your research, main points and other relevant information. It will follow your organizational pattern.
- Conclusion : reiterating your idea statement, and/or includes a call-to-action — what you want the audience to do or think about following your presentation.
- Residual Message : this is an optional section, but a powerful one. It is the final message you want the audience to remember.
In putting together a presentations, presenters will often use examples and scenarios to help illustrate the their message. The main difference between examples and scenarios is that while both help “show” the audience what you mean, an example is the “thing” itself, while a scenario would include more detail about the sequence or development of events. Scenarios also tend to be longer and more nuanced.
Storytelling can be an effective way to convey your message to your audience. Stories are a fundamental part of the human experience, and, if well-told, can resonate with listeners. Some of the most inspiring speakers use storytelling effectively in their presentations. You can find out more about how to incorporate storytelling techniques into presentations from the video below.
“ The next 10 minutes might save your life”
“ In the end we will not remember the words of our enemies but the silence of our friends ”
Did these quotes heighten your interest in what the speaker is about to say?. During the first two to three minutes of a presentation, gaining the attention of listeners is crucial. Using words and phrases (like the ones above) and effective visual aids will make an immediate impact on listeners and capture their attention. Presentations that are able to immediately capture the audience’s attention are also more likely to keep the audience’s attention throughout. Take a minute to view these effective presentations attention getters from experienced and established speakers at TedTalks.
Effective attention getting strategies that you can incorporate into a presentation include:
- Tell a compelling story that illustrates an important and relevant point.
- Ask a question that will get your audience thinking about your message.
- Share an intriguing, unexpected, or shocking detail.
- Open with an amusing observation about yourself, the subject, or circumstances surrounding the presentation.
In addition to stimulate the listener’s interest, the introduction must also establish the speaker’s credibility, and preview the main points of the presentation.
To establish credibility with an audience, provide information on the qualification that empower you to speak about the topic: your job, experience, education, knowledge, etc. Credibility is established by connecting your qualifications to the presentations subject matter. If you are not a well known authority on the matter, establishing your credibility will go along way to influence the audience’s decision to listen to your presentation and to take it seriously.
The Introduction must also preview the main points the presentation will discuss. The preview will provide a broad overview of the presentation’s main points and indicate the order each point will be discussed. Using a visual aid to present the points and their order is often an effective strategy.
Most of your presentation will be spent filling in the details of the main points first announced in the Introduction of your presentation. Effective presenters do not overwhelm their audience with too much information. Instead, effective presenters streamline their presentations by including only one or two important details for each main point. To accomplish this task, a presenter must be very informed on the topic and very aware of the audience in order to determine what information will be most impactful to a particular audience. No matter the audience, too much information can confuse listeners and conceal the central message of the presentation. So keep presentations simple and logical. Applying one of several organizing systems to a presentation will assist in streamlining information. For example: Chronology, Comparison/Contrast , Importance , or Best/Worst Cases .
An important part of any presentation is knowing how to connect your main points in a relevant manner, so that your presentation appears fluid? Using t ransitional words and phrases provide is one method to help the audience follow the speaker’s ideas, connect the main points to each other, and see the relationships you’ve created in the information you are presenting. Transitions are used by the speaker to guide the audience in the progression from one significant idea, concept or point to the next issue. They can also show the relationship between the main point and the support the speaker uses to illustrate, provide examples for, or reference outside sources. Depending your purpose, transitions can serve different roles as you help create the glue that will connect your points together in a way the audience can easily follow.
The concluding section of a presentation acts very much like a concluding paragraph for an essay: it summarizes the information presented. However, for presentations, the concluding section also provide additional benefits for presentations. An effective conclusion will
- Provide a transition signalling the end of the presentation
- Summarize the main themes of the presentation
- Leave the audience with specific and noteworthy takeaways
- Motivate the audience to take action
The conclusion should be memorable. Ask yourself the question: what do you want my audience to remember most? The answer to that question is the subject of your conclusion. Don’t just say the same things you said during the presentation. Breath fresh air into the information or come at the information from another angle. End on a strong and positive note. Think through and plan your last remarks to ensure the audience walks away with a positive impression of you and your company.
Types of Business Presentations
As we’ve discussed, a presentation will have one of three general purposes: to inform, to persuade, or to entertain. However, each of these purposes may be required to deliver many different types of information. In business, you will be involved in different projects, assignments, departments, etc., and be required to provide updates, reports, and overviews of the various activities. A presentation about an ongoing project to your supervisor will not be the same type of presentation provided to the sales team; the type presentation students give for a class assignment, is not the same type of weekly presentation your instructor provides. There are many types of business presentations. Understanding each type will help to ensure you target your message at the right audience in the right way.
Briefings: A condensed account of business situation. Briefings bring the members of a department or project together so information can be shared and discussed.
Reports: Routine reports on ongoing projects, issues, problems, or proposals are expected. There are many types of routine reports, including: progress, convention, incident, trip, etc. (see Chapter 13 ). During your career, you may be required to present one or more of these types of reports to your superior, colleagues, or rank-and-file employees, inside and outside your organization. This type of presentation range from very simple presentations with minimal audio-visual and multimedia integration to presentations that include elaborate audio-visual and multimedia integration.
Podcasts: A podcast is an online, prerecorded audio clip delivered online. Podcasts are used by companies to present up-to-date information on current products and services. In addition, podcasts are be used to introduce and train employees.
Virtual Presentations: Business teams are often composed of individuals who are not in the same geographic location or perhaps have to work collaboratively outside of normal office hours. This type of collaborative effort is greatly facilitated by the availability of information technology. In your career, you may be required to work with a remote team to develop and present a project or different types of reports by making a virtual presentation. The steps to developing effective virtual presentations are the same as any other type of presentation.
Webinars: A webinar is a web-based presentation that is transmitted digitally, with or without video. Companies use webinars in a similar manner to podcasts. Company products and services as well as employee training and introductions are presentations common to webinars.
Additional information on developing presentations can be found at The Learning Portal .
Key Takeaway

- All presentation must have a general purpose, specific purpose and central idea statements is
- Correctly profiling an audience will ensure your presentation delivers the right message in the most effective manner
- All presentations include an attention getter, introduction, body, and conclusion.
- Correctly the matching the message to the correct type of presentation will increase the effectiveness of the message

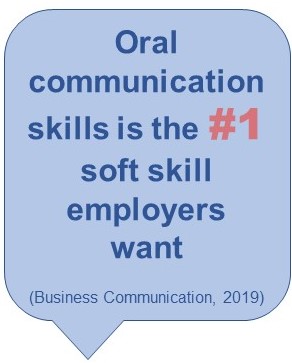
- Interview one or two individuals in your professional field. How is oral communication important in this profession. Does the need for oral skills change as one advances? What suggestion can these people make to newcomers to the field for developing proficient oral communication skills?
Bovee, C.L., Thill, J. V., & Scribner J. A. (2016). Business communication essentials (4th ed.). Don Mills, ON: Pearson Canada Inc.
COMMpadre Media. (n.d.). Speech purpose & central idea [Video file]. Retrieved from https://www.youtube.com/watch?v=jsOxyci_CNM
Communication Coach Alex Lyon. (2017). How to end a presentation [Video file]. Retrieved from https://www.youtube.com/watch?v=fBO0riisOzU
eCampusOntario. (2020). Chapter 5: Presentation organization. Communication for business professionals . Retrieved from https://ecampusontario.pressbooks.pub/commbusprofcdn/chapter/introduction-3/
Duarte, Inc. (n.d.). Five simple rules for creating world changing presentations [Video file]. Retrieved from https://www.youtube.com/watch?v=hT9GGmundag&t=1s
Guffey, M., Loewry, D., & Griffin, E. (2019). Business communication: Process and product (6th ed.). Toronto, ON: Nelson Education. Retrieved from http://www.cengage.com/cgi-wadsworth/course_products_wp.pl?fid=M20b&product_isbn_issn=9780176531393&template=NELSON
Reed, G. (2017). Your go-to presentation outline. Ethos3.com . Retrieved from https://www.ethos3.com/2017/01/your-go-to-presentation-outline-template/
Rule the Room. (2013). How to do a presentation: 5 steps to a killer opener [Video file]. Retrieved from https://www.youtube.com/watch?v=dEDcc0aCjaA
Standford Graduate School of Business. (2013). Nancy Duarte: How to tell a story [Video file]. Retrieved from https://www.youtube.com/watch?v=9JrRQ1oQWQk
A presentation that presents the history of an issue or circumstance in time order
A presentation presenting the pros and cons of two or more issues, products, methods, etc.
Presentations of reasons to do or not to do something moving from most to least important or visa versa
Presenting the best and/or worst scenario of an action or inaction.
Communication at Work Copyright © 2019 by Jordan Smith is licensed under a Creative Commons Attribution 4.0 International License , except where otherwise noted.
Share This Book
- Acceleration
- Temperature

- ppt (%) to ppm
(Salinity Percentage to Parts per Million)
| -10% Copy +10% | -10% Copy +10% | |
| 2X of ▶ | 1/2X of ▶ |
| 5X of ▶ | 1/5X of ▶ |
| 8X of ▶ | 1/8X of ▶ |
Other ppt (%) Conversions
- ppt (%) to ppt ⇄ [ Salinity Percentage to Parts per Thousand ⇄ ] (You are Here) (Biggest)
- ppt (%) to ppt ⇄ [ Salinity Percentage to Parts per Thousand ⇄ ] (Base Unit)
- ppt (%) to ppm ⇄ [ Salinity Percentage to Parts per Million ⇄ ] (You are Here) (Smallest)
ppt (%) to ppm Conversion
The abbreviation for ppt (%) and ppm is salinity percentage and parts per million respectively. 1 ppt (%) is 10000 times bigger than a ppm. To measure, units of measurement are needed and converting such units is an important task as well. unitsconverters.com is an online conversion tool to convert all types of measurement units including ppt (%) to ppm conversion.
Salinity Percentage to ppm
Check our Salinity Percentage to ppm converter and click on formula to get the conversion factor. When you are converting salinity from Salinity Percentage to ppm, you need a converter that is elaborate and still easy to use. All you have to do is select the unit for which you want the conversion and enter the value and finally hit Convert.
ppt (%) to Parts per Million
The formula used to convert ppt (%) to Parts per Million is 1 Salinity Percentage = 10000 Parts per Million. Measurement is one of the most fundamental concepts. Note that we have Salinity Percentage as the biggest unit for length while Parts per Million is the smallest one.
Convert ppt (%) to ppm
How to convert ppt (%) to ppm? Now you can do ppt (%) to ppm conversion with the help of this tool. In the length measurement, first choose ppt (%) from the left dropdown and ppm from the right dropdown, enter the value you want to convert and click on 'convert'. Want a reverse calculation from ppm to ppt (%)? You can check our ppm to ppt (%) converter .
ppt (%) to ppm Converter
Units of measurement use the International System of Units, better known as SI units, which provide a standard for measuring the physical properties of matter. Measurement like salinity finds its use in a number of places right from education to industrial usage. Be it buying grocery or cooking, units play a vital role in our daily life; and hence their conversions. unitsconverters.com helps in the conversion of different units of measurement like ppt (%) to ppm through multiplicative conversion factors. When you are converting salinity, you need a Salinity Percentage to Parts per Million converter that is elaborate and still easy to use. Converting ppt (%) to Parts per Million is easy, for you only have to select the units first and the value you want to convert. If you encounter any issues to convert Salinity Percentage to ppm, this tool is the answer that gives you the exact conversion of units. You can also get the formula used in ppt (%) to ppm conversion along with a table representing the entire conversion.
- Terms of Use
- Privacy Policy


AP Psych PowerPoint Slides
Google Drive Access: Psych Slides Good luck on the exam!
Anatomy of a PowerPoint Presentation
The basic building block of a PowerPoint presentation is the slide a block of content the size of a computer screen that typically contains a title, some text, and perhaps a picture or chart. A PowerPoint presentation typically contains many slides.
Figure 1 illustrates a PowerPoint presentation made up of 30 slides. The default (Normal) view includes notes attached to the current slide, and a navigation panel on the left side that allows you to switch between a text outline and slide thumbnails.
Figure 1. PowerPoint's Normal view includes most of the information you need to assemble a presentation.

A fully loaded slide (see Figure 2 ) includes at most six parts:
Figure 2. All the components of a PowerPoint slide are shown here, with slide thumbnails in place of a text outline.

The title, which usually sits at the top of the slide.
Body text, the main part of the slide. More often than not, the text on a slide consists of a series of bulleted or numbered items. However, you can enter any kind of text in this part of a slide bullets and numbers are not required.
Some slides contain content in addition to text. You can add charts, tables, pictures, diagrams, and video clips to help illuminate your presentation.
Text and content sit inside resizable and movable containers called placeholders, which you can see if you click the text or graphic in the slide pane. PowerPoint help screens sometimes refer to the placeholder and the text or content it contains as a "text object" or a "graphic object."
If you choose to display the date and time, these items appear at the lower-left corner by default.
The footer, another optional element, appears by default at the bottom of the slide, in the middle.
Finally, you can choose to display a slide number; its default position is in the lower-right corner.
Most presentations begin with a title slide, which typically includes the title of the presentation, the speaker's name, and other introductory details. If you're planning a presentation as a class project, you might include the class name and number Sociology 101, for instance; for a presentation to a business or civic group, you might include your name and the name of the organization you represent. Other slides in a presentation can also be title slides you might use a title slide to introduce different portions of a long presentation, for example but in most cases, you'll have just one title slide in a presentation, and it will serve as the first slide.
Don't be confused by the terminology. A title slide is, in most cases, a slide that introduces a presentation. A slide title, on the other hand, is usually the first line on a slide.

- Skip to main content
- Skip to primary sidebar
Business Jargons
A Business Encyclopedia
Presentation
Definition : A presentation is a form of communication in which the speaker conveys information to the audience. In an organization presentations are used in various scenarios like talking to a group, addressing a meeting, demonstrating or introducing a new product, or briefing a team. It involves presenting a particular subject or issue or new ideas/thoughts to a group of people.
It is considered as the most effective form of communication because of two main reasons:
- Use of non-verbal cues.
- Facilitates instant feedback.

Business Presentations are a tool to influence people toward an intended thought or action.
Parts of Presentation

- Introduction : It is meant to make the listeners ready to receive the message and draw their interest. For that, the speaker can narrate some story or a humorous piece of joke, an interesting fact, a question, stating a problem, and so forth. They can also use some surprising statistics.
- Body : It is the essence of the presentation. It requires the sequencing of facts in a logical order. This is the part where the speaker explains the topic and relevant information. It has to be critically arranged, as the audience must be able to grasp what the speaker presents.
- Conclusion : It needs to be short and precise. It should sum up or outline the key points that you have presented. It could also contain what the audience should have gained out of the presentation.
Purpose of Presentation
- To inform : Organizations can use presentations to inform the audience about new schemes, products or proposals. The aim is to inform the new entrant about the policies and procedures of the organization.
- To persuade : Presentations are also given to persuade the audience to take the intended action.
- To build goodwill : They can also help in building a good reputation
Factors Affecting Presentation

Audience Analysis
Communication environment, personal appearance, use of visuals, opening and closing presentation, organization of presentation, language and words, voice quality, body language, answering questions, a word from business jargons.
Presentation is a mode of conveying information to a selected group of people live. An ideal presentation is one that identifies and matches the needs, interests and understanding level of the audience. It also represents the facts, and figures in the form of tables, charts, and graphs and uses multiple colours.
Related terms:
- Verbal Communication
- Visual Communication
- Non-Verbal Communication
- Communication
- 7 C’s of Communication
Reader Interactions
Abbas khan says
October 2, 2022 at 11:33 pm
Thank you so much for providing us with brief info related to the presentation.
Farhan says
February 23, 2023 at 9:45 am
yusra shah says
July 3, 2023 at 2:04 am
it was helpful👍
Leave a Reply Cancel reply
Your email address will not be published. Required fields are marked *

What is a Governmental Component Unit?
Jan 9, 2019.
A governmental component unit is a legally separate organization for which the elected officials of the primary government are financially accountable. In addition, component units can be other organizations for which the nature and significance of their relationship with a primary government are such that exclusion would cause the reporting entity’s financial statements to be misleading due to close relations and financial integration with the primary government.
When Does a Government Have Financial Accountability for An Organization?
Typically when the answer to these three questions below is “yes.”
- Are the economic resources received or held by the separate organization entirely or almost entirely for the direct benefit of the primary government, its component units or its constituents?
- Is the primary government or its component units entitled to, or have the ability to otherwise access, a majority of the economic resources received or held by the separate organization?
- Are the economic resources received or held by an individual organization that the specific primary government is entitled to, or has the ability to otherwise access, significant to that primary government?
Ultimately, it is up to the professional judgment of the primary government’s management to ultimately determine what entities should be included as component units. Most often, governmental component units are typically entities or nonprofits whose purpose is to benefit a government by soliciting contributions and managing those funds. Examples of governmental component units include:
- Utility companies (water, electricity, wastewater, etc.)
- Foundations
- Charter schools
- Alumni associations
- Housing authorities
- Not-for-profit corporations
Depending on the relationship to the government, a government’s component units are presented one of two ways: blended or discretely presented. A blended component unit’s financial information is reported within the government’s financial statements (as if it were part of the government), and a discretely presented component unit’s financial information is reported in a separate column in the government’s government-wide financial statements.
Let CRI Help You Assess Your Accountability for Any Governmental Component Units
Do you need assistance determining what, if any, governmental component units may be your entity’s financial responsibility? If so, then please contact your CRI advisor.
Relevant insights
Five tips for an outstanding md&a.

Discover the Market Value of Your Business

Maximizing Estate and Gift Tax Strategies

Maximize Business Value with Solid Succession Planning

The Basics of Spousal Lifetime Access Trusts

Domain II – Ethics and Professionalism – An Ethics Update for...

Checklist: 8 Steps to Achieve Highly Productive Board Meetings

How to Develop a Cyberattack Recovery Plan

IRS Employee Tax Forms: A Checklist for Small Businesses

Natural Disasters Can Affect Your Financial Statement, Too

Tax Strategies for Special Needs Families

New IRS and Treasury Guidance Targets Basis Shifting Transactions in Partnerships

What Role Does Life Insurance Play in Estate Planning?

Employee Retention Credits: They Aren’t Dead for 2021 Yet!

Start From the T.O.P Down: Ways You Can Improve Your Organization’s...

U.S. Federal Tax Matters for Foreign Nationals

Deadline Approaching: All QuickBooks Desktop Required to Upgrade to Subscription Model...
Federal tax credits and deductions for family caregivers.

Act Now Before the TCJA Estate and Gift Tax Exclusion Sunsets

Easy Estate Planning Tips for Everyone

Understanding the Nuances: Traditional Non-Profits vs. Private Foundations

Excise Tax for Non-Profit Leaders: Understanding Penalties & Compliance

Succession Planning for Contractors: Necessary Strategies for a Smooth Transition

Crafting a Strategic and Compliant Grantmaking Plan for Private Foundations

FTC Issues Ban on Noncompete Clauses

S5:E3 – Local Government Opioid Settlement Accounting

Tax Planning and Compliance for Managing a Foundation

A Deep Dive into GASB Statement 103’s Financial Reporting Model Improvements

3 Governance Policies Every Business Should Have in Writing

Make Better Business Decisions with Financial Modeling

S5:E2 – Municipal Bond Underwriting: What’s It All About?
The essential role of cost reporting in hospital financial management and....

Tennessee Assembly Passes Bill to Eliminate Franchise Tax Property Base

The Impact of an ESG Policy: How to Get Started

Strategic Financial Planning for Small Businesses in 2024

Harvesting Value: The Role of Bonus Depreciation in Enhancing Agricultural Investments

BSA/AML Model Validation: Understanding Expectations and Balancing Reality

At Long Last, GASB Approves Financial Reporting Model Improvements

To Lobby or Not to Lobby: Understanding Your Association’s Rights

Taxable Advertising or Nontaxable Sponsorship?

After the Standards: A Guide to Everything Else in a GASB...

Enhance Your Technology Tool Kit for Improved Productivity

Essential Governance Policies for Effective Associations

Avoid the Shock of a Surprise Tax Bill

It Figures Podcast: S5:E1 – CECL Lessons Learned and Opportunities Ahead
What is internal audit and can it benefit your organization.

Don’t Jeopardize Your S Corporation Status

The Critical Role of SOC Reports in Nonprofit Operations

GASB Pronouncement Effective Dates: Post-GASB 95 Revisions

Treasury Urges Congress to Settle 831(b) Captives Issue

Federal Deposit Insurance Corporation Improvement Act (FDICIA) Requirements

Understanding the New Employee vs. Independent Contractor Classifications

Global Internal Audit Standards Resource

Inheritance Unplanned: The Unexpected Impact of Taxes on Families

How Should School Districts Report Charter Schools?

Resource: Identifying and Reporting Charter Schools as Component Units

Are Charter Schools Component Units?

IRS Continues Pursuit of 831(b) Micro-captives in Tax Court Wins

Governmental Accounting & Auditing Omnibus
The Importance of Diversifying Your Customer Base

Discovering Your Business’ Value

Are Your Social Security Benefits Subject to IRS Taxation?

From Red Carpets to Tax Returns: The Versatile Roles of Accounting...

Pooled Income Funds Benefit Both Donor and Charity

Understanding the Implications of the House Committee’s Tax-Exempt Review

Introduction to the Global Internal Audit Standards

How Have Fraud Risks Changed?

5 Things to Remember About Substantiating Charitable Donations

Stay Vigilant to Reduce the Risk of Occupational Fraud

Crafting an Effective Nonprofit Document Retention Strategy

Ensuring Financial Integrity in Church Operations

Nine Questions About GASB Statement 102 on Risk Disclosures

State Tax Considerations for Insurance Companies

How to Be Prepared With a Business Continuity Plan

Real-Time Results: How Dashboards Can Help You Move Your Small Business...

Demystifying Deferrals: Illuminating the Intricacies of State and Local Government Accounting...

Key Discount Factors for 2023 Unpaid Losses in Insurance Companies

Fundamentals of Business Valuation: The Income Approach

Fundamentals of Business Valuation: The Market Approach

Optimizing Tax Benefits in Multi-Family Properties with Cost Segregation

Fundamentals of Business Valuation: The Asset Approach

2024 Cost of Living Adjustments Resource

IRS Issues Standard Mileage Rates for 2024

Loan Modifications Quick Reference Guide

Beneficial Ownership Reporting FAQs

New Beneficial Ownership Reporting Rules for Small Business

More Tips for Translating GASB Standards into English

Recent IRS Update: Postponement of Form 1099-K Reporting Threshold

Don’t Get Ready for Fiscal Year-End. Stay Ready.

Why Should You Consider a Sample Credit Card Agreement?

Key Insights for Employers on the Employee Retention Credit

Adapting to the IRS’s Electronic Filing Requirements

Help Your Business Finish Strong with These 10 Year-End Tasks

Faithful Finances: Crafting Credit Card Policies for Religious Organizations

Understanding the Hospitality Industry Audit Process

Unlocking the Value of Your Business, Part II: Post-Sale Considerations

Unlocking the Value of Your Business, Part I: Pre-Sale Considerations
5 savvy black friday shopping tips to put in your bag.

EV Tax Credit Eligibility Flow Chart

Energy Tax Credits Table

QBI Deduction Flow Chart

Tax Implications of Debt and Equity Financing

Ensuring Franchise Success through CPA Expertise

Tax Alert: IRS Releases 2024 Inflation Adjustment
Financial institutions – year-end accounting and risk management update.

How Does Industry Affect Fraud Risk?

You, Too, Can Set Accounting Standards

Networking for a Cause: Utilizing LinkedIn for Nonprofit Success

Cost-Effective Fraud Protection

AR-C Section 70: When It’s Relevant and How to Apply It

The Role of Maquiladoras in Mexico and Global Manufacturing

Deferrals Study Guide

Understanding the New FASB Tax Disclosure Requirements

An SMB Leader’s Guide to Fraud Prevention

Balancing Faith and Finance: A Guide to Budgeting and Cash Management

Digital Privacy and the GDPR: Why You Should Pay Attention Now

Exploring the Benefits of Ministerial Compensation

Have You Completed These 5 Year-End Financial Planning Tasks?

The Pitfalls of Underbidding Projects

Strategies to Manage College Expenses for Multiple Children

Back to Square One: Six Questions About GASB’s Financial Reporting Model...

Security Implications of a Remote Work Environment

2023 Year-End Tax Planning for Individuals & Families: Strategize, Optimize, Maximize

2023 Year-End Tax Planning for Businesses: Strategize, Optimize, Maximize

The Evolving Landscape of Cryptocurrency Taxation

Step by Step: Stay Resilient with a Crisis Planning Checklist

IRS Alert: Update on ERC Claims
Understanding 1031 exchange transactions: a strategic move for savvy investors.

Demystifying Deferrals: Technical Requirements & Resources

Demystifying Deferrals: Discussion Questions and Exercises

Unraveling Transfer Pricing Rules in Mexico

Contractors Can Remain Profitable in a Down Market

Florida Nursing Home Audit Requirements

Financial Resilience in the Face of Disasters for Older Adults

2023 GASB Update

Returning to Student Loan Payments: Ensuring Financial and Tax Compliance

Cybercrime and Religious Institutions: A Wake-Up Call for the Faithful

Five Steps to Elevate Self Pay Patient Collections in Medical Practices

5 Exercises to Rehabilitate Retirement Funds

Financial Impact of the Affordable Connectivity Program

Decoding Unrelated Business Income Tax

The Roadmap to a Successful Sale: Understanding the Phases of Selling...

With a Little Help From the GASB: Implementation Guides

Demystifying Deferrals: What They Are, What They Mean, and Why They...

Start Now to Comply with New Medicare Cost Report Rules

How to Properly Organize Your Tax Records

Form 990 Marketing: Spotlight Your Nonprofit’s Efforts and Achievements

Embedded Leases and Their Impact on Non-Profits

IRS Proposed Regulations on Micro-Captive Transactions

Deferrals from the Perspective of the User of Government Financial Statements

The Fine Line Between Nonprofit Lobbying and Advocacy

The Evolution of Healthcare Finance, Post-Pandemic

It Figures Podcast: S4:E19 – The Financial Data Transparency Act

Has Your Partnership or S Corporation Met the August 15 Notice...
Differentiating between independent contractors and employees.

Transmittal 18: Critical Changes and Best Practices for Cost Reporting in...

New Rule for Catch-Up Contributions

It Figures Podcast: S4:E18 – Out with TDRs and in with...
After the transaction: look here to unlock value in post-merger integration.

Building Your Ideal Captive Board

It Figures Podcast: S4:E17 – Medical Staffing Crisis
Drafting a business continuity plan (bcp).

New Businesses Face Challenges When Proving Damages Based on Lost Profits

Beyond Compliance: Prioritizing Donor Data Privacy in the Non-Profit Sector

Planning for Possible Workforce Reductions

It Figures Podcast: S4:E16 – What Talent Really Wants
Tax implications of moving abroad.

Tax Concerns for Self-Employed Individuals

It Figures Podcast: S4:E15 – Current Trends in Mergers and Acquisitions
Deferred outflows and deferred inflows of resources in a nutshell.

Contractors Need To Juice Up Working Capital in Volatile Times

Checklist: Managing Your Loved One’s Estate

It Figures Podcast: S4:E14 – Demystifying Deferrals
Liquidity risk for community banks.

Litigation Support: Hire Forensic Accountants Earlier to Build a Stronger Case

How Secure Is Your Company Retirement Plan: Updates and New Rules...

Surviving Small Business Failure and Preparing for Future Success

Navigating Regulations in Government-Funded Projects

Introduction to the Global Internal Audit Standards 2023

Adapting to the New IRS Electronic Filing Requirement for Businesses

Six Common Nonprofit IRS Audit Triggers

Glossary of Accounting Terms

Using GASB Standards to Account for Opioid Settlements

Accounting 101: Debit and Credits

Liquidity Risk for Community Banks – Focusing on Fundamentals

It Figures Podcast: S4:E13 – Successful Transfer and Succession
It figures podcast: s4:e12 – credit risk management in a potential..., standing in the way of construction fraud.

A Quality of Earnings Report Offers Key Insights for Parties Considering...

Navigating the Challenges of Global Supply Chain Disruptions

How to Reduce Your Hospital’s Compliance Risk with a Payroll Plan

It Figures Podcast: S4:E11 – Labor Market Changes and Effects
Gars: what it is and why you should be using it.

Sustainable Cost Management Strategies for Non-profits in Today’s Economic Challenges

It Figures Podcast: S4:E10 – A Guide to Employee and Workforce...
The importance of conducting a valuation of your small business.

ORSA Requirements Help Insure a Comprehensive Understanding of Risks and Solvency

Revenue Recognition Implementation for Common Interest Realty Associations

Tribal Governments: Creating a Culture of Fraud Prevention

It Figures Podcast: S4:E9 – FDICIA Transition for Community Banks
Nonprofit & governmental healthcare entities: be prepared to justify executive pay.

Why Filing a Tax Extension Can Be a Smart Move

How a Potential Non-Compete Clause Ban Stands to Impact Employers

It Figures Podcast: S4:E8 – The Who, What, Where, and Why...
Demystifying deferrals.

What You Need to Know About the Mississippi Pass-Through-Entity Election

Business Interruption: Planning Your Next Steps and Setting Expectations

It Figures Podcast: S4:E7 – Cost Segregation and Other Engineered Tax...
How does subscription term differ from maximum possible term.

It Figures Podcast: S4:E6 – The Ins and Outs of Airbnb...

Inflation Is Redefining Private Equity’s Perception of Value

Tax Preparers: The Hero Your Company Needs!

Spring Cleaning Now Improves Business Performance All Year

It Figures Podcast: S4:E5 – SECURE 2.0 & The Impact of...

Implementing the New Leasing Standards for Contractor Financial Statements

CMS is Serious About Hospital Price Transparency

The Global Internal Audit Standards Are Coming; Is Your Organization Ready?

It Figures Podcast: S4:E4 – The Art and Science of a...
What does the end of the public health emergency mean.

It Figures Podcast: S4:E3 SECURE 2.0 & The Impact on Individual...
It figures podcast: s4:e2 – florida’s new condominium safety law, what is an audit.

Gig Workers: What’s Up with Form 1099-K?

How to Avoid Mistakes in ESOP Valuations

Government Accounting Resources

K-2 – K-3 Exception Disclosure Comparison Chart

It Figures Podcast: S4:E1 – Adding Value To Your Internal Audit
Four tips for translating gasb standards into english.

What Does the Consolidated Appropriations Act of 2022 Mean for Me?

Avoiding Improper Employee Retention Credit Claims

What To Consider When Creating a For-Profit Subsidiary

3 Reasons to Differentiate Between Controllable and Non-Controllable Costs

The New Lease Accounting Standard Is Here — Is Your Healthcare...

Spotlight on Controls and Internal Audit Departments

Did You Know…? A Guide to Governmental Accounting and Auditing Resources

The Importance of an Effective System of Internal Control

Building an Effective Nonprofit Audit Committee

2022 Partnership Instructions for Schedules K-2 and K-3

Lease Term vs. Maximum Possible Term

Nonprofit Considerations When Creating a Chart of Accounts

How the SEC Bridges the Divide between GAAP and Non-GAAP Financial...

Top 1099 Tips for Law Firms

The Ins and Outs of Physician Compensation Models

Business Entity Comparison

GASB Statement 94: Decoding P3s, SCAs, and APAs

Do You Qualify for the Home Gain Sale Exclusion?

Bonus Depreciation or Section 179: What’s The Right Choice for You?

Everyday Tax Return Items That Can Trigger an Audit

Getting From Here To There: New GASB Language for Effective Dates...

What Is The Roth IRA 5-Year Rule?

4 Benefits of a Government Audit Committee

Avoid These Tax Traps in Retirement

CRI Physician Services Planning for 2023

Financial Institutions Year-End Accounting & Auditing Update
Great news (potentially) for 2022 partnership tax return filings.

GASB Statement 100: Clarity for Accounting Changes and Error Corrections

ABLE Accounts: A valuable financial solution for people with disabilities

S1:E16 – When You Suspect Fraud: The Story of the Million...

Hop on the Omnibus: GASB Statement 99

Escalation Clause: Protect Your Bottom Line

Cost Segregation Studies: Opportunities for Contractors

Nursing Home Financial Reporting Bill in FL

Top Reasons Not to Hire a Full-Time CFO

It Figures Podcast: S3:E13 – An Inside Look at The GASB
Infrastructure bill 101.

All GASB Statements Are Not Created Equal

IRS Extends Federal Tax Filing Deadline for Hurricane Ian Victims in...
2022 year-end tax planning for businesses.

2022 Year-End Tax Planning for Individuals & Families

The Infrastructure Investment and Jobs Act: Why to Expect a Marathon,...

Five Things to Know About the New Accounting For Paid Leave

Communicating with Your CPA: A How-To Guide

Understanding Your Accountant’s Language

It Figures Podcast: S3:E12 – Lease Accounting is for EVERYONE
Protecting your company against executive impersonation fraud.

How to Implement Internal Controls in Small to Medium-Sized Nonprofits

It Figures Podcast: S3:E11 – CentraLease | GASB & FASB Lease...
Should your hitrust csf assessor be a cpa firm.

The 411 on Student Loan Forgiveness
Gasb update.

CRI CECL Validation Services

Discount Rate Calculations for Lease Accounting

Key Takeaways From the Inflation Reduction Act of 2022

Taking Advantage of the Tax-Efficient Exit Strategy ESOPs Offer

Hunger Relief Efforts Can Yield Tax Benefit for Farmers

How Can Home Sellers Exclude Capital Gains Tax?

It Figures Podcast: S3:E10 – Balancing Acts: Managing Personal & Professional...
Sbitas: it’s time to boot up .

Understanding the Benefits of Engaging in a NIST CSF Assessment

Are Your Notes Turning Into Zombies?

Changes Reporting Gifts-in-Kind

The Arm’s Length Principle: The Rays of Transfer Pricing Adjustments

It Figures Podcast: S3:E9 – Shape Your Future: Internships
It figures podcast: s3:e8 – understanding inclusion & diversity in the..., retirement on the horizon make tax planning a priority.

R&D Tax Credit Offers Tax Savings for the Cannabis Industry

Is It Time for a Reserve Analysis for Your Community Association?

In the Know: Pass Through Entity Tax (Georgia House Bill 149)

How to Use Real-Time Financial Data to Improve Your Cash Flow...

It’s Too Early for CECL Fatigue

Crypto Quick Reference Guide

Keeping the Business in Family Business

A High-Yield Investment Class: Novice to Proficient

Increase Your Chances of an Efficient Financial Statement Audit

Employee Versus Contractor: A Crucial Distinction for Every Organization

Bolster Cash Flow With a Cost Segregation Lookback Study

Cryptocurrency Fundamentals for Financial Institutions

Is Your Rental Real Estate a Business?

Solving the Hardship Withdrawal Program Administration Puzzle

Local Governments & The Final Rule: Coronavirus State and Local Fiscal...

It Figures Podcast: S3:E7 – The Transaction Timeline: The 5 Stages...
What is section 1071, and why is it important for your....

5 Tips for Lessening Stress with Nonprofit Audit Preparation

Knowing When to Claim Social Security

Coronavirus State and Local Fiscal Recovery Funds

Manufacturing Inventory Accuracy Counts

3 Benefits of Creating a Captive Insurance Company

It Figures Podcast: S3:E6 – Common ACFR Errors
Protect what matters: estate planning in uncertain times.

A Comparison of Education Tax Credits for 2023

Is it Time for a Business Valuation?

Give Your Small Business a Jolt of Efficiency with Cloud-Based Accounting

It Figures Podcast: S3:E5 – Heads up, Grant Professionals!
How has covid-19 affected business valuations.

Boost Your Bottom Line by Understanding Your Internal Audit

Reporting Computer-Security Incidents: Is your Community Bank ready?

What Does a Cash Balance Plan Mean for You?

The Name’s Bond, Government Bond

Setting Nonprofit Executive Compensation

Promises to Give: Not-for-Profit Accounting Primer

Does Working Remotely During the Pandemic Mean You Owe More Income...

Still Confused About Whether to Deduct That Business Meal?

New HITRUST Assessments Give Companies More Options for Security Reporting

ICBA Live 2022 Conference Recap

You Could Owe “Nanny Taxes” Even If You Don’t Have Kids

Nonprofit Board Review of Form 990

Managing ESG Risks in the Oil and Gas Industry

Charitable Lead Trust vs. Charitable Remainder Trust: A Comparison

It Figures Podcast: S3:E4 – SSAE No. 21 | Direct Examination...
Going concern issues for nonprofits.

Improve Medical Practice Productivity with Non-Physician Providers

Five Internal Controls to Prevent Fraud in Nonprofits

Safeguard Your Assets During a Divorce — Before You Get Married

Differences in Public Charities and Private Foundations

It Figures Podcast: S3:E3 – Panic! At the IRS Disco
Top 5 accounting questions to ask your cpa.

Report Fundraising Events on Form 990

3 Grant Writing Tips to Help Not-For-Profit Organizations

Health Savings Accounts Offer Big Tax Benefits Now and in Retirement

Short on Cash? Gift-in-Kind Donations Can Also Help Support Charities

Estate Planning FAQ

Transfer Your Wealth Using a Dynasty Trust

Two Types of Charitable Trusts You Should Know About

New Guidance on Gifts In-Kind for Non-Profit Entities

It Figures Podcast: S3:E2 – Count Yourself in to a Career...
Captive insurance taxation.

Top 5 Priorities for Small and Mid-Sized Organizations in 2022

A Look at Internal Controls and Processes for Evaluating Vendors

Getting the Most Out of Your Remote Audit

Moving to a New State? Don’t Make These Tax Mistakes

Coronavirus Relief Funds – Getting Ready for Your Single Audit

Does Your Organization Need an Internal Audit?

What a Single Audit Means for Your Organization

Straddling the Fence: Should You Co-Source or Outsource Your Internal Audit?

COVID-19 Funding Best Practices, Accounting Treatment, and Single Audit Implications
Cybersecurity trend to watch in 2021: cyber supply chain risk.

Outsourced Accounting Reference Guide: How Collaborating Can Help You Reach Your...

Fiduciary Matters: How to Be the Best Trustee for Your Organization’s...

It’s a Marathon, Not a Sprint: Going the Distance for Outsourced...

2021 Year-End Tax Planning for Businesses: Strategize, Optimize, Maximize

2021 Year-End Tax Planning for Individuals & Families: Strategize, Optimize, Maximize
Conference recap – aicpa 2021 national conference on banks and savings....

CECL: It’s Getting WARM in Here Webinar

It Figures Podcast: S2:E17 – Beers, Beets, Governmental Accounting
Credit memorandum best practices and “the 5 c’s”.

It Figures Podcast: S2:E16 – Just You, Me, & the ERC.
Keeper of the vault: a business owner’s guide to cybersecurity.

Federal American Rescue Plan Act of 2021 (ARPA)

COVID-19 Quick Hits: American Rescue Plan Act Overview

It Figures Podcast: S2:E15 – Insurance Compliance and Regulatory Examination Process...
Risky business: comparing risk levels of mrbs.

Employee Retention Credit Information Sheet

IRS Income Tax Forms: A Checklist for Small Businesses
Digital transformation starts with process, not technology.

What’s New from GASB: An Update on the Latest Standards
Homeowner assistance fund – what tribes and applicants need to know, cecl: it’s getting warm in here.

Homeowner Assistance Fund – You Don’t Know the HAF of it!
Questions about the employee retention credit we’ve got answers., american rescue plan for governments: the resources available, potential proposals on the horizon: it’s time to prepare your estate....

Anti-Money Laundering (AML) and Cannabis Banking: Is Your Financial Institution Ready?

It’s a Marathon, Not a Sprint: Going the Distance for Outsourced...
Strategic use of arp government funds for long-term success.

IRS Notice Provides Guidance to Employee Retention Credit and the Paycheck...
Time to pivot how your cpa can help you adapt to....

Compliance Management System (CMS) – A Refresher

The Basics of Grantor Retained Annuity Trusts

Tax Considerations for Buyers Contemplating Mergers & Acquisitions

Taking a Fresh Look at Bankruptcy

When E-Commerce Sellers Would Benefit from Hiring an Accountant

IRS Clarifies Temporary 100% Deduction for Restaurant-Purchased Meals
Hired any recently unemployed workers let them know about new exclusion..., strategic decision making: are you taking advantage of the newly expanded..., rate reform – why is libor going away, and what will....

Clear Vision: Moving Your Business Forward with Confidence

Five Overlooked Tax Breaks for Contractors and Manufacturers

How Contractors Can Bridge the Age Gap

Why Profits Do Not Always Lead to a Positive Cash Flow...

IRS Provides Guidance on Cafeteria Plan Balance Carryovers

Updates to the AICPA’s SAS No. 134 through SAS No. 140

SSAE No. 21 – Direct Examination Engagements

Not-For-Profit Revenue Recognition

Now or Later? Weighing 15-year Depreciation vs. 100% Bonus Depreciation for...

How to Spot Three Common Tax Scams

Insurance Companies and the IRS: What’s on the Horizon?

The Anti-Money Laundering Act of 2020: An Overview

Federal Audit Clearinghouse Extended Submission Dates FAQs

When Can You Deduct Data Breach Costs?

Boost Your Cash Flow with Net Operating Loss Carrybacks

What’s Next for Hemp-Related Businesses?

Should You Convert Traditional IRA to Roth? Think Twice.

Making Intrafamily Loans with Intentionally Defective Grantor Trusts

The IRA: A Solid Estate Planning Tool in Times of Uncertainty

How MaaS Is Revolutionizing Manufacturing

Export Tax Incentives for Manufacturers

Meals & Entertainment

Credit Risk Management in an Unpredictable Environment

Insurance Companies and the IRS: A Downward Trend in Examinations

Exempt Organizations: IRS Issues Final Rules on 21% Excise Tax on...
Coloring inside the lines of nonprofit governance.

How Does Your Industry Affect Your Cybersecurity Risk?

USDA Issues Final Rules on Hemp Production

Not-So-Safe Harbor? Navigating the QBI Rules for Rental Real Estate Businesses

Disasters Never Rest, Take Time to Plan for Recovery

Yes, Operational Planning Is Still Important

Does Your Home Office Qualify for a Tax Deduction?

Shutting Down a Business? Updated Resources Available from IRS

Lending Money to Family? Be Sure to Stay on the Right...

Updates to the Long-Anticipated Compliance Supplement Addendum
Preparing for third-party payer audits.

Five Ways to Make Invoice Processing More Effective

Is It Time for Cloud Accounting?

Watching the Horizon: Do You Have the Data You Need to...

Key Factors that Drive Reimbursement in the PDPM Model

What’s Behind the Hype About Donor-Advised Funds?

Businesses Face Challenges When Expanding Their Remote Workforce

Helpful Tips for Completing Medicare Cost Reports

Technology Innovations Impacting the Insurance Industry

10 Anti-Fraud Recommendations for Community Associations

Don’t Sleep on CECL

Social Engineering Attacks: Considerations for SMBs

Smarter Giving: Four Things to Know When Considering Charitable Contributions

How Important is Compliance with Government Regulations to a Firm’s Accounting...

Contractors Should Take A Closer Look at Site-Level Profitability

Assembling an Effective Financial Team

PRF Requirements Summary
Prepare, recover, emerge stronger: a roadmap for financial perseverance in times....

CARES Act and Provider Relief Fund Single Audit
Back to profitability: how small businesses can emerge stronger from crisis.

Virtual Meetings: Tips for Choosing the Right Technology and Conducting a...

Calculating Your Business Interruption Loss
Maintaining financial controls in a disrupted, remote-work environment, how to increase your chances of a successful financial statement audit.

Healthcare Organizations: Are You Ready for New Revenue Recognition Rules?

Business Interruption Losses: Making an Insurance Claim

Cybersecurity Tips for Working From Home

Understanding the Basics of Business Interruption Claims

Stabilizing Your Business: Improvise, Adapt, Overcome

Government Entities: Plan, Protect, Adapt, Overcome

Make the Most Out of Your P&L

How to Arrange a Medical Practice Buy-Sell Agreement that Minimizes Disputes

Is a Captive Right for Your Organization?

Forensic Audits vs. Annual Audits: Taking a Proactive Approach to Protecting...

Automated Bank Reconciliation: An Instant Analysis for Your Business

5 Reasons Business Owners Prefer Outsourced Accounting

Unique Compliance Aspects of Risk Retention Groups

Improve Manufacturing Company Profitability

What’s Your Company’s Cash Flow?

Record Retention Schedule

Preparing for a Single Audit: Understanding the Requirements

A Grant Overview

Understanding Your Responsibilities Within Service Organizations

When Does a Hobby Become a Business?

Make Digital Assets Part of Your Estate Plan

What You Need to Know About the Home Office Deduction

Keeping a Close Eye on Medicare Fraud

Privacy Policies and Data Security Keep Contributions Flowing for Not-for-Profit Organizations

8 Action Steps for Avoiding Nonprofit Online Presence Tax Traps

Impressing Donors with Nonprofit Financial Information

Two Types of Government Termination Benefits

The Growing Threat of Cyberattacks in Manufacturing and How to Prevent...

Is Your Manufacturing Business Ready for the New Revenue Recognition Standard?

A Blueprint for Nonprofit Revenue Recognition Implementation

Qualified Opportunity Zones: A Resource Guide

Living in a Post-Wayfair World

Citizen Centric Governmental Reporting

Municipal Bond Arbitrage, Billy Ray Valentine, and What They Have in...

Disaster Recovery: Protect Your Assets With the Right Insurance

Don’t Let These 7 Tax Terms Scare You

Three Actions to Help Improve Your Collections Process

Acknowledgments of Nonprofit Donations

UPMIFA – That’s Not a Text

Balance Sheet Reconciliations: Focus on Internal Controls

Charitable Donation Documentation: 6 Answers to Know

Closing a Nonprofit Organization

For Strong Data Security, Give Your Employees Some Backup

Transfer Pricing and Not-For-Profits (UBIT)

Why Fair Value is Becoming a Popular “Celebrity” in the Accounting...

Bracing for Disaster? Prepare to Deduct Casualty Losses

Use a Governmental Performance Audit to See If You Measure Up

Risk Management: Avoiding Crisis & Staying Afloat

Using Internal Controls to Keep a Record of Your Inventory: Storing...

4 Things the IRS Looks for in a Federal Tax-Exempt Application
Using nonprofit financial statements for future planning.

Implementing Nonprofit ERM Strategies

3 Common Questions & Answers: Nonprofit Audit Committee

Love, Marriage, and Uncle Sam: How Getting Married Affects Your Taxes

7 Benefits of Outsourcing a Not-for-Profit Organization’s Essential Bookkeeping and Payroll...

How the Internet Mystifies the Taxability of Qualified Sponsorship Payments

Tax Planning Reasons to Potentially Establish a Private Foundation

Manufacturing Product Costing

Financial Statement Preparation: 4 Steps to Power Up Business Performance Tracking
What to Consider When Deciding Between a Calendar Year and a...

Best Practices for Nonprofit Volunteer Management

Captive Insurance Overview: Healthcare Provider Industry Highlights

Small Business Compliance: Are You Sticking to the Law?

Five Steps to Prepare a Disaster Plan for Your Business

Restructuring Organizations Through Tax-Free Business Splits

Taking a Bite Out of Payroll Taxes

How to Protect Yourself from Tax Identity Theft

Anti-Money Laundering (AML) Implications of Human Trafficking

How Manufacturers Should Account for Excess Capacity

3 Questions to Find the Balance of a Seasonal Product Cycle

Opportunity Zones: Open for Business

4 Steps on the Path to Timely Payments

Understanding the Management’s Discussion and Analysis (MD&A) Disclosure

The Evolution of the Bank Secrecy Act

Business Valuation Can Avoid a Merry-Go-Round During Divorce Proceedings

The Continued Importance of Risk Assessment for Financial Institutions

The Bank Secrecy Act/Anti-Money Laundering (BSA/AML) Audit Revisited

Opportunity Zones are Knocking: Should You Answer?

It’s Time to Review and Update Your Partnership Agreement

Using Internal Controls to Keep a Record of Your Inventory: Costing...

Clear Reliable Insights: GASB 87

How to Manage Supplier Costs and Keep Your Business Balanced

3 Ways Public Companies Can Iron Out SEC Audit Processes

Travel Guide for Your Start-Up’s Journey to Success

How to Become the Boss of Your Digital Assets

Steering Clear of Bookkeeper Liability Hazards

Four Must-Have Features When Selecting an Auditor

Will Your Cybersecurity Defense System Protect Your Organization?

“Yours, Mine, or Ours?”: Identifying and Valuing Marital Property

One Taxing Situation: South Dakota vs. Wayfair, Inc

IRS Correspondence Letter: Your New Pen Pal the IRS

Is Your Bank’s Audit Committee Reaching the Summit of their Potential?

Will Your Cost Segregation Methodology Hold Water With the IRS?

Understanding Terms Found in Common Business Interruption Policies

Business Interruption Claims Can Prevent the Unexpected

How the SEC Bridges the Divide Between GAAP and Non-GAAP Financial...

An Origin Story About Captives

Sail Smoothly Through Those Saving or Shredding Decisions

The Opportunities of Effective Risk Management

How the Pooling Method Can Help Bring Your Property Value to...

Why Strong Internal Controls Are Necessary for a Healthy Business

Avoid the Punch of Ransomware

4 Business Seasons When You Should Consider a Virtual CFO or...

Whaling Cyberattacks: What You Need to Know

How to Maximize Business Sale and Successfully Exit

4 Simple Solutions to Improve Financial Reporting Timeliness without Breaking the...

8 Steps for Cleaning Up a Tax Return Identity Theft Train...

Unearthing Occupational Fraud in Your Business

Life Insurance Tax Strategies: Maximizing this Multi-Use Tool

Watch for These 3 Signs of Employee Fraud

Join Our Conversation
Subscribe to our e-communications to receive the latest accounting and advisory news and updates impacting you and your business.
By proceeding, you are agreeing to the terms and conditions in the Carr, Riggs and Ingram LLC Privacy Policy .
- Charts and Graphs
Change Major and Minor Units of Value Axis in PowerPoint 2013 for Windows
Change major and minor units of the value axis in PowerPoint 2013 for Windows. We also explore other value axis options.
Author: Geetesh Bajaj
Product/Version: PowerPoint 2013 for Windows
OS: Microsoft Windows 7 and higher
Date Created: November 27, 2014 Last Updated: November 27, 2014
Learn PowerPoint
Learn how to turn off Animation Preview in PowerPoint.
While learning about chart axes , you will come across two terms, Major and Minor units. These are the intervals at which the axis spaces itself, as the name itself suggests, you can choose to space the axis at two levels: Major and Minor. Look at Figure 1 , below and you can see a chart that has both Major and Minor units displayed on the Value axis. All the units pointed with blue arrows are Major units, and green arrows display Minor units.

PowerPoint sets the Major and Minor units on its own, many times, this may be exactly what you need. At other times, you may want to set specific intervals for the Major and Minor units for several reasons. But before you do so, a word of caution, do remember that any of these changes can have three implications:
The values that you see placed on the value axis reflect the major units you choose. However, any changes you make to minor units do not influence the displayed values, since minor unit values are not displayed on the axis.
The tick marks you see again change depending upon the intervals you choose for both Major and Minor units, of course this depends upon whether you have opted to display tick marks or not. Refer to our Tick Marks on Chart Axes in PowerPoint 2013 tutorial to learn more.
The gridlines shown change as well, again the appearance of these gridlines will be influenced by whether you have made them visible or not.
The Major unit influences the difference between the two major tick marks on the value axis. Similarly, the minor unit influences the difference between the two minor tick marks on the value axis. By default these values are automatically decided by the Minimum and Maximum scale values on the value axis. Still, you can change them to suit your needs, as explained in this tutorial.
Changing Major Units of value axis
Follow these steps to change the Major units of the Value axis:
- To start with, you need a chart inserted on your slide, for this tutorial we have selected a Column chart, as shown in Figure 2 , below. As you can see, the default chart in PowerPoint 2013 for Windows shows only Primary Major Gridlines, and there are no Tick Marks .

- To see the effect of the change in Major and Minor units on your chart, turn on the major and minor tick arks on the vertical (value) axis, as shown highlighted in red within Figure 3 , below.
 Axis")
- Now, select the value axis of the chart, carefully right-click to access the contextual menu, as shown in Figure 4 , below. Within this contextual menu, choose the Format Axis option (refer to Figure 4 again). If you do not get the Format Axis option in the contextual menu, you may have right-clicked on another chart element, make sure you then deselect anything in the chart, and then right-click on the value axis.
 Axis is selected")
- Doing so opens the Format Axis Task Pane , as shown in Figure 5 , below. Make sure that the Axis Options button is selected as shown highlighted in red within Figure 5 . Note that Major unit option is set to Auto by default which is indicated by Auto option mentioned next to the Major value. Also note that Major value is set to 1.0 (highlighted in blue within Figure 5 ).

- Now, let us change the major unit value. Click within the box provided with the Major option, and then type a new major value, as shown highlighted in red within Figure 6 , below. We changed the value to 2 . This may change the Minor value too because it is still set to Auto option, as shown in Figure 6 . The Reset button that shows up next to the Major option can be clicked if you want to get back the automatic value ( Auto option).

- Now, you can see that the value axis' major unit values now show an interval of 2 points, as shown in Figure 7 . This makes the chart look cleaner and gives it more visual breathing space (compare Figures 3 and 7 ).

- Save your presentation.
Changing Minor Units of Value Axis
Follow these steps to change the minor units of the value axis:
- To change the minor unit, access the Format Axis Task Pane again (as explained in Steps 3 and 4 in the preceding section on this page).
- Make sure that the Axis Options button is selected as shown highlighted in red within Figure 8 , below.

- Notice that the default Minor unit value is set to 0.2 as shown highlighted in blue within Figure 8 , above. Now, click within the box provided with the Minor option, and then type a new minor value, as shown highlighted in red within Figure 9 , below. We changed the value to 0.5 .

- In Figure 10 , you can see that the value axis' minor unit values now show a difference of 0.5 points. Compare Figures 3 and 10 .

10 08 05 - Chart Axes: Change Major and Minor Units of Value Axis (Glossary Page)
Change Major and Minor Units of Value Axis in PowerPoint 2011 for Mac Change Major and Minor Units of Value Axis in PowerPoint 2010 for Windows Change Major and Minor Units of Value Axis in PowerPoint 2007 for Windows Change Major and Minor Units of Value Axis in PowerPoint 2003 and 2002 for Windows
You May Also Like: Visme: Conversation with Payman Taei | Banking PowerPoint Templates
Popular Posts

Polygon Center Circles for PowerPoint
These special circles have polygon centers: the centers are made of triangles, squares, pentagons, and hexagons! And based on the sides of the polygon, the rest of the circle has that many segments.
Download and use these Polygon Center Circles in your slides for just $4.99
Microsoft and the Office logo are trademarks or registered trademarks of Microsoft Corporation in the United States and/or other countries.
Home | PowerPoint | Photoshop | PowerPoint Templates | PowerPoint Tutorials | Blog | Notes | Ezine | Media Kit | Feedback | Site Map | About Us | Contact Us Link to Us | Privacy | Testimonials PowerPoint Backgrounds | Christian PowerPoint Backgrounds | Business PowerPoint Presentation Templates
Plagiarism will be detected by Copyscape
- Stack Overflow for Teams Where developers & technologists share private knowledge with coworkers
- Advertising & Talent Reach devs & technologists worldwide about your product, service or employer brand
- OverflowAI GenAI features for Teams
- OverflowAPI Train & fine-tune LLMs
- Labs The future of collective knowledge sharing
- About the company Visit the blog
Collectives™ on Stack Overflow
Find centralized, trusted content and collaborate around the technologies you use most.
Q&A for work
Connect and share knowledge within a single location that is structured and easy to search.
Get early access and see previews of new features.
What is the unit of measure for PowerPoint slides using VBA?
I am using VBA to paste charts/graphs from Access to PowerPoint. Once pasted, I am resizing them using VBA, but it does not allow me to use inches (even though when I do it manually through the shape Properties, the size values there are in inches).
My question is what unit of measure is the number I use in VBA? I assumed pixels and tried to convert using a 96 pixel per inch factor, but that wasn't just right. Now I'm curious about whether it's based on my screen resolution? I can quickly code it (through trial and error) to look good on my machine, but I worry then if somebody else runs it, and they have a different resolution, the slide will look different. (Note that the graphs are having to fit within other shapes.)
If it's not based on screen resolution, does anybody know the dimensions of a slide in whatever unit it's in?
- 3 Units in ppt VBA are Points (a point is about 1/72 of an inch) – Tim Williams Commented Jun 28, 2012 at 20:07
- 3 @TimWilliams: That is a valid answer :) Why not post it as an answer? – Siddharth Rout Commented Jun 28, 2012 at 20:13
3 Answers 3
Units in ppt VBA are Points (a point is about 1/72 of an inch)
Pardon the pedanticism, but an inch is exactly 72 points, at least as far as PowerPoint and pretty much any digital system is concerned.
Before computers took over, "about" did indeed apply. All the more so because there were several different "standard" definitions of the point.
http://en.wikipedia.org/wiki/Point_(typography)
AAMOF, at one ... er ... point, Microsoft redefined the cm (2.4 to the inch instead of 2.54) to suit its own purposes, leading to confusion when people in the metric climes precisely specified measurements in PowerPoint then found out that things didn't print at the expected size.
They fixed this in PPT 2002, but I'd be there are still files floating around that, when opened in current versions of the app, show odd page sizes.
On Windows, it's 96 pixels per inch .
On Mac, it's 72 pixels per inch .
Your Answer
Reminder: Answers generated by artificial intelligence tools are not allowed on Stack Overflow. Learn more
Sign up or log in
Post as a guest.
Required, but never shown
By clicking “Post Your Answer”, you agree to our terms of service and acknowledge you have read our privacy policy .
Not the answer you're looking for? Browse other questions tagged vba powerpoint or ask your own question .
- Featured on Meta
- We spent a sprint addressing your requests — here’s how it went
- Upcoming initiatives on Stack Overflow and across the Stack Exchange network...
- What makes a homepage useful for logged-in users
Hot Network Questions
- Why do "dual frequency" or low frequency switching regulators exist when higher frequency is better?
- Eliminate some numbers so that each of the three rows contains the numbers 1 through 9 each exactly once
- Any philosophical works that explicitly address the heat death of the Universe and its philosophical implications?
- Are the North Star and the moon ever visible in the night sky at the same time?
- Is it an option for the ls utility specified in POSIX.1-2017?
- Does there exist a nontrivial "good" set?
- Why is this outlet required to be installed on at least 10 meters of wire?
- Are there countries where only voters affected by a given policy get to vote on it?
- Car stalls when coming to a stop except when in neutral
- Histogram manipulation
- The meaning of "tarmac ticket"
- What scientifically plausible apocalypse scenario, if any, meets my criteria?
- Why do cubic equations always have at least one real root, and why was it needed to introduce complex numbers?
- Problem computing a limit
- Does 誰と mean 誰とも?
- A Ring of Cubes
- Where are quantised states in QFT?
- How will a planet on asteroid belt see Jupiter?
- Where do we go if we gain knowledge of the absolute truth?
- Did any other European leader praise China for its peace initiatives since the outbreak of the Ukraine war?
- Is it a security issue to expose PII on any publically accessible URL?
- Does the oven temperature for a lasagna really matter?
- Is this definitive conclusion of a blown head gasket?
- Implementation of Euler-Maruyama numerical solver
Basic unit of a PowerPoint presentation?

Handouts,Speaker's notes, outlines
The individual parts of a PowerPoint presentation are called slides.
Add your answer:
Top Categories
Microsoft PowerPoint MCQs
What is the basic unit of a powerpoint presentation.
Note: This Question is unanswered, help us to find answer for this one
Retake Quizzes to improve it
You inserted a photo and it is covering the words on a slide. How do you adjust it so that you can see the words?
What do end-users need to run your presentation?
The maximum number of Slide Masters for one slide show is:
To adjust the font size of a graph legend within Powerpoint:
The cycle category of SmartArt has the characteristic of:
Nitrifying bacteria convert _____ to _____
Using the____, you can choose the arrangement of placeholders on a new slide.
The major difference between hlookup and vlookup functions is the way the lookup tables are _____.
Once you have created a table, the ____ tab appears on the ribbon.
Powerpoint uses ____ to create numerical charts
IMAGES
VIDEO
COMMENTS
NCI concept code for potency units: C48470. SPL Acceptable Term. Code. Unified Code for Units of Measure (UCUM) AMPULE. C48473.
A unit of presentation is a qualitative concept that describes a countable entity in which the clinical drug is presented, or by which it is bounded. It is used to support expression of presentation strength, where it provides the denominator for the strength ratio, and to differentiate different clinical drug products when the "intimate ...
The symbols ppm, ppb, and ppt are used to escape this problem. They are best thought of as non-SI units for dimensionless quantities with the meanings 10 −6, 10 −9, and 10 −12 respectively. They are abbreviations for the words parts-per-million, parts-per-billion, and parts-per-trillion. These symbols have become commonplace in everyday ...
For special-purpose entities with business-type activities that use a single column f/s presentation, CU may be blended into the single column with PG if they meet the criteria for blending on slide 28.
For many people the thought of delivering a presentation is a daunting task and brings about a great deal of nerves. However, if you take some time to understand how effective presentations are structured and then apply this structure to your own presentation, you'll appear much more confident and relaxed.
The NCOPDS is an organizing framework aimed at developing the next generation of competent and committed NCOs of character as trusted Army professionals. These are Army professionals who thrive in chaos, adapt, and win in a complex world. Noncommissioned officers develop as leaders over time through deliberate, progressive, and sequential processes incorporating training, education, and ...
A strong presentation is so much more than information pasted onto a series of slides with fancy backgrounds. Whether you're pitching an idea, reporting market research, or sharing something ...
Microsoft PowerPoint is an American presentation program, [8] created by Robert Gaskins, Tom Rudkin and Dennis Austin [8] at a software company named Forethought, Inc. [8] It was released on April 20, 1987, [9] initially for Macintosh computers only. [8] Microsoft acquired PowerPoint for about $14 million three months after it appeared. [10] This was Microsoft's first significant acquisition ...
Here, click "Advanced." In the "General" tab, click the up or down arrow next to the "Measurement Units" box and, from the context menu that appears, select your desired measurement system. Finally, click "OK." The next time you open Microsoft PowerPoint, the measurement units will have changed to the selected measurement system.
During the official check presentation on July 10, President Johnson emphasized the importance of preparing students for the future, highlighting the University's commitment to advancing innovation and entrepreneurship and inviting other partners to join the effort.
KUALA LUMPUR: Hextar Capital Bhd's wholly-owned subsidiary T&J Engineering Sdn Bhd has secured a contract from landasan Kapital (M) Sdn Bhd valued at RM97.04mil to supply materials, labour, tools ...
Unit planning and unit test. The document discusses how teachers should plan and organize units of study for their subjects. It states that teachers must first understand the key topics, concepts, and objectives of each unit before creating a year-long plan. An effective unit plan includes analyzing the content, writing objectives, planning ...
A PowerPoint presentation is a great way to showcase all the contents of the lesson plan, however, the trick is to decide how you want to structure it.
This type of presentation range from very simple presentations with minimal audio-visual and multimedia integration to presentations that include elaborate audio-visual and multimedia integration.
The abbreviation for ppt (%) and ppm is salinity percentage and parts per million respectively. 1 ppt (%) is 10000 times bigger than a ppm. To measure, units of measurement are needed and converting such units is an important task as well. unitsconverters.com is an online conversion tool to convert all types of measurement units including ppt (%) to ppm conversion.
Chapter 1 History & Approaches.ppt. Chapter 2.75 Methods Statistics.ppt. Chapter 5 States of Consciousness.ppt. Chapter 2 Methods.ppt. Chapter 6 Learning.ppt. Chapter 3 Biological Bases of Behavior.ppt. Chapter 2.5 Methods Statistics.ppt. Chapter 4 Sensation & Perception.ppt. Chapter 7 Cognition.ppt.
The basic building block of a PowerPoint presentation is the slide a block of content the size of a computer screen that typically contains a title, some text, and perhaps a picture or chart. A PowerPoint presentation typically contains many slides.
Presentation is a mode of conveying information to a selected group of people live. An ideal presentation is one that identifies and matches the needs, interests and understanding level of the audience. It also represents the facts, and figures in the form of tables, charts, and graphs and uses multiple colours.
A governmental component unit is a legally separate organization for which the elected officials of the primary government are financially accountable. In addition, component units can be other organizations for which the nature and significance of their relationship with a primary government are such that exclusion would cause the reporting entity's financial statements to be misleading due ...
This presentation covers basics of cell structure and functions of different cell organelles in detail with interactive illustrations. I hope this presentation will be beneficial for instructor's as well as students.
Change major and minor units of the value axis in PowerPoint 2013 for Windows. We also explore other value axis options.
This presentation covers measurement of physical quantities, system of units, dimensional analysis & error analysis. I hope this PPT will be helpful for instructors ...
My question is what unit of measure is the number I use in VBA? I assumed pixels and tried to convert using a 96 pixel per inch factor, but that wasn't just right.
The individual parts of a PowerPoint presentation are called slides. Handouts,Speaker's notes, outlines
Unit plan. Aug 3, 2021 •. 9 likes • 20,470 views. B. BeulahJayarani. It discribes about what is unit plan, definition of unit plan, Characteristics of a Good Unit, Steps in Unit Planning - i. Content analysis, ii. Objectives and specifications, iii. Learning activities & iv.
What is the basic unit of a PowerPoint presentation? 1.object, 2.a slide, 3.presentation box, 4.task pane, 5.placeholder