- Reviews / Why join our community?
- For companies
- Frequently asked questions


User Experience (UX) Surveys: The Ultimate Guide
Imagine you're a business owner eager to improve your website's user experience. You want to know what's working, what's not, and where you need improvements. While you have various research methods (such as user interviews , usability tests, A/B testing , etc.) available, a user experience (UX) survey helps gather valuable insights and pinpoint the areas for enhancement.
UX surveys can offer actionable insights , presenting qualitative data that informs decisions.
- Transcript loading…
Through this piece, you'll learn everything about user experience surveys. From market research professionals and business owners to website developers, anyone aiming for customer satisfaction will find this helpful.
You'll learn about UX survey best practices and the right questions to help identify pain points and understand different question types.
What are UX Surveys?
UX Surveys, or User Experience Surveys, gather information about users' feelings, thoughts, and behaviors related to UX design , product, or service. These online surveys form a part of the broader field of usability surveys. They focus on understanding how users interact with a system, application, or website to create a user-centered design .
© Interaction Design Foundation, CC BY-SA 4.0
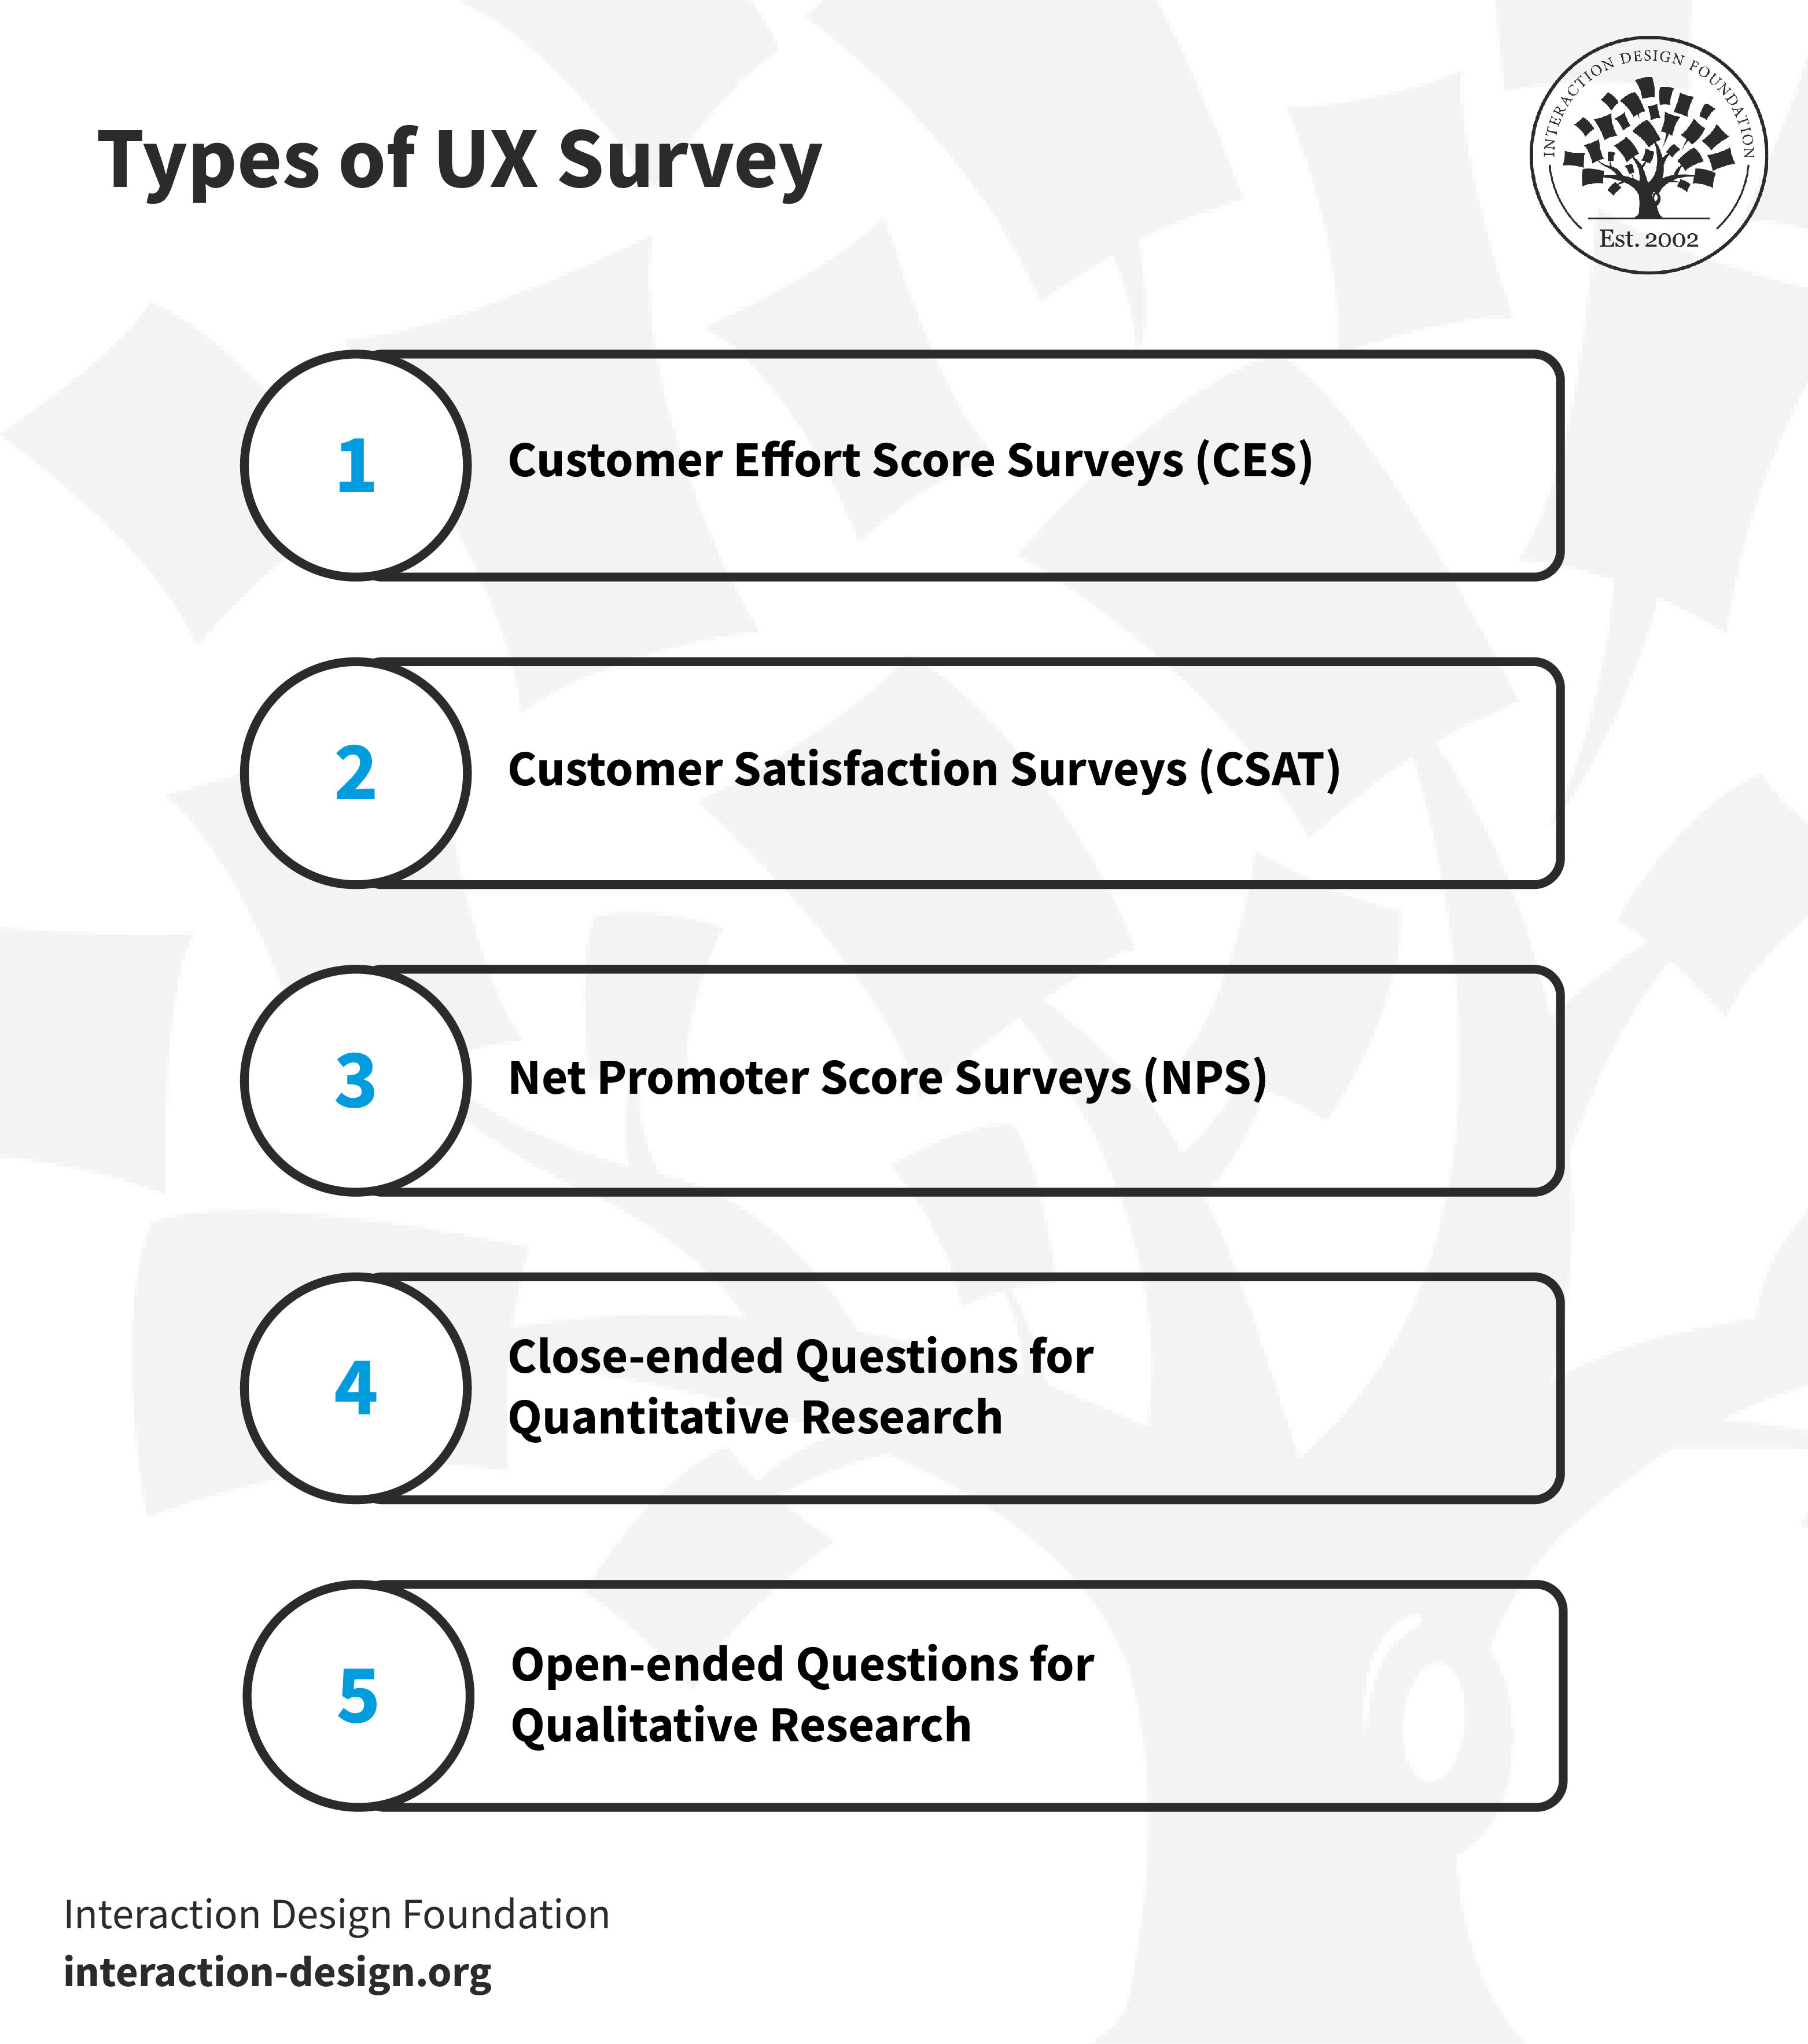
1. Customer Effort Score Surveys (CES)
CES surveys assess how simple it is for customers to complete tasks with your company. Think of it like this: It's a score that tells you if using your product or getting help from your service team was a breeze or a struggle for the customer.
Many people value quick, straightforward answers to their questions. Time is precious, so spending less effort resolving issues is better. Ease of experience can be more revealing than overall satisfaction. Experts now use the Customer Effort Score.
For instance, after a customer service interaction, the question could be:
"How easy was resolving your issue with our customer support?"
Very Difficult
This format helps companies understand the ease of interaction from the customer's viewpoint. It can be an excellent tool for identifying areas for improvement.
2. Customer Satisfaction Surveys (CSAT)
A CSAT survey measures how happy customers are with your company.
The main question is, "How satisfied are you with our service?"
Answers range from 1, meaning "very dissatisfied," to 5, indicating "very satisfied."
CSAT surveys focus on individual interactions, like purchasing or using customer support. They use numeric scales to track satisfaction levels over time. These surveys help you understand your customers’ needs and pinpoint issues with your products or services. They also allow you to categorize customers based on their satisfaction levels, which helps with targeted improvements.
3.Net Promoter Score Surveys (NPS)
NPS surveys are simple and quick since they use just one question: “On a scale from 0 to 10, how likely are you to recommend this product/company to a friend or colleague?”. Based on the score, you can do respondent segmentation into one of three categories:
Promoters (Score 9-10): These are your biggest fans, and they are likely to recommend your product.
Passives (Score 7-8): These folks find your product/service satisfactory but could easily switch to competitors.
Detractors (Score 0-6): These unhappy customers could harm your brand through negative word-of-mouth.
You can calculate the NPS score by subtracting the Detractors' percentage from the Promoters'. This gives a snapshot of customer loyalty and areas for improvement.
4. Close-ended Questions for Quantitative Research
Well-designed, close-ended questions are easy to answer. Users pick from predefined options like checkboxes, scales, or radio buttons. These surveys are suitable for gathering data. You'll see these in exit surveys asking users about their shopping experience. The answers provide actionable data, like customer preferences or standard problems.
Get more insights on quantitative research in this course on Data-driven Design .
You may ask,
"How satisfied are you with our delivery speed?"
The options could be:
Very Satisfied
Dissatisfied
Very Dissatisfied
Here, users don't need to type out their thoughts. They select an option that best describes their feelings. It's quick for the user and easy for the company to analyze.
5. Open-ended Questions for Qualitative User Research
While closed-ended questions offer fixed options for quick responses, open-ended questions allow for more detailed, free-form answers. These questions ask for written responses. They dig deeper into how users feel and what they expect.
It may take more time to analyze the responses you gather from this type of survey. But they're valuable because they offer nuanced insights.
For example, questions like "What feature do you wish we had?" can lead to ideas for product enhancements that meet users' needs .
When and Why Should One Conduct a UX Survey?
Conducting a UX survey is a strategic decision to understand various aspects of user interaction with a product or service. Here are vital scenarios and reasons for implementing them:
1. Feature Evaluation and Enhancement
You may find UX surveys better suited to assess existing products than development ones. These surveys can gather insights on how well your target audience receives a feature or service. Feedback from such surveys can guide adjustments or additions to your product.
For instance, if customers believe an existing feature lacks functionality, you can focus on enhancing it. UX surveys offer valuable data to refine a product to better align with customer needs and expectations.
2. Identifying Pain Points
Spotting pain points is essential for creating a user-friendly experience. UX surveys provide direct feedback from users about what's troubling them. These could be issues you're unaware of that make the customer experience less enjoyable or efficient.
For example, users might point out that they find your checkout process too complicated or that they have trouble finding specific information on your website. These insights are like gold; they give you specific areas to focus your improvement efforts. Addressing these issues helps you fix problems and show users you value and act upon their feedback.
3. Assessing Customer Satisfaction
Customer satisfaction is crucial for any business. A well-timed UX survey can gauge how well you meet customer expectations after a critical interaction, such as a purchase or customer service call.
Positive feedback helps identify vital areas, while negative feedback highlights issues that need attention.
4. Evaluating Customer Loyalty
Long-term success hinges on customer loyalty. NPS surveys, a type of UX survey, help gauge this.
Identifying promoters, passives, and detractors can help you tailor customer retention and referral strategies. If you see a dip in loyalty scores, it's an alert to dig deeper into potential issues.
5. Journey Mapping
Journey mapping visually represents a user's interactions with your product or service. It tracks the entire experience, from the first touchpoint to the final interaction. A well-designed UX survey can provide insights at multiple stages of this journey.
For example, you can use CES surveys at various checkpoints to measure ease of use . Are customers finding it simple to navigate from one section of your website to another? CSAT surveys can check satisfaction at critical touchpoints like purchase or support.
Open-ended questions can offer qualitative insights into why users make specific choices. These answers fill gaps in the journey map that analytics data might lack.
6. During Major Transitions or Updates
If you're planning a significant change, such as a rebrand or major update, a UX survey becomes invaluable. It helps assess customer sentiment and expectations before you roll out the differences.
Collecting survey data allows for adjustments that align with customer needs. This way, you can reduce the risk of negative backlash.
7. Continuous Improvement
The need for improvement never stops. Regular UX surveys create a feedback loop to help you track user sentiment and performance metrics. They allow for ongoing adjustments based on real-world usage.
For example, if you notice a slight dip in satisfaction scores related to app usability, you can investigate and make adjustments before it becomes a significant issue.
Continuous improvement through regular UX surveys keeps your product aligned with users’ needs and expectations. It helps you sustain your success.
6 UX Survey Best Practices From Experts

Conducting a UX survey requires careful planning and execution to achieve actionable insights. Here are five best practices from experts in the field:
1. Make it Quick
People value their time, and long surveys can deter participation. A quick and concise survey ensures that the participant remains engaged. Focus on the essential questions and remove any unnecessary ones.
Steps you can take:
Limit your survey to 5-10 essential questions
Use clear and concise language
Preview the survey with a friend or colleague to get feedback on the length.
2. Keep It Relevant
Ensuring relevance in your survey questions is crucial for collecting valuable data. If questions stray off-topic, they risk irritating or baffling participants. Keep questions focused to ensure you get the insights for your goals.
Define your target audience and goals before writing questions
Avoid generic questions that don't relate to the product or service
Focus on specific user experiences that align with your objectives.
Provide not applicable/don’t know answers for all closed questions.
3. Avoid Bias
Bias can distort the results and lead to misguided conclusions. The objective framing of questions helps in collecting unbiased responses. Some of the common biases include:
Question order bias: Affects responses based on the sequence of questions.
Confirmation bias: Only ask questions that affirm what you already believe.
Primacy bias: People choose the first options given.
Recency bias: People are more influenced by their last experience.
Hindsight bias: Respondents say events were foreseeable.
Assumption bias: Assumes respondents know certain information.
Clustering bias: People see patterns where none exist.
Avoid leading questions
Use neutral language
Consider asking an expert to review your questions for potential bias
Test the survey on a small group before launching it.
4. Mix Up Your Question Types
While multiple-choice and rating scales excel at gathering numerical data, open-ended questions offer rich, qualitative insights. The blend can give you a more comprehensive view of customer sentiment.
Use a mixture of types of questions according to the information you need
Utilize open-ended questions for in-depth insights and multiple-choice for quick feedback
Consider using scale questions to gauge user satisfaction or preferences
5. Ensure Accessibility
Making your survey accessible helps you capture a wide range of perspectives. If you create an accessible survey for everyone, including those with reduced abilities, you'll get a more complete and diverse set of insights. This comprehensive view can enhance the quality of your data and decision-making.
Utilize easy-to-read fonts and adequate color contrast
Provide alternative text for images
Ensure that users can navigate the survey using keyboard controls
Test the survey's accessibility features
Avoid complex layouts and matrix-style questions
See the W3’s Web Content Accessibility Guidelines for more details.
6.Maintain Privacy
Prioritizing participants' privacy is critical to building trust. When people feel confident that their data is safe, they're more likely to engage fully in your survey. A strong privacy policy meets legal standards and boosts participation rates. It enriches the quality of your insights.
State your privacy policy at the start of the survey
Use secure platforms for conducting the survey
Assure participants that their responses will remain confidential
Put sensitive or personal questions towards the end
Following these best practices, you can make UX surveys effective for gathering insights and improving the user experience. The actionable steps outlined above make creating an engaging, unbiased, and insightful survey possible.
The Ultimate Guide to Conduct a UX Survey

Conducting UX surveys is essential for understanding user interaction with your product. Follow these steps to design, distribute, and analyze surveys for actionable insights.
Step 1: Define Your Objectives
Defining clear objectives sets the stage for a successful UX survey. It helps you understand the key insights you are seeking. To zero in on what you're aiming to discover, consider these questions:
What is the main goal? Understand if you want to measure user satisfaction or you want to focus on something else.
Which user behaviors are relevant? Is the survey targeting frequent users, new users, or both?
What are the key metrics? Do you want to look at completion rates, time spent, or other indicators?
New feature opinions : Are you seeking input on new rolled-out features?
Pain points : Are you trying to identify user frustrations and roadblocks?
Clarity in the objectives will guide every next step and ensure you align the results with your project goals. Well-defined goals will streamline the survey's structure and help craft relevant questions. The sharper focus also helps in analyzing the data you collect later on.
Step 2: Identify Your Target Audience
Identifying your target audience is a pivotal step in creating a survey. Here's why:
Product awareness: Gauge how much your audience knows about your product. This shapes the depth and detail of questions.
Interests : Understand what topics engage your audience. Use that insight to make questions interesting.
Language : A professional audience may understand industry jargon. A general audience may not. Choose words carefully.
Region : Geography can affect preferences and opinions. Localize questions if needed.
Understanding your target audience helps you write questions that they can relate to. It leads to higher engagement and more accurate data in user research . You can also create customer personas and a user journey around them.
Step 3: Craft Engaging Questions for the Questionnaire
Questions are the heart of your survey. Writing engaging, clear, and unbiased questions will provide the insights you need.
Learn the art of writing good questions for surveys
So, here’s what you can do to craft engaging questions:
Use different types, such as multiple-choice for quick feedback or open-ended for deeper insights.
Use simple language, avoid jargon, and ensure each question serves a clear purpose.
Be mindful of potential biases and keep the questions neutral.
Your questions must captivate the user's interest and guide them through the survey.
Step 4: Select a Tool For the UX Research Survey
Selecting the right tool for your UX survey is crucial for data collection and analysis. A Google Form provides a quicker way to get started with UX surveys. Here’s why:
Ease of use : Google Forms is user-friendly. Even if you're not tech-savvy, you can create a survey quickly.
Customization : It offers various themes and allows question branching based on prior answers.
Integration : Google Forms integrates with other Google services like Google Sheets for real-time data tracking.
Free : For basic features, it's free of charge.
Data analysis : Offers basic analytics like pie charts and bar graphs for quick insights.
You can also use specialized UX research tools like SurveyMonkey with more advanced features. Consider what your objectives and target audience need. Then, choose a tool that best serves those needs.
Step 5: Pilot the Survey
Pilot testing is an invaluable step in refining the UX survey. It provides an opportunity to uncover unforeseen issues with the survey design, questions, or technology.
Recruit participants in small numbers to test the survey. You can ask internal team members for help or contact professionals via LinkedIn. Use this test survey to understand their experience and make necessary adjustments. This can make the difference between a good survey and a great one. It helps iron out the kinks and ensures a smoother product experience for the primary audience.
Step 6: Launch the Survey
Launching the survey is more than making it live. It involves choosing the proper channels, timing, and even incentives. Promoting the survey ensures that it reaches your intended audience and encourages participation.
Consider the time of day, week, and even platform that aligns with your audience. You must plan every aspect of the launch to maximize participation.
Step 7: Analyze and Interpret the Results
Data analysis transforms raw data into valuable insights. Use analytical tools to sort, filter, and interpret the data in the context of your objectives. Look for patterns and correlations but also for unexpected discoveries.
Your interpretation should lead to actionable insights that guide product or service improvement. This step transforms the effort of surveying real value for your project.
Step 8: Share Insights and Implement Changes
Finally, sharing your findings and implementing changes completes the process. Create comprehensive reports and engage stakeholders with the insights. Sharing fosters a shared understanding and sets the stage for informed decisions.
Plan and iterate on improvements based on the insights and use the learnings for continuous enhancement.
Each step is a building block that contributes to a successful and insightful user experience survey. Following this roadmap helps ensure that you create an engaging, relevant, and actionable UX research survey.
The 20 Best User Experience Survey Questions
These questions form a comprehensive framework for understanding various aspects of the user experience. Remember to use only a few of these to keep response rates high.
How did you find our website/app?
This question helps assess the effectiveness of your marketing channels. It shows you where people first encounter your brand. While Google Analytics reveals traffic from specific sources like AdWords or Facebook, it needs to track direct traffic. Knowing this can fine-tune your marketing strategy.
What was your primary goal in visiting our site today? Did you achieve it?
Focuses on why users visit and if the site meets their needs. It helps identify gaps in content or functionality.
How easy was it to navigate our site?
This question examines the effectiveness of your website. You're on the right track if people find it easy to navigate. If not, it's a red flag. Your site's layout or functionality may need tweaks.
What features did you use most?
This question identifies which parts of your product or service are most valuable to customers. If the majority say they often use a specific feature, that's a pivotal strength to highlight in marketing.
Were there any features that needed to be clarified or easier to use?
This question zeroes in on potential weak spots in your product design or functionality. A feature consistently labeled as confusing or complicated to use needs improvement.
How would you rate your overall experience?
Provides a general impression of user satisfaction.
What would you change about our website or app?
This question invites suggestions for improving your digital solution. It gives users a voice in the development process.
How likely are you to recommend our product to a friend or colleague?
Recommendations measure customer satisfaction and loyalty. Pop-up surveys commonly use this question based on a widely used metric called the Net Promoter Score (NPS). A high likelihood to recommend means customers are happy and likely to become brand advocates.
What other products or services would you like us to offer?
This question taps into unmet customer needs and wants. Responses can reveal gaps in your current offerings and inspire new products or services.
Did you encounter any technical issues?
Technical issues, like bugs, error messages, or crashes, can affect customer satisfaction.
What is your preferred payment/delivery method?
It may seem trivial, but some customers will only buy if their preferred payment method is available. So, you must understand the popular payment options that resonate with your target audience.
What is your preferred method of contact for support?
This question seeks to know how customers prefer to reach out for help. Understanding this helps businesses optimize their customer service channels.
How would you describe our product in one sentence?
This question aims to capture a concise customer impression of your product. The one-sentence descriptions can reveal key strengths or weaknesses.
How does our product compare to similar ones in the market?
This question seeks to understand your product's competitive edge or shortcomings. Responses can tell you where you excel or lag behind rivals.
Were our support resources (FAQs, live chat) helpful?
You need to understand the effectiveness of your customer support tools, like FAQs and live chat. If most people find these resources helpful, they validate your support strategy. If not, it's a cue to improve these areas. Understanding this aspect ensures that you offer assistance that benefits your customers.
How could our product better meet your needs in the future?
This question aims to collect suggestions for future improvements. Whether adding new features or refining existing ones, the feedback helps roadmap planning. If multiple customers highlight the same issue (like with pricing), that's a vital sign that needs attention.
How did you find the speed of the site?
This question evaluates how site speed impacts user satisfaction. Slow loading can frustrate users and may even lead them to abandon the site. If multiple people report this issue, it signals a need for optimization.
What language options would you prefer for our website/app?
This question identifies the language preferences of your user base. If a significant portion prefers another language, it makes sense to offer that option. Adding new languages can broaden your reach and make your platform more inclusive.
Would you like a follow-up from our team regarding your feedback?
This question gauges interest in further communication. A 'yes' suggests the respondent is engaged and open to dialogue, indicating higher loyalty or interest. A 'no 'means they provided feedback but aren't looking for a discussion.
Would you be interested in future updates or newsletters?
This question gauges customer interest in staying connected with your brand. A 'yes' indicates a satisfied customer likely to engage with future offerings. A 'no' could suggest they're not fully satisfied or not interested in long-term engagement.
UX Survey Templates
Here’s a list of the eight best user experience survey templates that are free to use:
Client Feedback Form
Find out what clients think about your business. Use this form as a case study to gather thoughts on customer service and more. Make changes to the template to focus on specific aspects of customer interaction
NPS-Enhanced Software Survey
Experts have made this ready-to-use template to improve your software's Net Promoter Score (NPS). Gather critical insights to elevate your product.
Basic NPS Inquiry Template
Easily gauge customer loyalty with this template. Customers rate their likelihood of recommending you from 0 to 10. Adapt the template to explore additional areas.
Support Team Feedback Form
Assess the performance of your customer service team. Adapt the survey to delve into aspects you are particularly interested in.
Quick Response Customer Survey
Send this brief survey to understand customer perceptions . It encourages customers to elaborate on their answers. Make adjustments to fit your needs.
Product Feedback Survey
Use this template to collect comments on your products. It aims to identify issues and suggest resolutions.
Snapshot Product Assessment
Collect rapid feedback on your products. Use this form to get concise and actionable comments from customers.
Comprehensive Client Feedback Form
Capture detailed information on how your customers feel about your products and services. This is useful for pinpointing specific areas for improvement.
Final Thoughts
And there you have it. We have provided an in-depth guide to creating a successful UX survey. It covers all the essential aspects, from defining objectives to crafting engaging questions, ensuring accessibility, analyzing results, and implementing changes.
We’ve included a curated list of 20 UX survey questions and eight templates, each serving a unique purpose in understanding the user experience.
Two major takeaways from this content include:
Align the survey with clear objectives : Understanding what you want to achieve with the survey sets the foundation for success. It guides every subsequent step.
Asking relevant and engaging questions : Crafting clear, interesting, and unbiased questions that cover various facets of the user experience is vital. It helps in capturing genuine feedback and insights.
You can follow these guidelines to uncover profound insights that drive success in your product or service.
Data-Driven Design: Quantitative Research for UX

Get Weekly Design Tips
Topics in this article, what you should read next, how to moderate user interviews.

- 4 years ago
Data Analysis: Techniques, Tools, and Processes

Writing Good Questions for Surveys

- 3 years ago
Why and When to Use Surveys

Ensuring Quality

Revolutionize UX Design with VR Experiences

Open Access—Link to us!
We believe in Open Access and the democratization of knowledge . Unfortunately, world-class educational materials such as this page are normally hidden behind paywalls or in expensive textbooks.
If you want this to change , cite this article , link to us, or join us to help us democratize design knowledge !
Privacy Settings
Our digital services use necessary tracking technologies, including third-party cookies, for security, functionality, and to uphold user rights. Optional cookies offer enhanced features, and analytics.
Experience the full potential of our site that remembers your preferences and supports secure sign-in.
Governs the storage of data necessary for maintaining website security, user authentication, and fraud prevention mechanisms.
Enhanced Functionality
Saves your settings and preferences, like your location, for a more personalized experience.
Referral Program
We use cookies to enable our referral program, giving you and your friends discounts.
Error Reporting
We share user ID with Bugsnag and NewRelic to help us track errors and fix issues.
Optimize your experience by allowing us to monitor site usage. You’ll enjoy a smoother, more personalized journey without compromising your privacy.
Analytics Storage
Collects anonymous data on how you navigate and interact, helping us make informed improvements.
Differentiates real visitors from automated bots, ensuring accurate usage data and improving your website experience.
Lets us tailor your digital ads to match your interests, making them more relevant and useful to you.
Advertising Storage
Stores information for better-targeted advertising, enhancing your online ad experience.
Personalization Storage
Permits storing data to personalize content and ads across Google services based on user behavior, enhancing overall user experience.
Advertising Personalization
Allows for content and ad personalization across Google services based on user behavior. This consent enhances user experiences.
Enables personalizing ads based on user data and interactions, allowing for more relevant advertising experiences across Google services.
Receive more relevant advertisements by sharing your interests and behavior with our trusted advertising partners.
Enables better ad targeting and measurement on Meta platforms, making ads you see more relevant.
Allows for improved ad effectiveness and measurement through Meta’s Conversions API, ensuring privacy-compliant data sharing.
LinkedIn Insights
Tracks conversions, retargeting, and web analytics for LinkedIn ad campaigns, enhancing ad relevance and performance.
LinkedIn CAPI
Enhances LinkedIn advertising through server-side event tracking, offering more accurate measurement and personalization.
Google Ads Tag
Tracks ad performance and user engagement, helping deliver ads that are most useful to you.
Share Knowledge, Get Respect!
or copy link
Cite according to academic standards
Simply copy and paste the text below into your bibliographic reference list, onto your blog, or anywhere else. You can also just hyperlink to this article.
New to UX Design? We’re giving you a free ebook!

Download our free ebook The Basics of User Experience Design to learn about core concepts of UX design.
In 9 chapters, we’ll cover: conducting user interviews, design thinking, interaction design, mobile UX design, usability, UX research, and many more!
New to UX Design? We’re Giving You a Free ebook!
Are you an agency specialized in UX, digital marketing, or growth? Join our Partner Program
Learn / Guides / UX design
Back to guides
How to use UX surveys to gain product experience insights
UX surveys collect customer feedback to help you make sense of user behavior—they give you insight into how people are experiencing your product, in their own words, so you can learn what works and what doesn't and prioritize changes to improve UX.
But where do you start? What tools do you need? And most importantly, what do you ask?
Last updated
Reading time.

What is a UX survey?
A user experience (UX) survey collects quantitative and qualitative data about a user’s interactions and experience with a website or digital product. UX survey data supports and complements website analytics and UX metrics collected through methods like A/B testing, heatmaps , usability testing, and session recordings
5 UX survey best practices
If you want to know how users really feel about their interactions and experience with your product so you can address specific pain points and prioritize product changes , a UX survey can give you the useful, actionable user data you need.
But here are five things to keep in mind before you launch your survey:
1. Avoid bias and leading questions

Before you launch your survey, check that you're avoiding bias. Here are a few things to look out for as you state your survey objectives and write your questions:
Confirmation bias: seeking only the data that confirms your beliefs. For example, "Would you be more likely to click this button if it were bigger and brighter?"
Framing effect (aka asking leading questions ): asking questions in a way that prompts a specific answer from your users. For example, "What did you love the most about your experience in our product?"
Unbalanced scales: similar to the framing effect, unbalanced scales will sway answers by limiting users' choices. For example, "How much did you enjoy your experience on a scale of 1 (enjoyed it a little) to 5 (enjoyed it a lot)?"
2. Ask the right questions

To get the data and user insights you need, focus your UX survey questions on the problem you’re trying to solve . If you don't know what the problem is yet, ask questions to help you identify your users' pain points so you can discover the blockers they're experiencing (and then remove them).
It's helpful to ask closed-ended questions early on, then—if you're using a survey tool like Hotjar—use Survey Logic to follow up with open-ended questions that explore the subject on a deeper level.
For example, let's say you want to find out how users feel about a new tool or feature. Some closed-ended questions you could ask are:
Have you used [new tool/feature]?
How easy was it to use [new tool/feature] on a scale of 1 (very difficult) to 5 (very easy)?
And you could follow up with open-ended questions like:
What are your first impressions of [new tool/feature]?
What is one thing you would change about [new tool/feature]?
3. Make it quick, keep it relevant

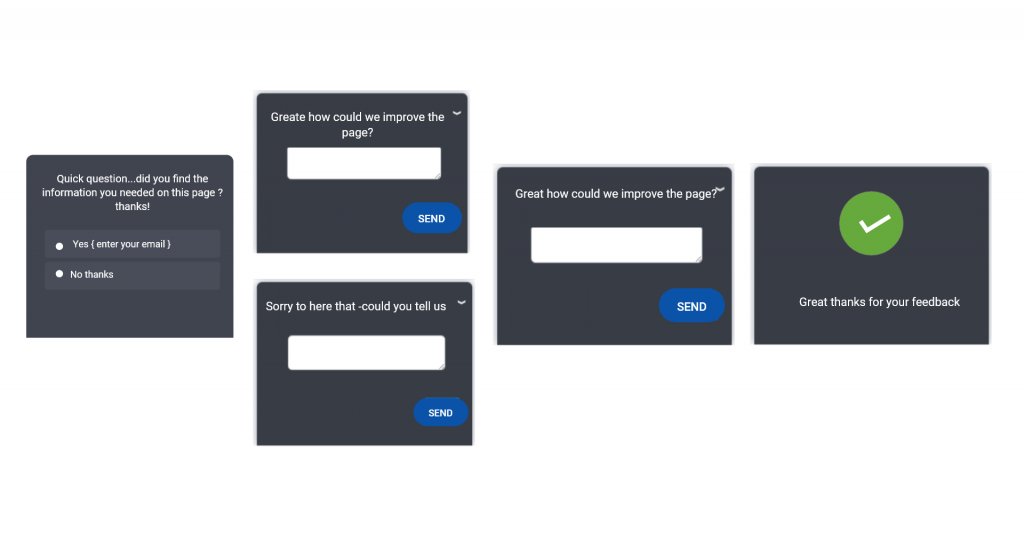
Make on-site surveys —surveys that pop up or slide onto the page—as relevant, quick, and easy-to-complete as possible. Start by asking one or two closed-ended questions to get quantitative data or to segment by user cohorts. If you follow up with open-ended questions, keep them simple.
Note: sometimes you need more detailed product experience insights, in which case you can invite users to participate in an external link survey . External surveys give users more time and space to thoughtfully answer more specific questions about the user experience.
4. Sample continuously and share your findings

Your team is never really finished building and improving your product, so you should never stop asking for feedback. But keep in mind that survey results can be impacted by external factors, like a disproportionate number of new or inexperienced users or failure to distribute representative cohorts to both versions of an A/B test. By sampling over a long period, you can reduce the risk of your UX survey being skewed by unique events.
🔥 If you're using Hotjar
It's easy to share insights with your team: whether you have new targets, you’re going through a redesign, or you’re prioritizing product changes, it's easy to get the conversation flowing in Slack :
5. Ensure survey cool-off periods
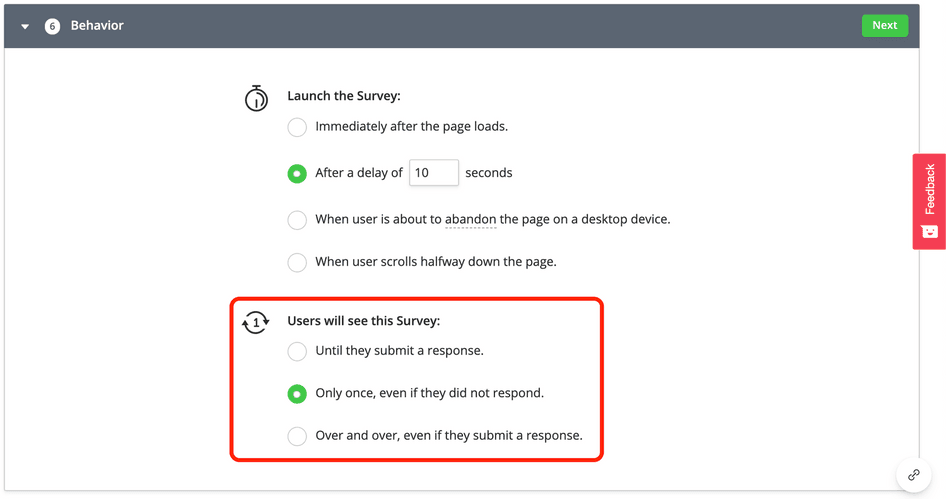
On-site surveys can distract users from their usual experience with your website or product, and multiple invitations to external surveys can become irritating. Plan cool-off periods between surveys to avoid interfering with the user experience and repeatedly re-surveying individual users.
To build in survey cool-off periods, change the frequency of individual on-site Surveys so users stop seeing a survey after they respond; or so they only see it once, even if they don't respond.
How to conduct UX surveys: the Lean approach
It might be tempting to address every topic or pain point in one survey, but a targeted approach will give you relevant, actionable user insights at each stage of product development, helping you prioritize UX changes and improvements.
As we have with other pages in this UX guide , we'll use the Lean UX model to… guide us:
UX survey questions for the THINK phase
The THINK phase is about generating ideas and uncovering qualitative insights, which is a great time to ask open-ended questions:
Question: If you could improve one thing about this product, what would it be?
Why it’s useful: Get ideas for improvements and uncover possible user pain points.
Question: What is one thing you wish this product could do that it doesn’t do already?
Why it’s useful: Get ideas for new tools or features to add to your product roadmap.
Question: If you knew that we would make one change to our product the next time you logged in, what would you want it to be?
Why it’s useful: Get ideas for improvements, uncover possible user pain points, and prioritize changes.
UX survey questions for the MAKE phase
Using UX surveys in the MAKE phase can help you prioritize aspects of your product roadmap:
Question: On a scale of 1-10, how would your use of our product be impacted by [feature/change]?
Why it’s useful: Understand the potential impact of changes from the users' perspective.
Question: Please state your agreement with the following: "[feature/change] would make my job easier."
Why it’s useful: Understand how users perceive potential additions or changes to your product in terms of their goals and objectives.
UX survey questions for the CHECK phase
The CHECK phase helps you understand whether product changes have improved the user experience. You can use a mixture of closed- and open-ended questions during this phase:
Question: Rate your agreement with the following: "[feature/change] has made my job easier."
Why it’s useful: Assess the performance of a new feature or product update in terms of users' goals and objectives.
Question: How has [feature/change] affected the way you use our product?
Why it’s useful: Get voice of the customer (VoC) feedback that directly relates to a recent change or update to your product.
Question: Is there anything you would change about how [feature/change] works?
Why it’s useful: Gain product experience insights about new features and changes that can lead into the next THINK phase of the Lean UX cycle.
Improve UX with product experience insights from Hotjar
Use Hotjar to understand how real users are experiencing your website or app—then improve it for them!
FAQs about UX surveys
What is the ideal length of a ux survey.
There's no 'ideal' survey length: keep it relevant, quick, and easy to complete. Ask simple, straightforward questions that are directly related to your survey objectives, and use Survey Logic to segment user cohorts.
📚 Read more: learn how product teams can conduct online surveys to get actionable insights.
What is the purpose of a UX survey?
UX surveys give product teams valuable, direct feedback to help them improve the user experience, reduce churn, and turn users into product evangelists by generating quantitative and qualitative data about how users feel about their interactions and experience with your product or service.
What kind of questions should a UX survey ask?
Instead of addressing every topic or pain point in one survey, a targeted approach will give you relevant, actionable user insights at each stage of product development so you can prioritize UX changes and improvements.
See the How to conduct UX surveys: the Lean approach section of this guide to learn more.
UX analysis
Previous chapter
Next chapter
Product Design Bundle and save
User Research New
Content Design
UX Design Fundamentals
Software and Coding Fundamentals for UX
- UX training for teams
- Hire our alumni
- Student Stories
- State of UX Hiring Report 2024
- Our mission
- Advisory Council
Education for every phase of your UX career
Professional Diploma
Learn the full user experience (UX) process from research to interaction design to prototyping.
Combine the UX Diploma with the UI Certificate to pursue a career as a product designer.
Professional Certificates
Learn how to plan, execute, analyse and communicate user research effectively.
Master content design and UX writing principles, from tone and style to writing for interfaces.
Understand the fundamentals of UI elements and design systems, as well as the role of UI in UX.
Short Courses
Gain a solid foundation in the philosophy, principles and methods of user experience design.
Learn the essentials of software development so you can work more effectively with developers.
Give your team the skills, knowledge and mindset to create great digital products.
Join our hiring programme and access our list of certified professionals.
Learn about our mission to set the global standard in UX education.
Meet our leadership team with UX and education expertise.
Members of the council connect us to the wider UX industry.
Our team are available to answer any of your questions.
Fresh insights from experts, alumni and the wider design community.
Success stories from our course alumni building thriving careers.
Discover a wealth of UX expertise on our YouTube channel.
Latest industry insights. A practical guide to landing a job in UX.
How to design effective user surveys for UX research: A step-by-step guide
User surveys are an excellent method for conducting quick, affordable, and scalable UX research. With some carefully-crafted questions and the right survey tool, you can gather feedback and insights from a huge pool of participants—enabling you to make data-driven decisions for better UX.

Free course: Introduction to UX Design
What is UX? Why has it become so important? Could it be a career for you? Learn the answers, and more, with a free 7-lesson video course.

User surveys are a quick, affordable, and scalable UX research method. Learn how to design effective user surveys in this step-by-step guide.
It sounds simple enough. But, if you want to get the most out of user surveys, it’s important to employ them in the right context—and to master the art of survey design.
In this guide, you’ll find everything you need to know about user surveys. Keep reading to learn:
What are user surveys?
When and why should you conduct user surveys as part of your ux research, what are the pros and cons of user surveys, how to design effective user surveys (step-by-step).
- User survey best practices
- User survey tools
This guide is for UX designers, UX researchers, and anyone else who wants to leverage user surveys as part of a research project. Let’s begin!
[GET CERTIFIED IN USER RESEARCH]
User surveys are used in UX research to gather direct input and feedback from actual or target users.
They are unmoderated, which means you don’t supervise or observe participants as they complete them. You simply create the survey and send it out, allowing users to work through it in their own time.
The anatomy of a user survey is pretty simple. It contains a series of questions which the user responds to, either by selecting from a range of possible answers or by typing out their own unique answer. This depends on whether the survey questions are open or closed.
Open vs. closed questions in user surveys
Open questions give the user complete freedom and flexibility in how they respond, allowing them to answer in their own words without being restricted by a fixed set of options. Open questions are used to gather qualitative data; they cannot be answered with a simple “Yes” or “No”, so they elicit more detailed elaboration and insight.
Here are some examples of open-ended questions:
- What was your first impression of the [XYZ] app?
- How would you improve the experience of booking transport with the [XYZ] app?
- What are your main priorities when it comes to booking transport?
Closed questions have predefined responses which the user must choose from. They require less thought and effort from participants, and they allow you to collect quantitative (i.e. countable) data.
Examples of closed questions include:
- How would you rate your first impression of the [XYZ] app on a scale of 1-10?
- Would you recommend the [XYZ] app to your friends?
- Do you order takeaway more than once a week?
That’s user surveys in a nutshell. Next, let’s consider when and why you might choose this UX research method.
[GET CERTIFIED IN UX]
User surveys are typically used in evaluative research—that is, research you conduct to evaluate (i.e. validate or invalidate) existing ideas, concepts, directions, or designs. This is different to exploratory research where the goal is to figure out what problem you need to solve before coming up with ideas.
You might send out user surveys periodically to monitor user/customer satisfaction and to identify pain-points and areas for improvement within your existing product/service/solution.
Perhaps you’ve got some ideas for a new product, or an iteration of an existing product. User surveys will enable you to validate those ideas with a large sample of target users before you go ahead with design and development.
Surveys are also useful for backing up other research you’ve done. For example, if you’ve conducted user interviews with a small number of participants and now want to test your findings on a larger pool of users, surveys could be the next step.
The main advantage of user surveys is that they are affordable and scalable. You can reach lots of people, and therefore gather a large amount of data, without spending much money—ideal for UX research on a budget.
The main drawback is that, while they’re great for quantity, user surveys don’t always guarantee quality. Participants may complete your survey but that doesn’t automatically mean that they’re providing accurate or honest feedback. Survey data is also susceptible to bias, especially if the questions are written in a way that subtly leads or influences participants.
Here are all the pros and cons of user surveys at a glance.
User survey pros:
- Inexpensive to run
- Quick and uncomplicated; all you need is a survey tool
- Scalable—you can easily reach lots of participants and gather a large sample of data
- You can reach users and customers anywhere as they’re done online and unmoderated
- Usually fairly quick and easy for users to complete, encouraging a high participation rate
User survey cons:
- Users may not provide honest or accurate answers
- Data gathered may be susceptible to bias (especially if survey questions are leading or ambiguous)
- Surveys are at risk of sampling bias—based on the likelihood that people who choose to complete your survey in the first place typically fall into one of two categories: either very happy customers or very dissatisfied customers
As long as you understand the limitations of user surveys and take care to design them well, you can confidently include them in your UX research toolkit. On that note, let’s explore how to create an effective user survey.
Want to design an effective user survey? Here’s what you need to do:
- Define your research objective
- Choose your survey tool
- Design your survey
- Test and iterate
- Recruit participants and deploy!
Let’s go through each step in detail.
1. Define your research objective
This first step applies to all kinds of UX research. Before you can start designing your survey, you need to come up with a clearly defined research objective.
What do you want to learn from your user survey? What data and insights do you hope to gather?
Perhaps you released a product update a few months ago and your goal is to gather feedback from existing customers. Maybe you’re planning some product improvements and want to hear from your users about what features and functionality they’d like to see next.
Your research goal will determine the type of survey you design—i.e. whether you’ll include open or closed questions (or both) in order to gather qualitative data, quantitative data, or a mixture.
2. Choose your survey tool
Next, decide which tool you’ll use to create and distribute your user survey. If this is your first ever user survey, spend some time getting to know your chosen tool before you start designing your survey.
This way, you’ll get an idea of what’s possible with your tool—for example, how many questions you can include per survey, what options you have for distributing your survey, as well as any design/formatting specifications or limitations.
Once you’ve got the lay of the land, you can design your survey accordingly. We share some of the best user survey tools later on in this guide—check them out before you commit.
3. Design your survey
Now for the survey itself! When creating your survey, you’ll need to write:
- An introduction welcoming the user to the survey and providing some context. What is the survey about and why are you conducting it? How long will the survey take? What can the user expect? Here you should also include information about how the user’s data will be processed, and state whether or not the survey is anonymous/confidential.
- Your survey questions . These must be clear and easy to understand, and as bias-free as possible. You can learn more about writing effective survey questions in the “best practices” section of this guide.
- Answer choices . If you’re asking closed questions that require the user to select a predefined answer, you’ll need to write out all possible options they can choose from.
- A closing statement . At the end of the survey, it’s good practice to let the user know they have successfully completed the survey—and to thank them for doing so.
Here is an example of an introduction and closing screen taken from a user survey conducted by N26 bank:

Before you go live with your survey, it’s worth having someone else (or a few people) review it.
This step isn’t just about checking for typos. Critically, it’s about making sure that the survey questions are clear and easy to understand, that they follow a logical order, and that the answer options make sense.
If necessary, iterate on your survey and run another quick round of QA before you release it to your users.
5. Recruit participants and deploy your survey!
You’re almost ready to launch! Just one more thing: recruiting participants to complete your survey.
Your approach to finding participants will depend on the nature of your survey and your research goal. If you’re targeting existing customers, you might embed your survey within the product itself—think in-app surveys that pop up after you’ve completed a task. Otherwise, you might send your survey out via email to your customer base.
If you’re not limiting your audience to existing users and just want to reach as large a representative sample as possible, consider using an agency to distribute your survey. Many user research tools also have a participant database you can access.
Now, set your survey free and await that data!
3 best practices for effective user surveys
If you can design your user surveys to be quick, simple, and user-friendly, you’ll have the best possible shot of capturing quality data. Here are three best practices to ensure your user surveys are a joy to complete.
1. Make sure your questions are crystal-clear
The key to effective user surveys is asking the right questions—and making sure they’re crystal-clear for the user. Use plain, jargon-free language and avoid over-complicated or ambiguous wording.
And, importantly, keep your survey questions as neutral as possible. You don’t want to subtly influence the user’s answer in any way, or include questions that make an assumption about the user’s behaviour, goals, and preferences.
2. Use skip logic to create a logical flow
Completing your survey should be a seamless experience for the user. If necessary, use skip logic to customise the flow of the survey depending on the user’s answers.
For example, if you ask the user “Which of the following best describes how you use the [XYZ] app?”, you could then present them with a follow-up question which is relevant to their choice. Likewise, if they answer “None”, you’ll want to skip the follow-up question altogether.
This helps to ensure that the questions flow in a logical and sensical order, encouraging the user to stick with your survey right through to the end.
3. Keep your survey short (and include a progress bar)
If we’re honest, completing user surveys can quickly get tiresome. You want to keep your users engaged for the duration and avoid them “falling off” halfway through—so keep your survey as short and sweet as possible.
It’s also worth including a progress bar to reassure the user that the end is in sight. You might even have some fun with your in-survey messaging, for example, “Stick with it! Just three more questions left.”
If it’s really necessary to create longer, more time-consuming surveys, consider rewarding participants for their time with a voucher or discount code.
What are the best user survey tools?
Some of the most popular user survey tools include:
- SurveyMonkey
- SurveySparrow
- OptimalWorkshop
- GetFeedback
For more tools, check out this guide: The 9 Best UX Research Tools for Designers and Researchers .
In this guide, you learnt how to design effective user surveys. Once you’ve created and distributed your survey, the next step is to analyse the data you’ve gathered and use it to inform your design decisions. You can learn how to analyse and synthesise your user research data in this guide . And, once you’re ready to present your findings, check out this post on how to write a UX research report .
And remember: User surveys are just one of many UX research methods. Effective user research relies on a variety of techniques—from user interviews to card sorting to A/B testing . Do your research on UX research and be sure to choose the most appropriate method for your goals!
- user research
- user survey
Subscribe to our newsletter
Get the best UX insights and career advice direct to your inbox each month.
Thanks for subscribing to our newsletter
You'll now get the best career advice, industry insights and UX community content, direct to your inbox every month.
Upcoming courses
Professional diploma in ux design.
Learn the full UX process, from research to design to prototyping.
Professional Certificate in UI Design
Master key concepts and techniques of UI design.
Certificate in Software and Coding Fundamentals for UX
Collaborate effectively with software developers.
Certificate in UX Design Fundamentals
Get a comprehensive introduction to UX design.
Professional Certificate in Content Design
Learn the skills you need to start a career in content design.
Professional Certificate in User Research
Master the research skills that make UX professionals so valuable.
Upcoming course
Build your UX career with a globally-recognised, industry-approved certification. Get the mindset, the skills and the confidence of UX designers.
You may also like

7 programming languages that UX designers should know about in 2024
: UX challenges and solutions 4")
Designing for the internet of things (IoT): UX challenges and solutions

What is Perplexity AI and how can you use it in the design process?
Build your UX career with a globally recognised, industry-approved qualification. Get the mindset, the confidence and the skills that make UX designers so valuable.
6 August 2024
Skip to main content
COVID-19 update: Google is prioritizing everyone's health and safety, this may impact UX Research. Learn More
- English (United Kingdom)
- Español (Latinoamérica)
- Português (Brasil)
- Português (Portugal)
Jump to Content
Help shape the future of Google
Your feedback is important to us.
We’d love to know your thoughts, so we can keep making Google products that fit your needs. You’ll get to influence things millions of people use every day, from email and productivity apps to tools for developers and educators.
Even if you don’t currently use Google products, you can still sign up for a chance to participate in our research. If one of our studies is a good fit for you, we’ll get in touch with details and next steps. Most participants will get a thank-you gift.
Every study opportunity is:
Open - Whether you are a newbie or an experienced Google product user, anyone can sign up to participate.
Secure - You can trust us to never share your data with third parties.
Flexible - Participation can be remote or in person. It’s up to you.
Beneficial - After you participate you may receive a small gift, like a Visa or a retailer-specific gift card.
Valuable - Your feedback will help us build better products for everyone.
Tell us a little bit about yourself by filling out a form . It’ll help us determine if any of the upcoming UX research studies would be a good match.
Join a research session
If a study is a good fit for you, you’ll get a follow-up questionnaire and details about what the study involves, including next steps and location.
Accept our thanks
After completing the study, most participants will get a giftcard to thank them for their time.
Your feedback will make it possible for us to continue our mission of building a more helpful Google for everyone – no matter who they are, where they live, or what they want to accomplish.
For more information, take a look at our FAQ .
- (855) 776-7763
All Products
BIGContacts CRM
Survey Maker
ProProfs.com
- Get Started Free
FREE. All Features. FOREVER!
Try our Forever FREE account with all premium features!
How to Conduct User Experience Surveys: Templates & Best Practices

Author & Editor at ProProfs
Shivani Dubey specializes in crafting engaging narratives and exploring Customer Experience Management intricacies. She writes on vital topics like customer feedback, emerging UX and CX trends, and sentiment analysis.

User experience or UX surveys are your best bet to get actionable insights that can help you create a rich customer experience.
But do you or your customers look forward to filling out UX surveys on any given day?
Can you do something about it? Yes, you can!
The key here is designing delightful user experience surveys that can fetch you deep insights into customer behavior, trends, demographics, and preferences. And this should come naturally into your process.
If it hasn’t, it’s never too late to do right by your business.
So, let’s get straight to the point and discuss how you can conduct UX surveys, followed by the types of UX surveys, the steps involved, and best practices to create a kickass user experience.
Conducting UX Surveys: 9 Pro Steps for Understanding Your Users
Here are a few simple steps you can follow to create and conduct flawless UX surveys. By the end of it, you’ll know how to build and deploy UX surveys that can get you actionable customer insights.
Step 1: Set Outcome Expectations for Your UX Survey
Begin by identifying what purpose you want to fulfill by conducting UX surveys, i.e., “What to Ask.”
- Is it gauging customer loyalty?
- Do you want to measure customer satisfaction ?
- Want to know how your customer support is performing?
- Is it exploring the effectiveness of your onboarding process ?
Develop a clear understanding of the information you need to resolve a particular issue. You need to choose which type of survey you will primarily use and focus on at this stage.
Pro Tip: Do not try to fulfill multiple purposes with one UX survey . That is, you shouldn’t ask too many different things in one survey. Doing so will only give you mixed and unclear responses.
Step 2: Find Your Targeted Audience
If you want accurate insights, you need to have an answer to “Who to Ask.” If you choose an unsuitable target audience to collect customer insights, the data you’ll get will be good for nothing.
For example, if you want to ask customers about their onboarding experience, then conduct UX surveys targeting only the customers who went through the onboarding process and not those who opted for the ‘Skip’ option.
UX Survey Tip: We will give you a peek into one in-house UX survey example.
To ensure we collect our NPS data from the right customers, Qualaroo shows its NPS surveys to customers when they are on the dashboard and using the tool.
This way, we can make sure we are only asking customers who are actively using our tool.
Step 3: Create UX Survey Questions
When you know why you want to collect customer data and from whom you should collect it, you can easily decide your approach for “How to Ask.”
Now is the time to ask the right questions. But don’t forget to ask in the right way. Do not frame leading questions , and keep the focus on your UX issues.
If you want to create flawless UX research surveys, keep reading to discuss the best practices later in the article.
[A Read You Won’t Regret: 26 Common Types of Survey Errors and How to Correct Them]
Step 4: Set the Order of UX Survey Questions
If you order the questionnaire incorrectly while conducting your UX survey, it will be subjected to order bias (refer to the above-recommended article for a detailed explanation).
Here’s an apt example:
Suppose you first ask your customers what they like about Feature A and then ask them their favorite feature of your product/service.
Then, customers are more likely to answer in favor of Feature A since the first question indicated your priority for it.
Wrong question orders will also prevent respondents from completing the UX survey. Additionally, keep in mind to maintain a logical UX questionnaire flow when using branching and skip logic in your surveys.
Useful Read: Skip Logic Survey – A Complete Guide on How to Design Branching Surveys
Step 5: Ace Your UX Survey UI
Besides ensuring you ask the right questions in the proper order, don’t forget to make the UI of your UX design surveys friendly and practical.
The placement of the survey options, the submit button, and even how you present your question play a significant role in the users’ engagement with your surveys.
Related read: 16 Best UX/UI Tools for Designers and Researchers In 2023
Step 6: Target the Right Users
The whole point of this exercise is to collect reliable and relevant user feedback. So, if you don’t ask the RIGHT QUESTIONS to the RIGHT PEOPLE; all will be for nothing.
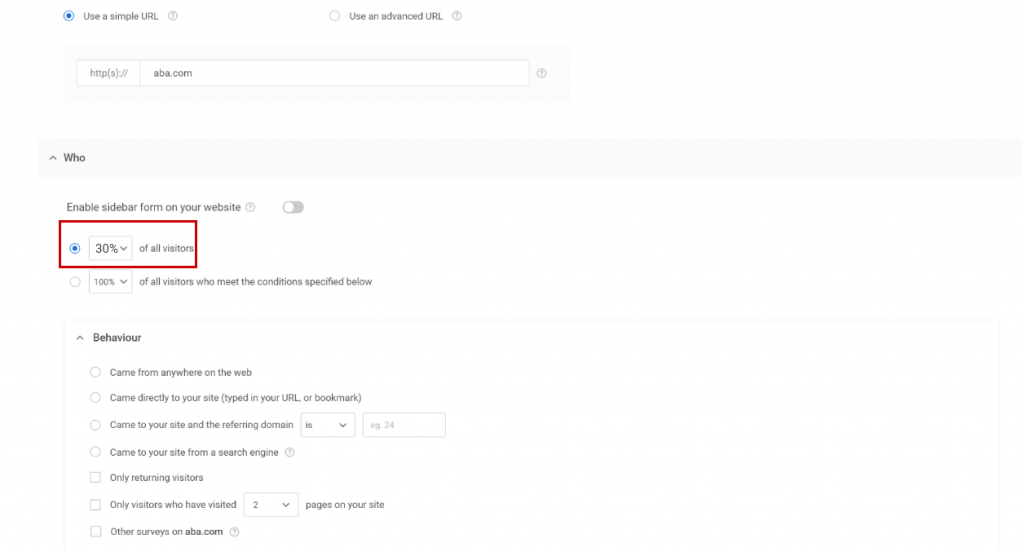
It is where advanced targeting comes into play. You can start by showing your survey to the relevant audience. For that, you can set survey triggers based on user behavior on the site, browsers, and devices used or set custom properties.
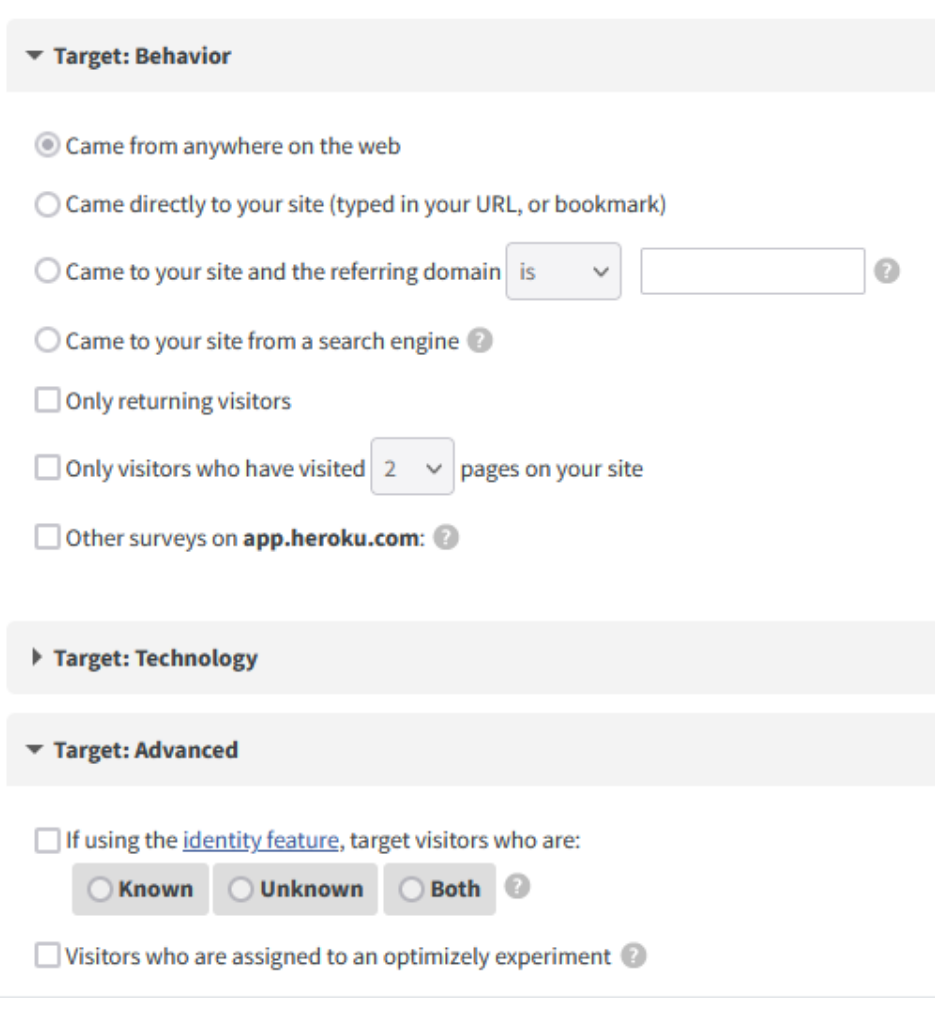
Here’s a detailed video on how you can zero in on specific customer segments and glean precise insights from your UX surveys.
Understanding the Qualaroo Targeting Section for Desktop
You can use branching logic to collect qualitative and quantitative data . For example, if you ask customers to rate their satisfaction, you can add a follow-up question asking them the reason for their rating.

Step 7: Test and Iterate
Once you have successfully designed your user experience survey, it’s time for the test drive. We would suggest you target a small fraction of your targeted audience first while you conduct a UX survey to see what kind of responses you get.
If you think something isn’t adding up in your survey, you can always improvise it until you are sure of it.
Feedback survey tools like Qualaroo allow you to target the traffic on your website and control how many people you want to show your UX survey to and under what conditions.
Step 8: Analyze the Insights
When you reach this step, all you have to do is focus on studying data the right way and procure accurate insights. Different types of data require different ways to analyze it. Here are a few examples:
If you conduct an NPS survey , choose a survey tool that automatically calculates and displays your NPS on the dashboard.
If you added open-ended questions to your survey, then you can quickly analyze the responses using a Sentiment Analysis feature.
This feature analyzes each written response, highlights the most used words and phrases, and mentions what emotions customers feel towards your brand, services, or products.
For a CES survey, you can calculate the score using two formulas: Text-based and Numeric.
For a text-based survey like this:

Use this CES formula:
CES = % of responses as “Difficult” ― % of responses as “Easy”
For a numeric scale survey like this:

CES = Total sum of individual CES
Total number of customers who responded
Now that you know how to create engaging UX surveys, let’s discuss the best practices you can use to ensure a high response rate.
Step 9: Complete the Feedback Loop
Once you’re done analyzing all the feedback data from the UX surveys, it’s time for some action. For this, you need a UX survey tool like Qualaroo that helps you avoid data silos and promote collaboration on the feedback.
You can also create custom labels and tag each response to pass the feedback to respective departments, act on the insights, and close the feedback loop.
CASE STUDY- TWILIO
Twilio offers APIs for developers to create communication apps like SMS, video-calling, and messaging.
Since Twilio has a diverse product portfolio, its team wanted to refine the onboarding experience. Their customers have different onboarding needs, so the best thing at their disposal was to ask customers for their experience.
In the words of the Product Manager for Twilio’s Experimentation Platform, Laura Schaffer, “There are so many ways to approach this challenge. The hard part usually isn’t coming up with the hypotheses for what might work best – it’s knowing which are the right ones to try first.”
With Qualaroo, the team prioritized hypotheses for experimentation using customer insights.
“In less than 5 minutes, teams can go from having almost entirely opinion-backed ideas to having ones that are data-backed by targeted customer feedback.”
Types of UX Surveys
User or customer experience is an umbrella term with many different components. Because of this, there are different survey types catering to each purpose that comes under UX. Let’s start with the one you already anticipate.
[Related Read: What is Customer Experience Management? ]
Customer Satisfaction Surveys (CSAT): Conducting these UX surveys will help you measure how satisfied your customers are with your services and products.
Net Promoter Score Surveys : You can differentiate your loyal customers from dissatisfied customers on the brink of churn using NPS surveys.

The UX survey asks customers how likely they are to recommend your company to others. The higher the score, the more likely they are to recommend your brand.
User Journey Experience Surveys: These UX surveys aim to explore the elements customers approve of and what needs improvement throughout their journey .
You can deploy them at several customer journey touchpoints, such as the checkout process, product page, shopping cart, onboarding process, and so on. This process can help you create accurate customer journey maps .
Customer Effort Score Surveys : Better known as CES surveys, they gauge how easy it is for customers to interact with your brand , i.e., achieve a goal such as resolving issues with customer support. The higher the score, the easier it is for them to do something with low effort.

System Usability Surveys : System usability surveys aim to gauge your software product’s performance . It collects your customers’ feedback on components that account for usability.
Exit-intent Surveys : You can deploy these on the pages with high bounce rates to ask customers why they are leaving the website without completing the customer journey.

The insights from exit-intent UX surveys let you pinpoint elements on your website that drive away your visitors so that you can fix them and avoid a high bounce rate. You can set triggers for these surveys to appear at a specific time and after the visitor takes a specific action on the website.
To deploy these, you can use user experience and feedback survey software like Qualaroo , which helps create different types of user research surveys for feedback, and Picreel , which specializes in exit-intent pop-ups to make customers stay.
When Should You Conduct UX Surveys ?
You can conduct UX surveys across the user journey. We’ve divided the journey and shared the surveys you can conduct at each touch point:
This is when users first discover your brand or product.
You can conduct UX surveys for brand discovery, asking questions like “How did you first hear about us? Share your initial impressions!”
You can also explore at this stage what marketing channels are working for you in bringing traction. You can ask questions like this: “Tell us what caught your attention in our recent ad. Your feedback matters!”
Consideration
At this stage, users actively explore options and weigh different choices. You can collect user feedback on what influences their decisions and considerations, like “Did our content help you make informed decisions? Share your thoughts!”
Interest/Intent
Users express interest or intent to engage with your product or service. This is where you can start conducting UX surveys to collect feedback directly related to your user experience. For example, you can gauge their first impression of your website or products.
For this, you can ask questions like “How was your experience navigating our site? Any areas we can improve?” “What was the first thing that caught your attention?” or “What was your experience signing up? We’d love to make it even smoother.”
This is where the users decide to make a purchase or complete a desired action.
You can conduct customer satisfaction surveys , checkout process surveys, and website experience surveys to understand their specific and overall experience with your brand.
You can also conduct post-purchase UX surveys to collect the overall feedback using questions like “How was your overall experience after making a purchase? Your feedback matters!”
At the retention stage in the user journey, the focus is on maintaining and enhancing the customer relationship.
Besides gauging customer satisfaction at this stage, you can collect usability feedback using SUS and CES surveys to understand the challenges faced by your users while using your products or services.
For example, you can ask questions like “How easy or difficult was it for you to accomplish the ABC task with our product?” and “Tell us how you’re using our product! We’re eager to hear your experiences.”
This is where your satisfied customers become brand advocates and start recommending your brand. Here, you can conduct a UX survey like Net Promoter Score, asking one simple question “On a scale of 0-10, how likely are you to recommend our product/website/service to your family and friends? ”

10+ Best Practices for Delightful User Experience Surveys
Creating and conducting user experience surveys that can get you accurate insights isn’t as easy as it seems. But it becomes easier with the right UX survey tips. Here are some tips for UI/UX survey questions to keep in mind while framing your UX survey questionnaire.
Simple Language = Easy to Understand
Would you like to respond to a survey that uses this kind of language?
“Would you please enlighten us with your valuable experience with our digital product ABC?”
We hope not. At best, the language used is just an exaggeration of “How would you rate your experience with the product ABC?”
If you want to conduct UX surveys that are engaging, keep the questions’ language simple and easy to follow.
Also, avoid industry jargon and replace them with words that don’t require a Google search. For example-
Jargon: “Would you be interested in a Rapid app development platform?”
Simple language: “Are you looking for a platform that helps create an app without coding in a couple of hours?”
Don’t Ask Multiple Things in One Question
When designing UX survey questions, ensure you don’t ask multiple things at once. It confuses the respondents, and their answers become ambiguous. For example –
Wrong Question: “How satisfied are you with our features and user interface?”
Now, if customers rate 8, you don’t know if they rated your features or the UI.
Lookout for Biases
There are multiple types of survey biases based on questions, answers, and the order of the questions. Watch out for these biases when you conduct UX surveys –
- Question order bias: Refers to how you frame and order your questions that affect responses.
- Confirmation bias : This occurs when you only ask the questions that confirm your hypothesis.
- Primacy bias: Concerns with the preference of respondents to choose the options on the top.
- Recency bias: When people favor the options at the end, the recent ones.
- Hindsight bias: When respondents think the events that occurred were predictable.
- Assumption bias: Refers to the situation when a researcher frames questions assuming the respondents’ knowledge level.
- Clustering bias: Occurs when respondents find patterns in the questions when there are none.
Use Open-Text Questions Too
Although question types like MCQs and ratings are beneficial for collecting quantitative data, the open-ended questions fetch you qualitative insights.
Conducting UX surveys with open-ended answer types for questions allows your respondents to freely explain their experiences and obstacles so that you can take corrective actions.
Where to Ask: Target The Right Survey Channels
Besides the obvious platforms like websites and mobile apps, you can also conduct user experience surveys for prototype testing .
For existing products or services, you can use on-site and in-app surveys . And if you are preparing to launch a new product or service, you can add surveys to your prototype to make sensible iterations.
For conducting UX surveys, you can use these 29 Prototype Testing Questions to get the most elaborate insights.
For example, you can share your prototype with a sample target audience. You can ask the respondents UI survey questions to see how they like the interface and similar questions targeting different UX components.
You might like to read: 18 Best Prototyping Tools for UI/UX Designers in 2023
When to Ask: Choose Your Survey Touchpoint
UX comprises every element that customers interact with, affecting their experience with your company or product. So, you need to carefully consider the touchpoints where you’ll conduct UX surveys, depending on your goal.
For example, if you want to improve the traffic on your pricing page, ask your customers what information is missing that would help them when they are about to leave.
Keep Surveys Crisp and Relevant
Customers abandon the UX surveys in the middle that take forever to complete and aren’t relevant to them. An ideal survey only asks four to five questions.
As for the relevancy, you can use screening questions (screeners) to ensure the respondents who finally take your survey are qualified for it.
Screeners filter out the unsuitable candidates so that the UX surveys are relevant to the customers.
Survey at Intervals
Try not to bombard your customers and conduct your UX surveys at intervals. It’s also a good practice not to launch multiple UX surveys at the same time since you may disrupt your customers’ experience.
Allow Users to Opt Out Using Skip Logic
Your customers may not be comfortable answering every question. In this case, you need to ensure they can skip it by using the skip logic.
The user-centric approach not only respects individual preferences but also enhances the overall survey experience. This way, you can collect valuable insights from willing participants while respecting the autonomy of those who choose to opt-out.
Show Survey Progress
Want to increase customer engagement on your UX surveys? Start showing a progress bar at the top of your survey questions.
This way, customers know how many questions are left to answer, and they won’t feel anxious while taking the survey. You can try this functionality in the ProProfs Survey Maker software, which allows you to design surveys with progress bars.
Incentivize Your Surveys
You aren’t alone if you suffer from a high survey abandonment rate . Sometimes, even if your surveys are flawless, some customers may not go through with them since there is nothing for them in it.
So, why not give them something to look forward to?
You can incentivize your UX surveys with discounts, gift coupons, and deals so customers feel motivated to complete them to avail the benefits.
Related Read: 30+ Proven Ways to Reduce Shopping Cart Abandonment
Inside Udemy’s User Experience: How It Collects Critical User Insights
Udemy is an online learning platform offering free and paid online courses. Since the platform has users worldwide, their courses need to be sufficient for every student who speaks a different language.
Naturally, Udemy deployed machine learning algorithm-based captions, so the courses are accessible to everyone. To check on the user experience after this update and how effective it is, Udemy considered asking the users.
The company deployed Qualaroo’s UX survey on all their courses with auto-captioning, asking students if the captions are helpful and accurate so they can improve the service if need be.
With the feedback from the surveys, Udemy was able to make product optimizations that improved the caption editing capabilities for instructors. This feature made their content more accessible to people around the world.
UX Survey Examples: Templates & Questions
We have divided the UX survey examples based on survey types, making it easy for you to identify questions for every purpose.
Marketing Research Survey Template
Market UX research surveys are placed at the beginning of the customer journey when a new lead arrives at your website or mobile app. The surveys help understand new customers’ demographics to create customer personas .
[Related read: Lead Generation: A Complete Guide with Strategies and Example s]
- How did you first hear about us?
- Which other options did you consider before choosing our [Product name]?
- Which of the following best describes your role in the purchase process?
- Which of our competitors, both online and offline, did you consider before choosing our [Product name]?
- What comes to your mind when you think about our product/website?
- What are the main problems you want to solve with [Product]?
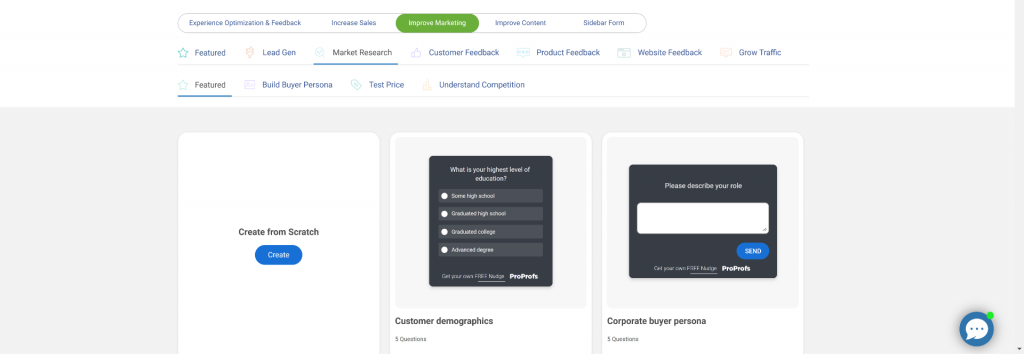
NPS Template
Use an NPS survey when your customers are deep in their customer journey and have used your product/service.
Once they have used it enough to form a genuine opinion, you can launch NPS on-site or in-app to gather feedback.
- What is the likelihood that you would recommend [company or product] to a friend or colleague?
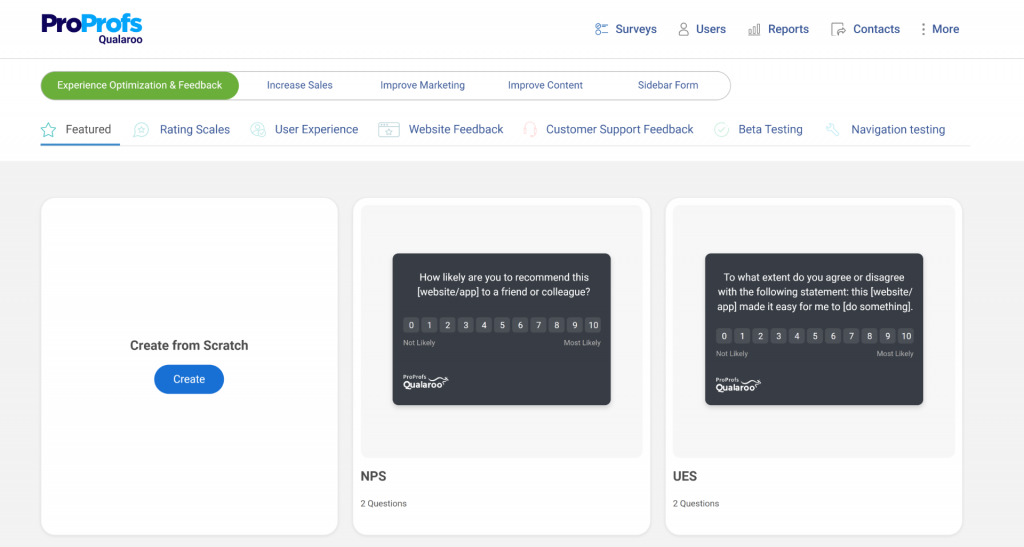
Customer Satisfaction Survey (CSAT) Template
You can also conduct CSAT surveys when customers have had the time to use your services/product for sufficient time so they can answer honestly. Here are a few CSAT question examples.
- If we ask you to rate our product/website out of 10, what score would you give us?
- How would you rate your overall satisfaction with our product?
- What could we have done better?
- How would you rate our service on a customer satisfaction scale of 1 – 10?
- Which of the following words would you use to describe our product/service?
- Impractical
- Poor quality
- How well does our product/service meet your expectations?

Exit-Intent Template
Exit-intent templates are deployed before the end of the customer journey when visitors are about to leave your website.
The survey helps you retain leaving visitors to turn them into customers and go through the customer journey.
- Did you find what you were looking for?
- Is there something missing on this page?
- What stopped you today from completing the purchase?
- Is there anything you would like us to help you with?

UES Template
You can use UES surveys when customers are actively using your tool so that the experience is fresh when they provide feedback.
This way, they can answer honestly about how much effort they had to make to achieve a goal with your product.
- To what extent do you agree or disagree with the statement: ABC product made it easy for me to do (mention activity/purpose.)

CES Template
Customer Effort Score surveys are deployed after a customer avails of any service to gauge how easy or difficult it was for them to do it.
- Do you agree with this statement? Customer support made it easy for me to resolve my issue.
- How easy is our product/website to use, in your opinion?

SUS Template
You can launch System Usability Scale surveys when customers are using your software product to see how it performs.
- I think I would like to use this [website/ product/ tool/ software] frequently.
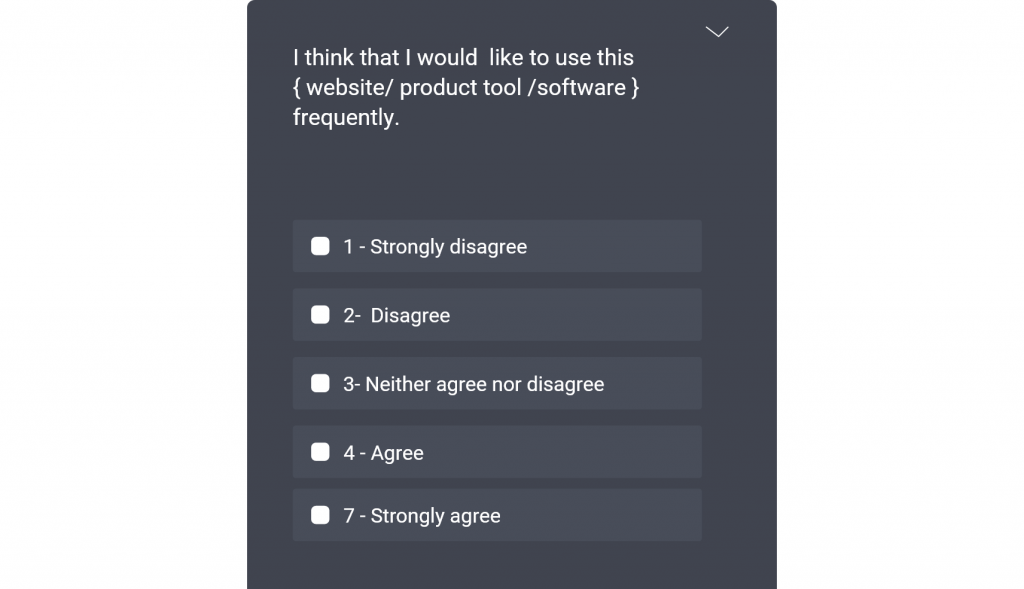
- I found the [website/ product/ tool/ software] unnecessarily complex.
- I thought the [website/ product/ tool/ software] was easy to use.
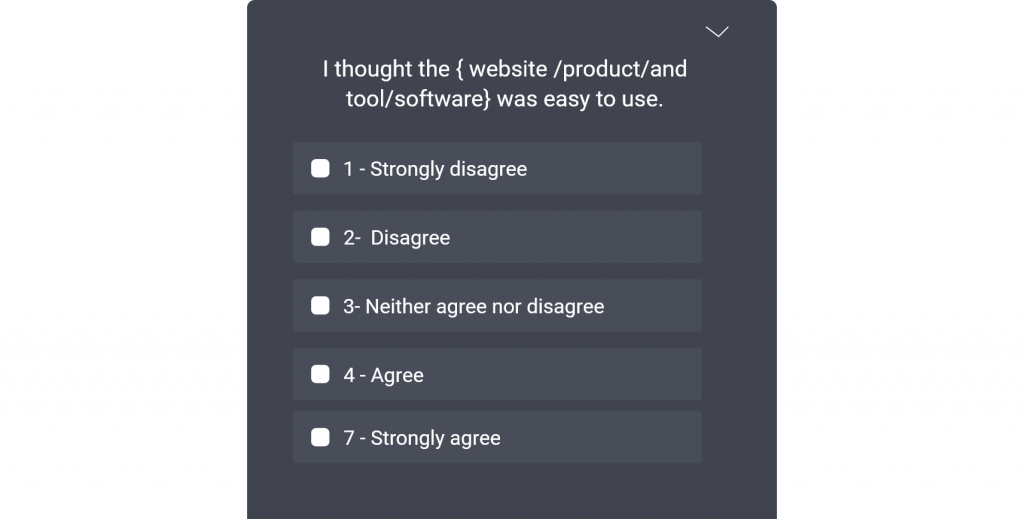
Product Opportunity Survey Template
Product opportunity surveys are placed in the middle of the customer journey to explore which features and services are most popular among customers and which ones are no longer relevant. You can also discover new and trendy features to add to your products and services.
- Is there anything here you never use?
- What would you change in our product if you had a magic wand?
- What are the three features most valuable to you in our product?
- Please name three crucial features you think we are missing in [Product]?

Other UX Survey Questions
- Please tell us about your experience with [Product]?
- How was your onboarding experience within the app?
- What products do you use other than ours to perform similar tasks?
- Is our pricing clear to you?
- Which payment/ delivery method do you prefer?
- Which features were confusing to you?
- How did you first learn about our product/website?
- What do you like the least/most about [Product]?
- What stopped you from getting our subscription?
- Please share with us the one time you found our product/service to be highly satisfying.
- On a scale of 1 to 10, how upset would you be if [feature name/product/service] was no longer available?
Revolutionize User Insights With Engaging UX Surveys
Now that you have a holistic view of user experience surveys, what’s stopping you from getting them for your business?
You can never go wrong in your user research with the right customer experience tool and the knowledge of creating delightful UX surveys.
You only have to implement what you know with the tool you choose. And in no time, you will have rich customer data to improve your customer experience.
Frequently Asked Questions
What are user experience (ux) surveys.
User experience surveys are a tool and a methodology used during user research, apart from A/B Testing , usability testing, task analysis, and more. UX surveys fetch quantitative and qualitative data that you can leverage to get a holistic view of your customer experience.
Pro Tip: If you wish to explore other methods besides UX surveys, we suggest giving our in-depth guide on user research a read.
You can conduct user experience surveys on digital products like websites, mobile apps, and prototypes at multiple touchpoints in a customer’s journey. You can also conduct UX surveys within your software products to understand how effective the design and features of your tool are.
What questions should I ask in a UX survey?
In a UX survey, focus on queries that reveal user experiences and preferences. Include questions about ease of use, satisfaction, and specific features. Ask open-ended questions for qualitative insights and use rating scales for quantitative data.
How do you plan a UX survey?
To plan a UX survey, define goals, target audience, and key metrics. Create a clear survey structure, incorporating a mix of open-ended and closed-ended questions. Pre-test the survey to refine it, and consider the timing and distribution channels for optimal results.
What response rate is good for a survey?
A response rate above 20% is generally considered good for surveys, but it can vary. Factors like survey length, relevance, and audience engagement influence response rates. Employing incentives and clear communication about the survey's purpose can enhance participation.
Why do user experience (UX) surveys matter?
Here are a few points to establish the importance of UX research surveys.
- They offer a cost-effective way to collect customers' insights of great value.
- Investors and stakeholders eat up statistics more than they trust gut instincts. UX surveys collect rich quantitative insights that add to your vision and help you make solid business proposals with numbers to support them.
- Collect feedback from your customers directly using user experience surveys on your website and mobile app about your products and services.
- UX surveys are great for collecting quantitative data to validate your hypothesis and back your qualitative insights .
- Conducting UX surveys facilitates iterations in products, services, and processes based on rich customer feedback.
- You can quickly identify your product and service's early adopters with the responses you get on your user research survey.
About the author
Shivani dubey.
Shivani has more than 3 years of experience in the modern creative content paradigm and technical writing verticals. She has been published in The Boss Magazine, Reseller Club, and HR Technologist. She is passionate about Artificial Intelligence and has a deep understanding of how organizations can leverage customer support technologies for maximum success. In her free time, she enjoys Nail art, playing with her guinea pigs, and chilling with a bowl of cheese fries.
Advisory boards aren’t only for executives. Join the LogRocket Content Advisory Board today →
- Product Management
- Solve User-Reported Issues
- Find Issues Faster
- Optimize Conversion and Adoption
How to design and conduct a UX survey

In order to understand who your users are, what they want to accomplish, and what they think of your product, you need to conduct user research. User research is the first phase of a design process as it gives you the opportunity to know who you are designing for, one of these research methods being surveys.

Utilizing UX surveys is a quick and simple way to learn more about your users, which is why it’s one of the most commonly employed research methods in the UX profession. In this article, I’ll show you how to design a UX survey and walk you through the tools I use in my UX survey process so you can improve your own survey skills.
Table of contents
- Closed questions
- Open questions
Why should you conduct a user survey?
Where to use surveys.
- How to design a user survey
- Tips on interpreting research survey
Tools for conducting a UX survey
- A UX case study
What is a UX survey?
A UX survey is used to collect information about users for a specific product. It is designed specifically for user research and testing. Surveys are an excellent way for user researchers and other developers to determine the needs of the people for whom they are designing as well as collect feedback after the product has been launched.
To make a survey effective, you need to ask the right questions, because asking the wrong questions will lead you to design in the wrong direction, resulting in products that no one will use.
Survey questions are of two types: open and closed questions.
Closed survey questions
Closed questions typically evoke a “yes” or “no” response. They are usually questions with checkboxes. These questions are used to better understand quantitative data. It does not dig deeper into why the users checked those boxes.
Open survey questions
Open questions are of a qualitative nature. They assist you in understanding the needs and behaviors of your users. It shows you how the user sees the problem. The answer type for these questions is typically large text boxes that allow users to elaborate further. “How does using this product make you feel?” is an example of such a question. Open-ended questions require a significant amount of time to analyze and synthesize.
As a user researcher, your goal is to learn more about your product’s users. Here are a few reasons why you should conduct a user survey to better understand your customers:
- To design a usable solution, your product must solve a problem. You can not solve a problem you know nothing about. This is why we use surveys: to identify user problems in order to design a universal solution
- A UX survey is relevant in exposing edge cases of a product. Apart from finding out the problem in the beginning, a user survey can also be used after launch to gather feedback on what the users think about the product, like a test record. This will help you understand where users find it difficult to use your product as well as features they enjoyed and places that need improvements
- UX surveys help designers uncover data that can help improve user experience. A user-centered design is equally important to a good-looking design. Surveys help us to find out from users areas that can improve their experience while using the app
- UX surveys are cost-effective when understanding users. Conversely, a designer could conduct ethnographic research, where you visit a specific location where the target audience is located and observe them using your products. It is usually expensive to do this type of research, unlike surveys which are cheaper and distributed online
- Unmoderated questionnaires can give very honest feedback. This is a good way to get unbiased data
There are a few research types that use surveys. Determining which stage of research you’re conducting will help you formulate your survey:
- Generative research : This is typically done at the start of the design process to generate more data and determine user needs
- Evaluative research : This can be done in the form of user testing during the design process
- Continuous research : This is more of a continuous survey to gather feedback from users at any given time in order to improve the experience
You can see how the different types of research will influence your survey questions, methodology, and target audience. For example, a survey for continuous research would be implemented into a purchasing flow so users are always welcome to provide feedback on the purchasing process
In this case, the target audience would be customers of the products not prospective users. You ask questions like, “How often do you use this product?” and “How would you describe your emotion when you find this product is unavailable?” These types of questions show how often they use your product and if it satisfies their needs.
For generative research, the target audience is prospective users, people who we think would find this product useful, and the survey questions are designed to let us know if these people actually need the product. You ask questions like, “Would you like to use a product that helps you order all your meals in one tap?” and “What product do you currently use to perform this task?” These help you understand user needs and find out competitors.
How to design a UX survey
UX research is an important part of the design process. But the research part must be done correctly; this means getting the right questions, setting the right goals, and using the right tools.

Over 200k developers and product managers use LogRocket to create better digital experiences
Here are tips for designing a good UX survey:
- Determine your goals and set expectations : Before you set out to create a UX survey, determine a set of goals and objectives for the research. What are you trying to find out from the survey? How would that help the design process? The goal can be designed by the product owner, stakeholders, or even the design team. The objectives and goal also explore the type of data you are planning to collect
- Prepare the questionnaire : Now that you have the goals written down and shared with the team, you can design questions. For best results, your questionnaire should be made up of open and closed questions and also give qualitative and quantitative results
- Recruit participants : This involves identifying the target audience for the research. Some companies have a list of users they can recruit for testing and research, while other companies have to outsource the research and look for communities with users. In either scenario, it is important that the designer and the team know who their target audience is and send the questions to them. The wrong target can also lead to wrong data. For example, if you’re building a software for kids, your target audience should be a mixture of parents and children, not teens or people without kids who have no use for the software
- A/B test different versions of your survey : Before sending out your survey, host mock test sessions within the team to see how each question flows into the next and if a question is necessary to the design solution
- Iterate the questionnaire : From the above step, make the necessary changes to your questionnaire before sending it out
- Pick channels to recruit participants : Your research participants are just as important as your research question if you ask the right questions to the wrong people, you may get an incorrect answer. So if your organization does not have a list of users, you can find communities to recruit participants
- Follow-up and feedback : Follow up on the surveys and respond to participant requests. This could be in the form of a call to action to contact you, or it could be as simple as inviting them to drop their emails for you to contact them
- Stay clear of biases : When setting up the questions, be aware of the biases you and your team might have and find ways to eliminate them in the design of the questionnaires. Sometimes people are not aware of their bias but it can be visible in their words and actions. Also, bias can affect your design solutions if you only choose responses that align with your personal beliefs. Give room for diversity by collecting all data and sorting it appropriately
- Make use of incentives to encourage users : Make use of incentives as a way for people to feel encouraged while filling out the survey. They could either be in form of gift cards, swags, or cash
- Use clear English : Depending on the survey type and target audience, use simple and clear English to ask questions. Frame questions in a way that persuades the user to be honest in their response. Keep the questionnaire short and simple; you can do this by creating a flow to the question
Tips on interpreting research surveys
Organize similar answers.
When sorting out your research data, identify how you want to sort the results. You can decide to group similar experiences, demographics, needs, etc. This can help you create a visual representation of the findings in a way that is manageable.
Use visuals or graphics to describe findings
Use visuals to interpret your findings. You can create personas, affinity maps, or user flows. It is an excellent method for communicating research findings to your team and other nontechnical or design members of your organization, such as stakeholders.
Work in teams and use whiteboards
Depending on the type and quantity of the data and also to avoid bias, it is important to share the data from the survey with your teams so you can all work on it. This gives room for innovation to spread through the diversity of the team. Everyone brings their unique problem-solving skills to the table. The team can decide what methods to use: a whiteboard, sticky notes, and so on.
SurveyMonkey
SurveyMonkey is among the first survey platforms launched on the internet. Its ability to handle complex routing has made it a researcher favorite.
The inbuilt recruitment capability is an important feature of SurveyMonkey. It also allows data to be exported and accessed by tools granted access. A con of this platform is that the setup takes a little bit of time and the fee option has a lot of limitations.

Google Forms
This is a beginner-friendly survey platform that can be accessed from your Google account. Google Forms allows for unlimited questions to be asked in a survey, but it is not a UX survey tool because there are some limitations to organizing and collecting data in comparison to other UX survey tools. It’s a great tool for gathering basic data.

Typeform is one of the most commonly used platforms to design aesthetically pleasing long-form surveys. It allows creators to personalize their surveys by adding follow-ups on previous responses. A con of this is that it redirects participants away from the platform, which interrupts their user experience.
Typeform is said to have an intuitive interface that makes it welcoming to users. With Typeform, you can connect the gathered data to popular apps such as Slack, Google Sheets, and more.

Zonka Feedback
This is a great survey tool and UX management platform. It offers an array of templates that make setting up easy and real-time alerts to designers so they can respond to feedback in a timely manner and close the feedback loop effectively to improve the user experience. It is also available offline!

A UX survey case study
This is a UX case study showing how UX surveys are designed.
Problem statement
NextUp is a non-governmental organization that supports underrepresented countries with basic amenities to make life easier.
Over the years, NextUp has successfully gathered a donor membership of about 3,000. This year, they hope to make the donor experience more exciting and inviting. To do this, NextUp has decided to send out a survey to understand their users and how to make donations on their platform a more seamless process.
Goals and objectives
- To identify ways to keep all their donors in one space, where they can easily track their donations and their impact
- To understand how users feel about donating in bulk versus choosing projects that align with their goals
- Find ways to motivate already existing donors and solicit other high-capacity donors to provide support

Survey questions
Here are a few questions I’ll be asking in a survey for the said problem: Remember to mix up your questions and put them in the right input field.
- Where are you currently located?
- How often do you donate on our platform? (You can support the participants by adding options like “often,” “always,” “annually,” etc.)
- What is a feature on the platform that excites you and why?
- What is a feature you’re least excited about and why?
- Which projects are you currently donating to? (This would have a list of projects offered and a check box to guide the participants).
A user experience survey can be designed in a variety of ways. To achieve the best results, it must be tested and improved upon before being released, like other design-related items. These may seem overwhelming to a new UX designer, but with the aid of codeless UX survey websites and a clear understanding of the research question, you can connect with relevant users and gather the data you need to enhance your product. The most important thing is to use the appropriate tools and design the proper questions.
LogRocket : Analytics that give you UX insights without the need for interviews
LogRocket lets you replay users' product experiences to visualize struggle, see issues affecting adoption, and combine qualitative and quantitative data so you can create amazing digital experiences.
See how design choices, interactions, and issues affect your users — get a demo of LogRocket today .
Share this:
- Click to share on Twitter (Opens in new window)
- Click to share on Reddit (Opens in new window)
- Click to share on LinkedIn (Opens in new window)
- Click to share on Facebook (Opens in new window)
- #ux research

Stop guessing about your digital experience with LogRocket
Recent posts:.

7 cognitive biases UX designers should know
Cognitive biases are key to effective UX design, as they reflect human psychology. This article recaps these UX cognitive biases and explains their impact on UX.

How to write an inclusive UX copy
Inclusive UX writing is essential for inclusive design. Without it, digital experiences can’t fully meet everyone’s needs. Here’s how to write inclusive copies.

Best practices for your next checkout design
There’s no silver answer, but here are best practices for a checkout design. Practicing these will help you boost your checkout conversion rates.

Creating your own color palette for your design project
Having a clear color palette helps you avoid color clashes, speeds up the design process, and allows you to focus more on other creative aspects of your work.

Leave a Reply Cancel reply
What is a UX Survey and How to Conduct One?

What are UX surveys and when should you, as a UX designer use them?
Conducting UX research and analyzing customer feedback helps you stay relevant to your customers and drive retention.
Isn’t that what every SaaS company is aiming for?
In this article, we’ll look into different types of UX surveys and equip you with the knowledge and best practices for conducting one.
UX survey is one of the most common UX research methods for getting both qualitative and quantitative insights from your users.
- User experience surveys are essential because they allow companies to determine areas of improvement, enhance the product and improve user experience .
- You should conduct UX surveys across all customer journey stages to identify what’s blocking users from progress.
- Types of UX surveys are CES, CSAT, and NPS surveys , all of which can have open or closed-ended questions.
Here’s how to design a survey step-by-step:
- Define your objective and understand what type of data you are looking for.
- Segment your user base to trigger surveys for the right audience.
- A/B test your survey and understand which version of it performs better.
- Analyze collected data to find loopholes in your product and service.
- Finally, close the feedback loop by thanking your respondents and keeping them updated on product improvements.
Here are some best practices for designing UX surveys:
- Keep things short and simple to motivate users to complete the survey.
- Make sure you avoid bias when designing your questions.
- Have an always-on feedback widget in your app instead of forcing users to answer pop-up surveys when they don’t want to.
- Include open and closed-ended questions in your UX survey to get more comprehensive and accurate data.
- Userpilot and Typeform are the best tools for conducting user experience surveys.
What is a UX Survey?
It helps you better understand customer behavior and determine what works and what doesn’t so you can prioritize improvements to your product’s UX.
Why do UX surveys matter?
As a SaaS company seeking sustainable business growth, UX surveys provide a cost-effective way to collect customers’ insights and make data-driven decisions.
UX surveys help uncover friction points in your product’s UX design and give you the right insights to optimize the user experience.
Improved user experience naturally reduces churn and increases retention.
When to conduct UX surveys
Gathering customer feedback isn’t a one-time thing, you should continuously collect and act on it.
It is important to conduct UX surveys at multiple touchpoints of the customer journey. It will help you determine what’s preventing your user from progressing through each stage so that you can eliminate those factors.
Analyzing the data will help you determine if certain features need to be enhanced or if a brand new feature is needed.
Types of UX survey
The type of user experience survey you should use depends on the kind of information you want to capture from them. This section will describe the various types you can deploy and the purposes they serve.
Customer effort score surveys
CES surveys determine how easy it is for users to interact with your product features. Customer effort spans various activities, including contacting support, using a feedback widget on your UI, or upgrading to a new tier.
A high score, in this case, means that users find your product easy to use to accomplish their goals.

Customer satisfaction surveys
A CSAT survey measures the level of satisfaction users have after engaging with your product or service.
In order to understand the overall level of satisfaction users have with your product, you should measure CSAT at different touchpoints within the user journey.

NPS surveys
NPS surveys give you insights into how loyal your customer is and help you proactively resolve problems that are making users unhappy.
Looking at the qualitative data collected with NPS surveys will get insights into what makes users stay loyal so you can replicate that experience to other relevant user segments.

Close-ended questions for collecting quantitative data
Closed UX survey questions will provide you with quantitative insights that are easy to gather and analyze.
These questions usually come with a radio button, checkbox, or other types of scale and number.
It’s advisable to start your surveys with one or two closed-ended questions to gather quantitative information with minimum user effort. Oftentimes, their response rates are higher because they are quick to respond and don’t require much thought.
Open-ended questions for qualitative research
After you’ve segmented the responses from your quantitative surveys, you should follow up with open-ended questions.
Using an open-ended question in your UX survey allows customers to give more qualitative insights into their expectations, experiences, and pain points.
Incorporating an open-text field in your survey requires more effort from users and your product team. But the insightful feedback you’ll receive can inspire significant UX changes that result in a better user experience.
Look at how Slack does it. They use predefined answers that help users self-identify and then give them the option to add details with an open-ended question type.

Step-by-step guide for designing a UX survey
Since we’ve discussed what UX surveys are and why they are important, let’s dive into the process of creating one .
Step 1: Determine your goals and set expectations
Before sending out a UX survey to your users, outline the end goal of the research.
What aspects of your product or design are you looking to improve? What are you trying to learn about your users?
Step 2: Design the survey
The next step is to convert your core objectives into UX survey questions. Ensure that the survey questions are relevant, straightforward, and contextual.
Then, decide on the type of survey that will best fit your needs.
This is also the stage where you decide the look and feel of your survey. Some pertinent questions you must ask yourself at this stage are:
- Would you use a multiple-choice question or leave open-ended ones?
- Would you rather use icons or numbers to gather quantitative data?
You can also decide on the strategic use of colors, fonts, and icons to ensure that the survey design aligns with your company branding.
Step 3: Recruit participants
It’s impossible to get relevant feedback from your audience if you’re not asking the right questions to the right users.
To recruit the right participants for your survey, segment your audience based on the objective of your survey.
For example, if you want to improve a specific feature, it makes sense to collect data from users who have used it more than once.

Step 4: A/B test different versions of your survey
You can run an A/B test to see if you can increase the response rate with minor changes to your survey. Think placement, the number of questions, when you trigger it, etc.
In Userpilot , you can embed different surveys into different UI patterns, and do A/B test experiments for a specific period of time to see which type of survey works best in which scenario.

Step 5: Analyze the collected data
Feedback analysis is probably the most crucial part of this process as it involves turning users’ qualitative and quantitative data into actionable insights that facilitate product improvement .
One way to analyze customer feedback is by tagging NPS survey responses.
NPS response tagging allows you to track low-score responses and uncover the patterns making your users give you a low score.

Step 6: Close the feedback loop
The last step in this process is to close the feedback loop by acknowledging your customers’ answers and letting them know you’re doing your best to improve the product and their overall experience with your brand.

UX survey best practices
Finally, let’s discuss the best practices for implementing UX surveys.
Keep questions short and simple
Your UX survey questions should focus on one point at a time. Since it takes less effort for respondents to answer short and simple questions, they are more likely to complete the questionnaire.
Make sure you are avoiding bias before you launch your survey. Here are a few things to keep in mind as you design your survey questions:
- The framing effect: asking questions in a way that prompts a specific answer from your users
- Unbalanced scale: similar to the framing effect, unbalanced scales will sway answers by limiting users’ choices
- Confirmation bias: seeking only the data that confirms your beliefs
Show surveys to relevant users
It’s vital to trigger surveys for relevant users only. Imagine a situation where you ask a user to give their opinion on a feature they haven’t used yet.
Weird, right?
You should aim to trigger surveys based on customer engagement and where they are in their journey. For example, if the user just used a certain feature, trigger a survey and ask them how was their experience with it and whether they would like to change anything about that feature.

Don’t force surveys on customers
Some users may not be in the mood to complete the survey whenever you want them to. Don’t cause friction by forcing them to fill out the form to continue using the product.
Allow them to skip the survey, or even better, offer an always-on feedback widget so they can share their ideas whenever they feel like it.
You can embed this on various pages inside your product so it comes in handy or add the option to submit feedback through your in-app resource center (you can build one code-free with Userpilot ).

Include both open-ended and closed-ended questions
We’ve already gone over why this is important.
Closed questions offer only a measure of quantitative data, while open-ended questions on their own are used for qualitative research. Although helpful, when used alone, these questions can limit the range of user feedback you collect when not used together.
A combination of these question types in your UX survey will result in accurate data and well-rounded insights into the user experience.
Offer incentives for completing long surveys and giving detailed feedback
Users don’t like filling out surveys with endless questions, so it’s better to design short surveys and then reach out to some of the respondents to ask them for detailed feedback.
To encourage your respondents, provide incentives for their time and effort.
Incentives can be in form of discounts, monetary compensation, or access to premium features in your app -the bigger the ask (aka the effort required to fill in the survey), the bigger the reward should be.

Best tools for conducting user experience surveys
There are numerous tools in the market for designing customized UX surveys. Let’s look at two of them: Userpilot – for short in-app surveys and Typeform – for longer-form surveys that can be embedded.
Userpilot is the best tool for conducting UX research using in-app microsurveys . These are short, timely, and contextual UX surveys that provide you with valuable insights.
With Userpilot’s advanced segmentation feature, you can trigger the microsurvey for the relevant audience and collect detailed feedback from the right users.
If you need more in-depth information from your respondents, creating a long-form survey is a better option. You can embed the Typeform survey form into your app using a modal for example.
This works better than sending it via email especially if you are trying to get feedback from active users. Ask them for feedback where they are, in a contextual way, of course.
Emails get ignored or missed. Embed your Typeform surveys in-app and increase the response rate.

Typeform is one of the best platforms to design beautiful long-form surveys.
With its branching pathways and logic jumps, you can further personalize your UX survey by triggering a new question based on the user’s previous responses.
However, this survey tool falls short because of its disruptive nature. Typeform redirects the user outside the app to answer the survey, thereby interrupting their product experience.

The process of designing a user experience survey would seem daunting when you consider all the techniques outlined in this article.
But when you use a tool and build surveys without code, it gets easier to reach relevant users and collect the insights needed to improve the product.
Get a Userpilot Demo and see how you can create targeted in-app surveys for better customer insights.
Leave a comment Cancel reply
Save my name, email, and website in this browser for the next time I comment.

Get The Insights!
The fastest way to learn about Product Growth,Management & Trends.
The coolest way to learn about Product Growth, Management & Trends. Delivered fresh to your inbox, weekly.
The fastest way to learn about Product Growth, Management & Trends.
You might also be interested in ...
What Is User Research, and What Is Its Purpose?
User research, or UX research, is an absolutely vital part of the user experience design process.
Typically done at the start of a project, it encompasses different types of research methodologies to gather valuable data and feedback. When conducting user research, you’ll engage with and observe your target users, getting to know their needs, behaviors, and pain points in relation to the product or service you’re designing.
Ultimately, user research means the difference between designing based on guesswork and assumptions, and actually creating something that solves a real user problem. In other words: Do not skip the research phase!
If you’re new to user research, fear not. We’re going to explain exactly what UX research is and why it’s so important. We’ll also show you how to plan your user research and introduce you to some key user research methods .
We’ve divided this rather comprehensive guide into the following sections. Feel free to skip ahead using the menu below:
- What is user research?
- What is the purpose of user research?
- How to plan your user research.
- An introduction to different research methods—and when to use them.
Ready? Let’s jump in.
1. What is user research?
User experience research is the systematic investigation of your users in order to gather insights that will inform the design process. With the help of various user research techniques, you’ll set out to understand your users’ needs, attitudes, pain points, and behaviors (processes like task analyses look at how users actually navigate the product experience —not just how they should or how they say they do).
Typically done at the start of a project—but also extremely valuable throughout—it encompasses different types of research methodology to gather both qualitative and quantitative data in relation to your product or service.
Before we continue, let’s consider the difference between qualitative and quantitative data .
Qualitative vs. Quantitative data: What’s the difference?
Qualitative UX research results in descriptive data which looks more at how people think and feel. It helps to find your users’ opinions, problems, reasons, and motivations. You can learn all about in-depth in this video by professional UX designer Maureen Herben:
Quantitative UX research , on the other hand, generally produces numerical data that can be measured and analyzed, looking more at the statistics. Quantitative data is used to quantify the opinions and behaviors of your users.
User research rarely relies on just one form of data collection and often uses both qualitative and quantitative research methods together to form a bigger picture. The data can be applied to an existing product to gain insight to help improve the product experiences, or it can be applied to an entirely new product or service, providing a baseline for UX, design, and development.
From the data gathered during your user research phase, you should be able to understand the following areas within the context of your product or service:
- Who your users are
- What their needs are
- What they want
- How they currently do things
- How they’d like to do them
As you consider the why of user research, remember that it’s easier than you might realize to overlook entire groups of users. It’s important to ensure that you’re conducting inclusive UX research and that starts in the earliest stages!
2. What is the purpose of user research?
The purpose of user research is to put your design project into context. It helps you understand the problem you’re trying to solve; it tells you who your users are, in what context they’ll be using your product or service, and ultimately, what they need from you, the designer! UX research ensures that you are designing with the user in mind, which is key if you want to create a successful product.
Throughout the design process, your UX research will aid you in many ways. It’ll help you identify problems and challenges, validate or invalidate your assumptions, find patterns and commonalities across your target user groups, and shed plenty of light on your users’ needs, goals, and mental models.
Why is this so important? Let’s find out.
Why is it so important to conduct user research?
Without UX research, you are essentially basing your designs on assumptions. If you don’t take the time to engage with real users, it’s virtually impossible to know what needs and pain-points your design should address.
Here’s why conducting user research is absolutely crucial:
User research helps you to design better products!
There’s a misconception that it’s ok to just do a bit of research and testing at the end of your project. The truth is that you need UX research first, followed by usability testing and iteration throughout.
This is because research makes the design better. The end goal is to create products and services that people want to use. The mantra in UX design is that some user research is always better than none .
It’s likely at some point in your UX career that you will come across the first challenge of any UX designer—convincing a client or your team to include user research in a project.
User research keeps user stories at the center of your design process.
All too often, the user research phase is seen as optional or merely “nice-to-have”—but in reality, it’s crucial from both a design and a business perspective. This brings us to our next point…
User research saves time and money!
If you (or your client) decide to skip the research phase altogether, the chances are you’ll end up spending time and money developing a product that, when launched, has loads of usability issues and design flaws, or simply doesn’t meet a real user need. Through UX research, you’ll uncover such issues early on—saving time, money, and lots of frustration!
The research phase ensures you’re designing with real insights and facts — not guesswork! Imagine you release a product that has the potential to fill a gap in the market but, due to a lack of user research, is full of bugs and usability issues. At best, you’ll have a lot of unnecessary work to do to get the product up to scratch. At worst, the brand’s reputation will suffer.
UX research gives the product a competitive edge. Research shows you how your product will perform in a real-world context, highlighting any issues that need to be ironed out before you go ahead and develop it.
User research can be done on a budget
There are ways that you can conduct faster and less costly user research , utilizing Guerrilla research outlined later on in this article (also handy if budget and time are an issue). Even the smallest amount of user research will save time and money in the long run.
The second challenge is how often businesses think they know their users without having done any research. You’ll be surprised at how often a client will tell you that user research is not necessary because they know their users!
In a 2005 survey completed by Bain, a large global management consulting firm, they found some startling results. 80% of businesses thought they knew best about what they were delivering. Only 8% of those businesses’ customers agreed.
The survey may be getting old, but the principle and misperception still persist.
In some cases, businesses genuinely do know their customers and there may be previous data on hand to utilize. However, more often than not, ‘knowing the users’ comes down to personal assumptions and opinions.
“It’s only natural to assume that everyone uses the Web the same way we do, and—like everyone else—we tend to think that our own behavior is much more orderly and sensible than it really is.” (Don’t Make Me Think ‘Revisited’, Steve Krug, 2014.) A must on every UX Designer’s bookshelf!
What we think a user wants is not the same as what a user thinks they want. Without research, we inadvertently make decisions for ourselves instead of for our target audience. To summarize, the purpose of user research is to help us design to fulfill the user’s actual needs, rather than our own assumptions of their needs.
In a nutshell, UX research informs and opens up the realm of design possibilities. It saves time and money, ensures a competitive edge, and helps you to be a more effective, efficient, user-centric designer.
3. How to plan your user research
When planning your user research , it’s good to have a mix of both qualitative and quantitative data to draw from so you don’t run into issues from the value-action gap, which can at times make qualitative data unreliable.
The value-action gap is a well-known psychology principle outlining that people genuinely don’t do what they say they would do, and is commonly referred to as what people say vs. what people do.
More than 60% of participants said they were “likely” or “very likely” to buy a kitchen appliance in the next 3 months. 8 months later, only 12% had. How Customers Think, Gerald Zaltman, 2003
When planning your user research, you need to do more than just User Focus Groups—observation of your users really is the key. You need to watch what your users do.
Part of being a great user researcher is to be an expert at setting up the right questions and getting unbiased answers from your users.
To do this we need to think like the user.
Put yourself in your user’s shoes without your own preconceptions and assumptions on how it should work and what it should be. For this, we need empathy (and good listening skills) allowing you to observe and challenge assumptions of what you already think you know about your users.
Be open to some surprises!
4. When to use different user research methods
There’s a variety of different qualitative and quantitative research methods out there. If you’ve been doing the CareerFoundry UX Design course , you may have already covered some of the list below in your course.
It isn’t an exhaustive list, but covers some of the more popular methods of research. Our student team lead runs through many of them in the video below.
Qualitative Methods:
- Guerrilla testing: Fast and low-cost testing methods such as on-the-street videos, field observations, reviews of paper sketches, or online tools for remote usability testing.
- Interviews: One-on-one interviews that follow a preset selection of questions prompting the user to describe their interactions, thoughts, and feelings in relation to a product or service, or even the environment of the product/service.
- Focus groups: Participatory groups that are led through a discussion and activities to gather data on a particular product or service. If you’ve ever watched Mad Men you’ll be familiar with the Ponds’ cold cream Focus Group !
- Field Studies: Heading into the user’s environment and observing while taking notes (and photographs or videos if possible).
- In-lab testing: Observations of users completing particular tasks in a controlled environment. Users are often asked to describe out loud their actions, thoughts, and feelings and are videoed for later analysis
- Card sorting : Used to help understand Information Architecture and naming conventions better. Can be really handy to sort large amounts of content into logical groupings for users.
Quantitative Methods:
- User surveys: Questionnaires with a structured format, targeting your specific user personas. These can be a great way to get a large amount of data. Surveymonkey is a popular online tool.
- First click testing: A test set up to analyse what a user would click on first in order to complete their intended task. This can be done with paper prototypes, interactive wireframes or an existing website.
- Eye tracking: Measures the gaze of the eye, allowing the observer to ‘see’ what the user sees. This can be an expensive test and heatmapping is a good cheaper alternative.
- Heatmapping: Visual mapping of data showing how users click and scroll through your prototype or website. The most well-known online tool to integrate would be Crazyegg.
- Web analytics: Data that is gathered from a website or prototype it is integrated with, allowing you to see the demographics of users, page views, and funnels of how users move through your site and where they drop off. The most well-known online tool to integrate would be Google Analytics .
- A/B testing: Comparing two versions of a web page to see which one converts users more. This is a great way to test button placements, colors, banners, and other elements in your UI.
Further reading
Now you know what user research is and why it’s so important. If you’re looking for a way to get trained in this particular discipline, there’s good news—owing to demand and popularity, there’s a growing number of UX research bootcamps out there.
If you’d like to learn more about UX research, you may find the following articles useful:
- What Does A UX Researcher Actually Do? The Ultimate Career Guide
- How to Conduct User Research Like a Professional
- How to Build a UX Research Portfolio (Step-by-Step Guide)
User research is the process of understanding the needs, behaviors, and attitudes of users to inform the design and development of products or services. It involves collecting and analyzing data about users through various methods such as surveys, interviews, and usability testing.
2. How to conduct user research?
User research can be conducted through various methods such as surveys, interviews, observations, and usability testing. The method chosen depends on the research goals and the resources available. Typically, user research involves defining research objectives, recruiting participants, creating research protocols, conducting research activities, analyzing data, and reporting findings.
3. Is user research the same as UX?
User research is a part of the broader UX (User Experience) field, but they are not the same. UX encompasses a wide range of activities such as design, testing, and evaluation, while user research specifically focuses on understanding user needs and behaviors to inform UX decisions.
4. What makes good user research?
Good user research is characterized by clear research goals, well-defined research protocols, appropriate sampling methods, unbiased data collection, and rigorous data analysis. It also involves effective communication of research findings to stakeholders, as well as using the findings to inform design and development decisions.
5. Is user research a good career?
User research is a growing field with many opportunities for career growth and development. With the increasing importance of user-centered design, there is a high demand for skilled user researchers in various industries such as tech, healthcare, and finance. A career in user research can be fulfilling for those interested in understanding human behavior and designing products that meet user needs.
Verifying that you are not a robot...

- SaaS Growth Tactics
User Experience Surveys: How to Learn More About Your Users (14 Real-World Examples)
User experience surveys are often the missing link in the growth story of SaaS companies.
While analytics data shows you what users are doing on your website and how they’re using your product, the “ why ” behind their action can only be uncovered through surveys and customer interviews.
So, to help you get started, we’ve put together a complete guide to running user surveys. You’ll discover what user survey types you could run for your SaaS. We’ll also share tips on how to create effective user surveys. You’ll learn the types of questions to ask (and also, what makes a good question in a user survey), to using the insights you’ve gathered to grow your SaaS.
NOTE: We’re sharing many user survey examples in this post. We’ve made all the effort to ensure that those examples are suitable for early-stage SaaS startups, as well as fast-growing scale-ups.
We start with a couple of user research survey examples, continue with user experience survey templates, and wrap up with churn prevention surveys.
So let’s dive in!
User surveys vs. micro-surveys
Before we dive into the use cases and examples, a quick note on user surveys versus micro-surveys.
User surveys are, typically, more extensive and performed when you need to gather more in-depth customer feedback. Typical user questionnaires are more suitable for e-mails or interviews, as they touch upon several themes, and might seem complex feedback through open-ended questions, for example.
Most often, user surveys are a one-time effort and their purpose is to help you improve your UX, CX and adjust your long-term product strategy and roadmap.
Micro-surveys on the other hand are always-on and their purpose is to gather continuous user feedback.
User survey tools help you better understand who your users really are, track customer satisfaction, or get feedback on new product features.

Refiner is a user survey tool that allows you to launch high converting survey widgets (also referred to as popup surveys ) right within your SaaS or send them to your users by email. They can be launched in minutes, are contextual, quick to fill out and have awesome response rates!
Moreover, you can use the collected data to power automations and to make informed decisions in an agile manner, without spending too much time or resources.

Make sure to check our live demo or create a free trial if you want to see how the Refiner surveys would look on your website on inside your SaaS app!
How to Create Effective User Surveys
Without a doubt, surveys are one of the simplest ways to gather feedback and insights about your users. And just like we’ve shown you above, running specific micro-surveys works particularly well for SaaS companies, and meets their requirements for data.
In spite of the differences between user surveys, other business run, and what you should be doing as SaaS, there are certain general rules to follow when surveying your users.
#1. Writing Survey Questions
Let’s not sugarcoat it; the survey question will make or break your research. A good question will deliver reliable and insightful answers. A poorly chosen question, however, might deter people from even participating in your survey.
In general, you can use two types of questions in the survey:
Closed questions give participants a selected number of potential answers. Good examples of closed ended questions include multiple choice questions, yes/no questions, likert scale questions, and so on.
Closed questions work well when you’re collecting quantitative data, using devices like rating scales to gauge general attitudes of your users.
The opposite of those are open ended questions which respondents can answer any way they want. Open questions ask the person to give the opinion or answer in their own words, and work best if you’re conducting qualitative research. In this case, users can decide how they want to answer questions. They can write a long or short answer, provide examples and explanations of their decisions, and so on.
Both question types have their pros and cons, of course.
With closed ended questions, a question that’s not easy to understand may lead to confusing answers that contain no insight you could use.
At the same time, open ended questions may lack responses in the available options a person might choose from.
#2. The Language
I’ve alluded at this above, but the issue of language and tone of voice warrants a separate discussion.
Your language – how you construct the question and what tone of voice you’ll use will affect more than just the type of responses you’ll get. For one, too complex questions (or available options) might deter a person from even wanting to complete the survey.
Similarly, confusing language will, most likely, lead to unusable responses.
As a general rule, keep the language simple, and explain what you are asking about clearly. Don’t use jargon or any abbreviations. Although they might seem obvious to you, your respondents might only find them confusing.
Users surveys that help you understand your target market
The first category of user surveys is all about better understand your target market. Read on for detailed description or watch the video below for a quick overview.
1. Prospect and customer interviews in the early stages
When you acquire your first users, you may be tempted to already send a survey to understand what made them choose your product.
Yet, at this stage, it is usually more effective to interview your customers instead of asking for their feedback through email.
The initial interviews with prospects and customers serve three main goals :
- they help you profile your ideal customer
- they tell you which channels you should explore to speed up your growth
- they help you identify your competition and differentiate your product
For example, if you’re selling a B2B SaaS product, you may want to interview a couple of prospects or your first customers to find out:
- What’s the best way to reach them? Do they prefer cold calls or emails, do they read specific publications or follow specific accounts?
- What are their decision-making criteria? What are they looking for in a product like yours? What would move the needle or make them go for a competitor?
- What kind of sales collateral are more likely to convince them? Do they prefer to see product demos? Do they like to attend webinars, or just want to try the product before buying it?
- What were they searching for when they found you? If they reply with specific keywords, or with competitor names, you know that your product is seen as an alternative to something.
Once your customer base is big enough, you can start collecting this type of information through surveys.
So when should you schedule these customer interviews?
As early as possible in the product lifecycle. If you have a prototype or MVP and you think your ideal customer is Performance managers in medium-sized companies, reach out to a few people with this job title and show them the prototype.
If you wait for too long, you risk investing a lot of time and money into something that is not needed, wanted, or just doesn’t stand out.
2. SaaS micro-surveys that make customer segmentation easier
These surveys should be launched early on in the user’s lifecycle, for example during a free trial. They let you segment your user based by common traits such as their industry, their role, team size and the department they are working. If you’re selling a B2B product, ask mostly questions that will help you determine whether the currently is the end user or the decision maker.
For example:
What is your industry?
What describes best the department you are working in?
How big is your team?
What is your job title?

3. SaaS user surveys to identify high-value accounts
User surveys are an excellent tool for lead qualification or lead scoring. If you’re just starting and don’t have the most complex CRM or automation flows in place, you can use SaaS surveys for the initial segmentation of your customer base.
Based on the company size and job titles of your respondents, you can split them into high-value accounts and leads that aren’t hot prospects yet.
To do this segmentation, you can ask questions like:
How many hours do you save per week using our product?
How many colleagues are using our product?
Who else (job titles) do you think would benefit from our product?
What product did our solution replace?
Once you know which type of account finds your product more valuable and how exactly you’re helping them, you can focus your marketing and sales efforts on companies that fit your ideal customer profile.
For example, instead of creating content for all potential customers, you can focus only on those content types and topics that correspond to the pain points of your ICP.
In the same way, you can create ad campaigns that target only companies that fit your high-value accounts.
User surveys to improve product features
The second category of user surveys is about improving your product. For a quick overview, you can watch our video on product surveys before diving into details further below.
1. Product-market fit micro-surveys for SaaS companies
This questionnaire aims to determine if you’ve achieved product-market fit (PMF).
Since Rahul Vohra from Superhuman shared their PMF survey publicly , it became quite standard as a growth marketing approach.
However, it can be a tricky one if you don’t choose your words carefully.
The general guideline is to ask your customers how disappointed would they be if they could no longer use your product starting next week. So your micro-survey could look like this:
How would you feel if you could no longer use our product? Answer options: very disappointed, somewhat disappointed, not disappointed.
What type of people do you think would most benefit from YOUR PRODUCT?
What is the main benefit you receive from YOUR PRODUCT?
How can we improve YOUR PRODUCT for you?
If more than 40% of your respondents say they’d be very disappointed, then you’ve achieved P/M fit and your product has growth potential.

However, if you send this survey at the wrong moment, you risk scaring your customers away. So it’s crucial to only ask for this feedback in the initial stages of product growth, before reaching the mainstream market.
As an alternative to the questions above you can try asking different follow-up questions.
For example, for finding out why someone said they wouldn’t be disappointed, you could ask questions like:
What would make you change your answer? You can give them some options, such as price change, other features, other integrations etc.
What features are missing from our product?
If you had to replace our product with an alternative, what would that be and why?
2. Pricing surveys for determining the best product price
Once you know that your product does have potential for growth, it’s time to confirm that your pricing model is the right one.
If you’ve started with a free trial model, you might discover that most of the early adopters aren’t actually interested in upgrading. So the next questionnaire will help you understand how much users are actually willing to pay for your product.
This user survey leverages the Van Westendorp’s price sensitivity meter and can be sent via email or can be displayed inside the product . Choose the delivery method based on the channel where users are more engaged.
For example, if most customers use your product daily, in-product surveys might be a good idea. On the other hand, if the email engagement is good and your product is only used occasionally, you may want to opt for email surveys.
Here are the questions to ask:
At what price point would you consider our product too expensive? Give them 3-5 options to choose from.
At what price point would you feel that you’re getting the best value for money, from our product? Again, give them 3-5 options to choose from.
3. SaaS user questions to collect feature feedback
A common challenge in the early development stages of a SaaS product is deciding what feature from the backlog to prioritize and what to postpone.
At the same time, as a SaaS owner or product manager, you might find it challenging to decide which feature to use as your product’s main USP.
Which of the following product features are most important to you? As possible answers, show 4-5 core features or your product.
In such cases, a quick micro-survey can help you collect feature feedback and understand which product feature your ideal customers consider more valuable.
You can also ask for importance of one specific features.
How important is [feature xyz] to you? Provide a 1-5 scale as answer options where 5 means ‘Very important”.
The key here though is to collect this feedback in a structure manner and to associate the responses with the customer segments.
This way you avoid building or emphasizing features that are nice to have for most of your customers, but don’t make a difference for your high-value users.
Regardless of the score, you can follow up with a question like “ What other features would you like us to build? ”. Give them a few options to choose from, or leave it as an open question.
This way you’re not only gathering feedback on your current features, but you’re also gaining a better understanding of the product characteristics that would make you even more valuable for your target users.
4. User surveys to find UX gaps and determine the customer effort score (CES)
This type of survey has two goals:
- On the one hand, it aims to show you how your customers perceive your product and the UX it offers;
- On the other hand, it’s a good predictor of customer churn; a product that’s easier to use is more likely to retain its customers.
When should you send this type of survey? In most cases, you want to measure the ease of doing business with you, so this type of questionnaire is usually sent after a conversion (purchase, sign up, registration) or after a user contacted your customer support team.
You can ask questions like:
What were you trying to accomplish with our product today? Did you manage to do it?
On a scale of 1-5, how easy was it to accomplish your goal?
Was was the purpose of your visit today?
Was there anything that you didn’t manage to accomplish today? If they reply ‘Yes’: Can you tell us more?
SaaS surveys to measure customer satisfaction
The third category of user surveys is about measuring and keeping track of customer user satisfaction. For a quick overview, you can watch our video below, or dive into details further below.
1. NPS surveys to find promoters
NPS surveys help you measure your Net Promoter Score, thus they give you an indication of what percentage of users are likely to turn into promoters or advocates for your brand.
For a basic NPS survey, the common question to ask is
How likely are you to recommend us to a friend or colleague?
Give users the possibility to choose from a scale from 0-10, and regardless of their choice, follow up with a question that tells you more about the “why” behind their response.

A decent NPS survey tool should give you the possibility to customize your NPS question, as well as customizing follow-up questions.
Depending on your use-case you might want to ask a freeform text question as shown in the screenshot above, or follow-up with a multiple choice question.
At Refiner we are convinced that NPS surveys are not just about measuring “How good you are doing”. We think that the real added value of NPS comes by (personally) following up on NPS feedback.
We’ve detailed NPS follow-up surveys in a separate article, where we’ve shared 17 templates that you can use right away. Feel free to copy-paste them!
2. CSAT surveys to evaluate customer experience (CX)
Customer satisfaction surveys (CSAT) enable you to gauge how your customers feel about your product and the experience it offers.
You can use the results of CSAT surveys to measure overall customer satisfaction over time, to segment users based on satisfaction score or to find opportunities for improving your CX.

Please note that in the context of SaaS the term “customer” and “user” are often interchangeable. CSAT surveys are often referred to as User Experience Surveys. Likewise, people tend to replace Customer Experience (CX) with User Experience (UX) and vice versa.
The most popular user experience survey question to ask is without doubt:
How satisfied are you with our product?
Give them a scale from 1-5 to choose from. If they choose 4 or 5, follow up with a second question along the lines of:
What do you value most about our product?
If their initial score is 1-3, you can ask them what they think you could improve.
User surveys to engage SaaS customers and prevent churn
1. Surveys to determine your most effective marketing channels
Although you can see which channels attract more users in your analytics dashboard, you may want to dig a bit deeper and find out what types of customers each channel attracts.
So you can run website or in-product surveys not only to profile your visitors and customers, but also to ask them how they found you.
In this case, your user survey can include questions like:
How did you hear about us?
Or the variant
What were you searching for when you found us?
How did you find us? List 3-4 channels and add an empty field for ‘Other’ channels
Did anyone refer you to our product? If yes, who and in which context?
Would you tell your connections/friends about our product? If yes, follow up with “How would you describe it? What channel would you use?”
2. SaaS surveys to activate users
If you have users who have signed up or registered for your product but didn’t try it out, you can activate them with bumper surveys. These should be sent via e-mail and serve two goals: to remind inactive users why they’ve signed up in the first place, and what your product helps them achieve.
An example would be a welcome email where you ask the user “Why did you sign up to use our product?”, and give them a few options to choose from. These options should be your main USPs, key outcomes or use cases.
You can follow up with activation surveys where you ask users what were they trying to achieve when they’ve signed up, and whether they received that value from your product already.
Depending on their answer, you can follow up with usage tips emails where you show them how to achieve the desired outcomes.
3. Surveys to collect reviews and testimonials
For a starting SaaS product, customer testimonials and reviews can really make a difference, so this is one of the most important category of micro-surveys that you should be sending out.
You can start by asking the following questions:
How likely are you to recommend our product to a friend or colleague?
Give them a scale from 0 to 10 to choose from. If they select a number in the 0-7 range, ask them ‘What can we do better’?
If they select a number between 8-10, ask them to leave a review or testimonial.
On a scale from 0-10, how happy are you with our product?
What is the value that you are receiving from our product?
How does our product help you in your day-to-day work?
If you have users who wouldn’t recommend the product because it’s not clear enough how to use it, or because it doesn’t satisfy their needs, ask if you can schedule a call to go a bit more into detail.
4. SaaS surveys to prevent churn of dormant users
These last two types of surveys should be sent by e-mail, and work the best when accompanied by phone interviews.
Their purpose is to help you understand why users aren’t interacting with your product, as well as which segments or types of users are more likely to stick around or churn.
For dormant users, a simple but effective question to ask is “can you tell us why?”. Here’s an example:
Hey [user], I’ve noticed you haven’t tried [product] yet, can you tell us why?
Does [product] live up to your expectations? If not, can you tell us why?
What can we do to make our product/your experience better?
If they say that the price of the product after the free trial is too high for example, you can try to win them back by offering a discounted price for the first months, or for referring a colleague.
5. Surveys to understand why customers churned
Similar to the previous questions, this SaaS user survey is meant to help you understand the reason behind customer churn.
Again, try to keep the initial questions simple and focused, and follow up with a request for a phone interview if you want to dig deeper.
Here are some sample questions you can ask:
What’s the primary reason for cancelling your account/subscription?
Give them some options to choose from, such as “I found an alternative”, or “The price is too high”, or “ I only needed it for a one-time project” etc.
Can you tell us why didn’t you use our product and what would make you change your mind?
How can we make our product better? What features would make you give it a try?
Why did you initially sign up for our product? What happened since then?
We help SaaS & digital product teams to better understand the needs of their users. Make better product decisions, find upsell opportunities and send ultra-personalized campaigns to retain more customers.
What are the Go-to User Survey Tools for SaaS?
Obviously, there are many different types of User Survey Tools. Each with its own set of features and speciality.
In a nutshell, we see three types of user survey tools:
- Survey software that tries to cover many different use-cases for a broad variety of customers.
- Tools that focus on one single use case, for example a dedicated NPS survey tool.
- Tools that support various use-cases but focus exclusively on one type of customer
At Refiner, we fall in the third category. We offer a versatile micro-survey tool for SaaS businesses who want to experience fast growth.
Choosing the right tool for your needs is important as there is no such thing as a one-size fits all customer survey tool.
This is why we’ve put together a full guide on How to choose the right Customer Survey Tool for your SaaS .
Let’s wrap it up …
I hope you’ll find the sample SaaS surveys in this post useful!
If you have any questions about user surveys or user user survey tools, please reach out to us. We are already looking forward to hearing from you!
Related posts

What is Product Feedback Survey (+ 59 Best Questions to Ask)

How (and Why) You Should Collect In-app Feedback

How to Get the Most Out of In-app Feedback: 11 Best Practices

What are In-app Notifications and Why You Must Be Using Them

8 In-app Messaging Best Practices for SaaS

What is In-app Messaging: Everything You Need to Know

What is Product Research: A Guide for Founders

Which Survey Tool Is Best for UX Research? (10 Suggestions)

10 Questions to Ask in a Product Market Fit Survey

Product Discovery Process: The Do’s and Don’ts (and Everything Else You Need to Know)
- Legal Notice
- Privacy Policy
- Terms of Service
Cookie consent
We use our own and third-party cookies to show you more relevant content based on your browsing and navigation history. Please accept or manage your cookie settings below. Here's our cookie policy
Join us for a live Typeform for Growth demo 📈
- Product Overview
- For Enterprise

- Form builder Signups and orders
- Survey maker Research and feedback
- Quiz maker Trivia and product match
- Find Customers Generate more leads
- Get Feedback Discover ways to improve
- Do research Uncover trends and ideas
- Marketers Forms for marketing teams
- Product Forms for product teams
- HR Forms for HR teams
- Customer success Forms for customer success teams
- Business Forms for general business
- Form templates
- Survey templates
- Quiz templates
- Poll templates
- Order forms
- Feedback forms
- Satisfaction surveys
- Application forms
- Feedback surveys
- Evaluation forms
- Request forms
- Signup forms
- Business surveys
- Marketing surveys
- Report forms
- Customer feedback form
- Registration form
- Branding questionnaire
- 360 feedback
- Lead generation
- Contact form
- Signup sheet
- Help center Find quick answers
- Contact us Speak to someone
- Our blog Get inspired
- Our community Share and learn
- Our guides Tips and how-to
- Updates News and announcements
- Brand Our guidelines
- Partners Browse or join
- Careers Join our team
- → 41 user experience (UX) survey questi...
41 user experience (UX) survey questions [examples + template]
User experience survey questions gauge your strengths and weaknesses from the folks using your services. Find out what to ask on your next UX survey.

Latest posts on Tips
Typeform | 07.2024
Typeform | 06.2024
Products and services are nothing without their users. If you’re investing your time, money, and resources into building something, it has to align with your target audience. But how do you know what your audience is thinking? That’s where UX questionnaires come into play.
By choosing the right user experience survey questions, you can gain insight into what your audience thinks about your product or service. You can better understand the “why” by customizing your UX survey to multiple audiences—learn what’s working, areas that need improvement, and how to improve your overall UX. To kick things off, let’s take a look at user experience feedback questions, best practices, and a customizable template for success.
Research-based user experience survey questions

The first step in UX questionnaires is to gain insight into the person completing it. You’ll want to ask questions that cater to the specific respondent, including demographic questions , the issues they are facing, solutions they’ve tried, and more. Here are some research-based user experience survey questions to help get the ball rolling:
1. Please provide your demographic information (age, gender, location, income, education, occupation)
2. Please describe the current issue you're facing, including details about the type of issue (e.g., technical, usability, content-related) and where it occurs in the [product/service].
3. What solutions have you attempted to resolve this problem, and how effective were they?
4. How much time did you spend on this issue?
Usability survey questions

Now that you’re more familiar with the person taking the survey, it’s time to ask those hard-hitting questions related to usability. With these types of user experience survey questions, you can better understand which elements are or are not working from their point of view. Asking usability questions is one of the best ways to receive non-biased insights you can then apply to improve your system.
5. Does [product] match your expectations?
6. What are the most important elements?
7. What are the least important elements?
8. Is there anything you want us to add or change about [product]?
9. What is the hardest/most challenging part about using [product]?
10. Rate the ease of finding the features you were looking for.
Design-based user experience survey questions

Similar to usability, design-based UX survey questions can help you better understand which features are or are not working. These questions include topics regarding the screen’s layout, interface design, navigation, menu, and more. Include these user experience survey questions if you want to gain insight into the strengths and weaknesses of your software design.
11. What are you trying to accomplish on the screen?
12. Do the menu options make sense?
13. Are there any elements you find distracting or unnecessary?
14. Is there anything we should add to the screen?
15. How would you rate the overall navigation experience?
Survey questions about appearance

While appearance might not seem like it’s the most important consideration, aesthetics play a major role in your brand image . Appearances help build brand awareness and impact how the public perceives your products or services. Make sure to include these appearance-specific questions in your user experience survey to gauge where you need to improve:
16. What was your first impression when you entered the website/app?
17. What do you think of the color scheme?
18. Is there anything you would change about the visual design?
19. How would you rate the overall visual appeal of this page?
Accessibility survey questions

Accessibility should be a top priority when deciding which user experience survey questions to include. When you build your services and products around inclusivity, you expand your customers and cater to all needs. Here are a few questions surrounding accessibility to ensure you’re guiding improvements for more inclusive experiences :
20. How would you rate [product]’s accessibility features?
21. Are there any accessibility barriers you encountered while using [product]?
22. Did you find it easy to adjust the font size, spacing, and access multimedia elements with proper captions or transcripts?
23. Is there anything different you would like to see when it comes to accessibility?
Support and error-handling survey questions

Using a new product or service is no easy feat, and you don’t want your users to become frustrated. To ensure your customers feel supported, include the following questions in your UX survey:
24. How helpful were the error messages or prompts you encountered while using [product]?
25. Did you feel supported in resolving errors or issues while interacting with [product]?
26. Did you feel that your issue was resolved in a timely manner by our support team?
27. How satisfied are you with the availability of support channels (email, chat, phone)?
28. Are there any additional support features or resources you’d like to see us implement?
Feedback survey questions

You want to make sure your users’ voices and opinions are heard. After all, your customers are the lifeblood of your company. To avoid losing any valued customers, include these feedback survey questions:
29. Did you encounter any obstacles or challenges while attempting to provide feedback within [product]? If yes, please specify.
30. Were you able to easily locate the feedback option within [product] interface?
31. Did the product team adequately acknowledge and address your feedback?
32. How likely are you to use the feedback feature again?
Security-based user experience survey questions

Security is another important feature you shouldn’t overlook when designing your product. It’s also important to update security measures as needed to reduce the chances of a data breach. Here are some security-related questions to include in your UX survey:
33. How confident are you in [product]’s security measures?
34. Did you encounter any privacy or data security concerns while using [product]?
35. Have you ever hesitated to provide sensitive information within [product] due to concerns about security?
36. Were you made aware of any security incidents or breaches related to [product]?
37. What additional security features or measures would enhance your confidence in using [product]?
Closing user experience survey questions

Not sure how to close out your user experience survey? Here are some closing questions to round out your UX questionnaire:
38. How often do you use [product]?
39. Would you recommend [product] to others? If not, why?
40. What other companies are you considering using?
41. Is there anything else you would like to share?
What is a user experience survey?
User experience surveys help business professionals gather qualitative and quantitative data so they can make informed decisions regarding design, functionality, accessibility, and overall user satisfaction. By conducting a UX questionnaire, you can take a closer look at why people use your product, service, or system, any roadblocks they’ve encountered, how satisfied they are, and much more. These surveys are designed to identify pain points, preferences, and different ways to improve.
This type of questionnaire typically consists of structured user experience survey questions covering various aspects of the user experience, such as usability, accessibility, design, and overall satisfaction. These questions could address features, user interface, ease of use, and potential challenges. UX survey responses will then provide valuable insights into areas that work well or need improvement to enhance the overall user experience.
Best practices for conducting user experience surveys

Run an effective user experience survey using these best practices:
Define your goals: Clearly outline the objectives of the survey so you know the types of insights you aim to achieve from the feedback
Present one question at a time: Don’t combine more than one question because you could confuse your audience—each question should focus on a single aspect
Keep your questions brief and clear: Avoid jargon and phrases that may confuse respondents—you want users to understand and answer each question without confusion
Use a mix of question types: Include a variety of question types , including multiple-choice and open-ended questions and rating scales to gather both qualitative and quantitative data
Create multiple variations: Run A/B tests to find out which version of the survey received the highest completion rates
Remove bias: Be objective when asking questions to avoid survey bias , which results in false data
Uncover insights with Typeform
UX surveys may require time and patience, but the payoff is worth it. With the right user experience survey questions, you can take your product and services to the next level. Whether you’re a startup looking to gather customer data for your upcoming campaign or a legacy company trying to level up, Typeform allows you to create beautiful, branded surveys compared to your traditional questionnaire.
Use our user experience survey template to customize your questionnaire to your target audience—choose from over 1 million photos, videos, and icons, or upload your own. Build your ultimate UX survey today with the help of Typeform.

About the author
We're Typeform - a team on a mission to transform data collection by bringing you refreshingly different forms.
Liked that? Check these out:

Make your business idea the next MVP
Got a good idea? Move it from minimum viable product to launch without losing your shirt.
Paul Campillo | 05.2016

3 benefits of using customer feedback for product-led growth
Customer feedback can fuel product-led growth by guiding innovation and improving user experiences. Here's how to harness this feedback to stay ahead in a customer-centric market.

What is brand perception? How to measure and improve it
Typeform | 03.2024
Better User Research Through Surveys

Creating a great survey is like designing a great user experience—they become a waste of time and money if the audience is not at the centre of the process.
Chris Gray shows us in this whiteboard animation how to build the kind of survey that will collect the most valuable information from our users.
Online surveys are commonly used by marketers, product managers, strategists and others to gather feedback. You’ve probably participated in some of these surveys and I’m sure you’ve noticed that they’re often executed poorly.
Surveys are increasingly becoming a more accepted tool for UX practitioners. Creating a great survey is like designing a great user experience—they are a waste of time and money if the audience, or user, is not at the centre of the process. Designing for your user leads to the gathering of more useful and reliable information.
Let’s take a look at some of the basics of creating and running a useful online survey.
What is a survey?
A survey is a simple tool for gathering information. Surveys typically consist of a set of questions used to assess a participant’s preferences, attitudes, characteristics and opinions on a given topic. As a research method, surveys allow us to count or quantify concepts—a sample or subset of the broader audience is used, the learnings from which can be applied to a broader population.
For example, we might have 100,000 unique users of a website in a given year. If we collect information from 2,000 of those users, we could confidently apply the information to the full 100,000.
When it comes to the digital space, we can use surveys for a variety of purposes including:
- Gathering feedback on a live product or during a pilot;
- Exploring the reasons people visit a website and assessing their experience of that visit (such as a True Intent survey);
- Quantifying results from qualitative research activities such as contextual enquiry or interviews ; and
- Evaluating usability, such as the System Usability Scale .
Surveys can be an effective method of identifying:
- Who your users are;
- What your users want;
- What they purchase;
- Where they shop;
- What they own; and
- What they think of your brand or product.
Surveys can benefit and inform the design process by:
- Providing information to better understand end users to design better products;
- Mitigating risk of designing the wrong, or a poor, solution for users;
- Providing stakeholders with confidence that a design is, or will be effective. Gathering larger sample sizes, in comparison to qualitative research , often speaks the language of business stakeholders. Whether we like it or not, there is often a perception when it comes to research that more is more.
Before starting
Like with any UX research activity an effective survey must start with a clear understanding of the needs and information required from the project. To create an effective survey both the business context and project objectives must be clearly understood. The business context of the interface or the product includes insight into why it exists and how it supports the business objectives. The project objectives include the reason the survey is being conducted. For example, is the survey being run to understand the end user, inform the direction of a design or assess a live website? The project objectives may inform the type of survey, the collection method and the robustness of the evidence required, which in turn could influence the ideal approach.
Furthermore, a set of research questions should be defined around the information that needs to be collected. These research questions can then be used as a framework for ensuring that the required information is collected effectively. Defining the information can also be a mechanism for avoiding any irrelevant questions that could creep into the activity.
The information required also provides a framework for the scope of the research . As a start point to any project, the information to be collected needs to be agreed to by all parties. Without this information the research becomes an exercise in guesswork and is likely to miss the mark for stakeholders and be frustrating for all.
Creating an effective survey
Effective questions and good survey design are important for generating quality data and maximising completion rates. Poor questions result in poor feedback that cannot be relied upon. Dropout is the enemy of achieving a robust sample. It is a win in the first place to get someone to agree to participate in an online survey. It is unforgivable if they drop out because they are bored or frustrated.
The following is a guide to creating an effective and engaging survey:
- Logical flow of questions. In order to make the questions easier and faster to answer they should be grouped with like questions and ordered in a logical manner. Imagine answering questions about your attitude to boat refugees, then being asked about your experience of your favorite fast food chain. The transition can be jarring. Obviously there is a need to be able to change topics, however minimising any unnecessary shifts, particularly at inappropriate times, will result in a more effective survey.
- Questions need to be easy to understand . Many surveys will be completed without the aid of anyone to clarify any confusion. It is important to make sure that questions can be readily understood without any additional information. Of major concern is that ambiguous or difficult to understand questions can be answered incorrectly which can bring the data into question.
- Provide questions appropriate for the audience . People can and will answer just about any question put in front of them. This doesn’t mean that they are qualified to answer them, or are able to provide insightful feedback. A good way to check this is to ask yourself, “will my audience know the answer to that question”?
- Avoid double negatives . Double negatives, particularly in combination with the available responses, can make answering questions difficult. Imagine the question:

For a participant, the response “No, my manager is not non-responsive” could be a challenging idea.
- Avoid questions that contain two concepts. For example:

You may think your manager’s leadership is great but their communication skills could be improved. In that case, how do you decide on an answer? This also gets challenging when analysing the findings. Which skill does the manager need to work on if the rating is poor? All questions should relate to one concept. If required, add an extra question to explore the other concept.
- Use balanced ratings scales . Use an equal number of positive and negative options—this relates to probability. With 4 options the natural spread would be 25% per answer, therefore if we have more positive options than negative we would increase the chances of getting positive feedback. An example of this would be:

A balanced rating scale is shown below:

With a balanced rating scale there is a greater chance of the results reflecting a participant’s true beliefs.
- Avoid answers that overlap. An example of overlapping scale would be:

Obviously for someone who is 24 years of age there are 2 options. The same advice goes for concepts.
- Use open-ended questions. This allows us to better understand what is happening. It is great to use multiple-choice questions to gather proportions of feedback and priority and then ask the more probing, ‘Why’? A common use is to follow-up a satisfaction question. For example, follow-up the question “Overall, how satisfied were you with your experience of the website?” with ‘Why’? as an open text field. This can provide great insights into what was driving the feedback.
- Use writing-for-the-web techniques. Using elements such as bolding key words, avoiding unnecessary copy and using a conversational tone can go a long way to making your survey more engaging and easier for participants to read and understand. For example, a question about gender is simplified in the second option below by removing unnecessary copy:

(Note: Read Jessica Enders’ article for an in-depth exploration of how, when and why you should—or shouldn’t—ask for someone’s sex or gender in a survey).
- Keep it short. There is often a temptation when writing surveys to add more areas for exploration. The problem is that they can become painfully long. A better approach is to keep the survey succinct and run another in a month or two.
- Avoid asking about behaviour. While there is nothing stopping you from asking for feedback regarding behaviour there are better techniques for collecting this type of information that is likely to translate to making better design decisions. For example, trying to assess the effectiveness of myki (Melbourne’s poor public transport ticketing system), observing people buying tickets and travelling throughout the network would yield more accurate and useful feedback than asking people how they had used the system over the last week.
- Include ‘don’t know’ options. There will be cases where participants legitimately don’t have an answer. It is likely to be more helpful to know that your audience don’t hold an opinion on a topic than forcing them into an answer, which can distort the picture by overestimating the positive or negative. The same can be said for neutral options in rating scales.
Once the survey has been written
It is a good idea to test the survey before launching it to your full audience. Initially this could be done with a colleague or someone from your organisation to pilot the survey. Don’t give them too much feedback on the survey background—only provide the information any potential participants would have. Give them clear direction in terms of the type of feedback you are looking for. Something along the lines of:
- Are there any questions that didn’t make sense to you?
- Are there any questions you couldn’t answer or were missing the answer you wanted to provide?
Once you are happy that the questions are clear and can be answered, launch the survey to a subset of your audience. When using a panel, go out to a subset of the total sample or when using an intercept survey (a pop-up on a live website) limit the proportion of visitors who will see the survey. Once you have checked that the questions are being completed as would be expected, go out to the whole sample.
There are many tools available for scripting and running surveys, ranging from light weight and inexpensive tools right through to specialist market research tools . The more comprehensive tools include greater functionality for including logic and routing in the survey as well as more powerful reporting functionality.
For most UX applications more simple surveys tools such as those discussed in the next section should offer adequate functionality to create surveys. My advice would be to keep surveys simple. A lot of time can be spent creating clever logic and routing within a survey but the more complex the survey, the greater the amount of testing required (a seemingly exponential increase). Often the benefit gained from the additional complexity of the survey does not reflect the time taken to set this up.
Below is a list of some of the survey tools on the market. This is not intended to be an exhaustive list, rather a place to start if you are interested writing and running a survey.
| All also offer annual option (not shown) | Free, $23, $75 | Free, $36, $123 & $218 | Free, $14.08, $29.08 $74.08 & $183.25 |
| Weblink, email, Facebook, or embed on your site or blog & Enhanced security (SSL)* | Weblink, email*, Facebook*, or embed on your site or blog* | Weblink, Facebook, or embed on your site or blog & Enhanced security (SSL)* | |
15 | 22* | 8 | |
Yes* | Yes* | Yes* | |
Yes* | Yes* | Yes* | |
| Offers good value. | Of these tools it probably offers the most advanced functionality and this is reflected in their price of their higher end versions. | Isn’t a dedicated survey tool however can be used for other applications. It only offers 10-point Likert scales, which may be inadequate for some. |
* Only available in paid-for solutions.
Consider the following when choosing a survey tool:
- If you work in a medium to large organisation, someone will already have access to a survey tool. Use it. It will save you money and the time spent trying to choose one. Try marketing, HR or market research teams .
- If you plan to use a research panel for your sample, contact them and see which tools they can integrate with easily.
- For all but the most basic of surveys expect to pay something for the tool. The costs are fairly low—for example SurveyMonkey and SurveyGizmo have $19 offerings which remove most restrictions to allow access to much of the functionality required.
Surveys can be a really useful UX tool to provide input for the design process. The key to a successful survey is establishing the objectives and information required from the study up front, then making sure the questions asked cover them. Keep at the forefront of your mind the importance of creating a good experience for the participants by writing appropriate questions. Designing an effective survey is going to produce the best results.
Keep it short, keep the participant in mind when writing the questions and engage with your audience—good luck!

Chris is Director and Principal consultant at Nomat, a boutique UX design and research consultancy who take a pragmatic approach to improving design through customer engagement. With almost 15 years experience he focusses on assisting organisations to include UX activities within agile environments and to ensure design drives ROI. Away from UX, Chris chases his little monkeys around and gets out on his pushy.
Join the discussion Cancel reply
11 comments.
Thanks a lot Chris, I’m running my survey next week ;-)
Glad you like it. Good luck with it!
What about Google Forms?
Google forms can be great for simple surveys. They do have some limitations such as 10 point rating scales opposed to 11 which means there is no mid-point. They also don’t have routing capability which allows for a subset of people being asked a specific question. But if you don’t need these then there is no need to overcomplicate things.
They have question routing now and also you can use multiple choice questions with any number of responses, allowing you to create your own number of points. :) They have come a long way!
I take back this halfway, you can only do conditional responses on multiple-choice questions, and if you use the linear scale rather than multiple choice, then yes, it only goes to 10 :(
Very helpful – Thanks Chris
Whoa, just stumbled across this article. Very well written, especially with the example. Just wanted to put this out there. Shorter surveys work well for high response and engagement rates. Check out YesInsights ( https://www.yesinsights.com ) for an easy way to create one-click surveys :D
Thanks Chris , it was very helpful :)
Great article! Any ideas on how to get people to take your survey when there isn’t any product live yet?
Oh, that. That explains it.
Further reading

Bad UX Examples: A Guideline to Prevent Errors
Achieving a great User Experience (UX) is essential in the digital space world. Good UX design connects with users. Yet, one can encounter dozens of...

How to Write Effective Qualitative Interview Questions
Qualitative interviewing is an effective technique to quickly understand more about a target user group. It is a key skill that any aspiring user...

Wireframes Are Bad… Don’t Use Them
I failed in using wireframes; that’s why I say that they are bad. I know so many beginners and intermediate UX designers use wireframes in the...
Follow @uxmastery
Skip navigation
World Leaders in Research-Based User Experience
When to use which user-experience research methods.

July 17, 2022 2022-07-17
- Email article
- Share on LinkedIn
- Share on Twitter
The field of user experience has a wide range of research methods available, ranging from tried-and-true methods such as lab-based usability testing to those that have been more recently developed, such as unmoderated UX assessments.
While it's not realistic to use the full set of methods on a given project, nearly all projects would benefit from multiple research methods and from combining insights. Unfortunately, many design teams only use one or two methods that they are most familiar with. The key question is what to use when.
In This Article:
Three-dimensional framework, the attitudinal vs. behavioral dimension, the qualitative vs. quantitative dimension, the context of product use, phases of product development (the time dimension), art or science, 20 ux methods in brief.
To better understand when to use which method, it is helpful to view them along a 3-dimensional framework with the following axes:
- Attitudinal vs. Behavioral
- Qualitative vs. Quantitative
- Context of Use
The following chart illustrates where 20 popular methods appear along these dimensions:
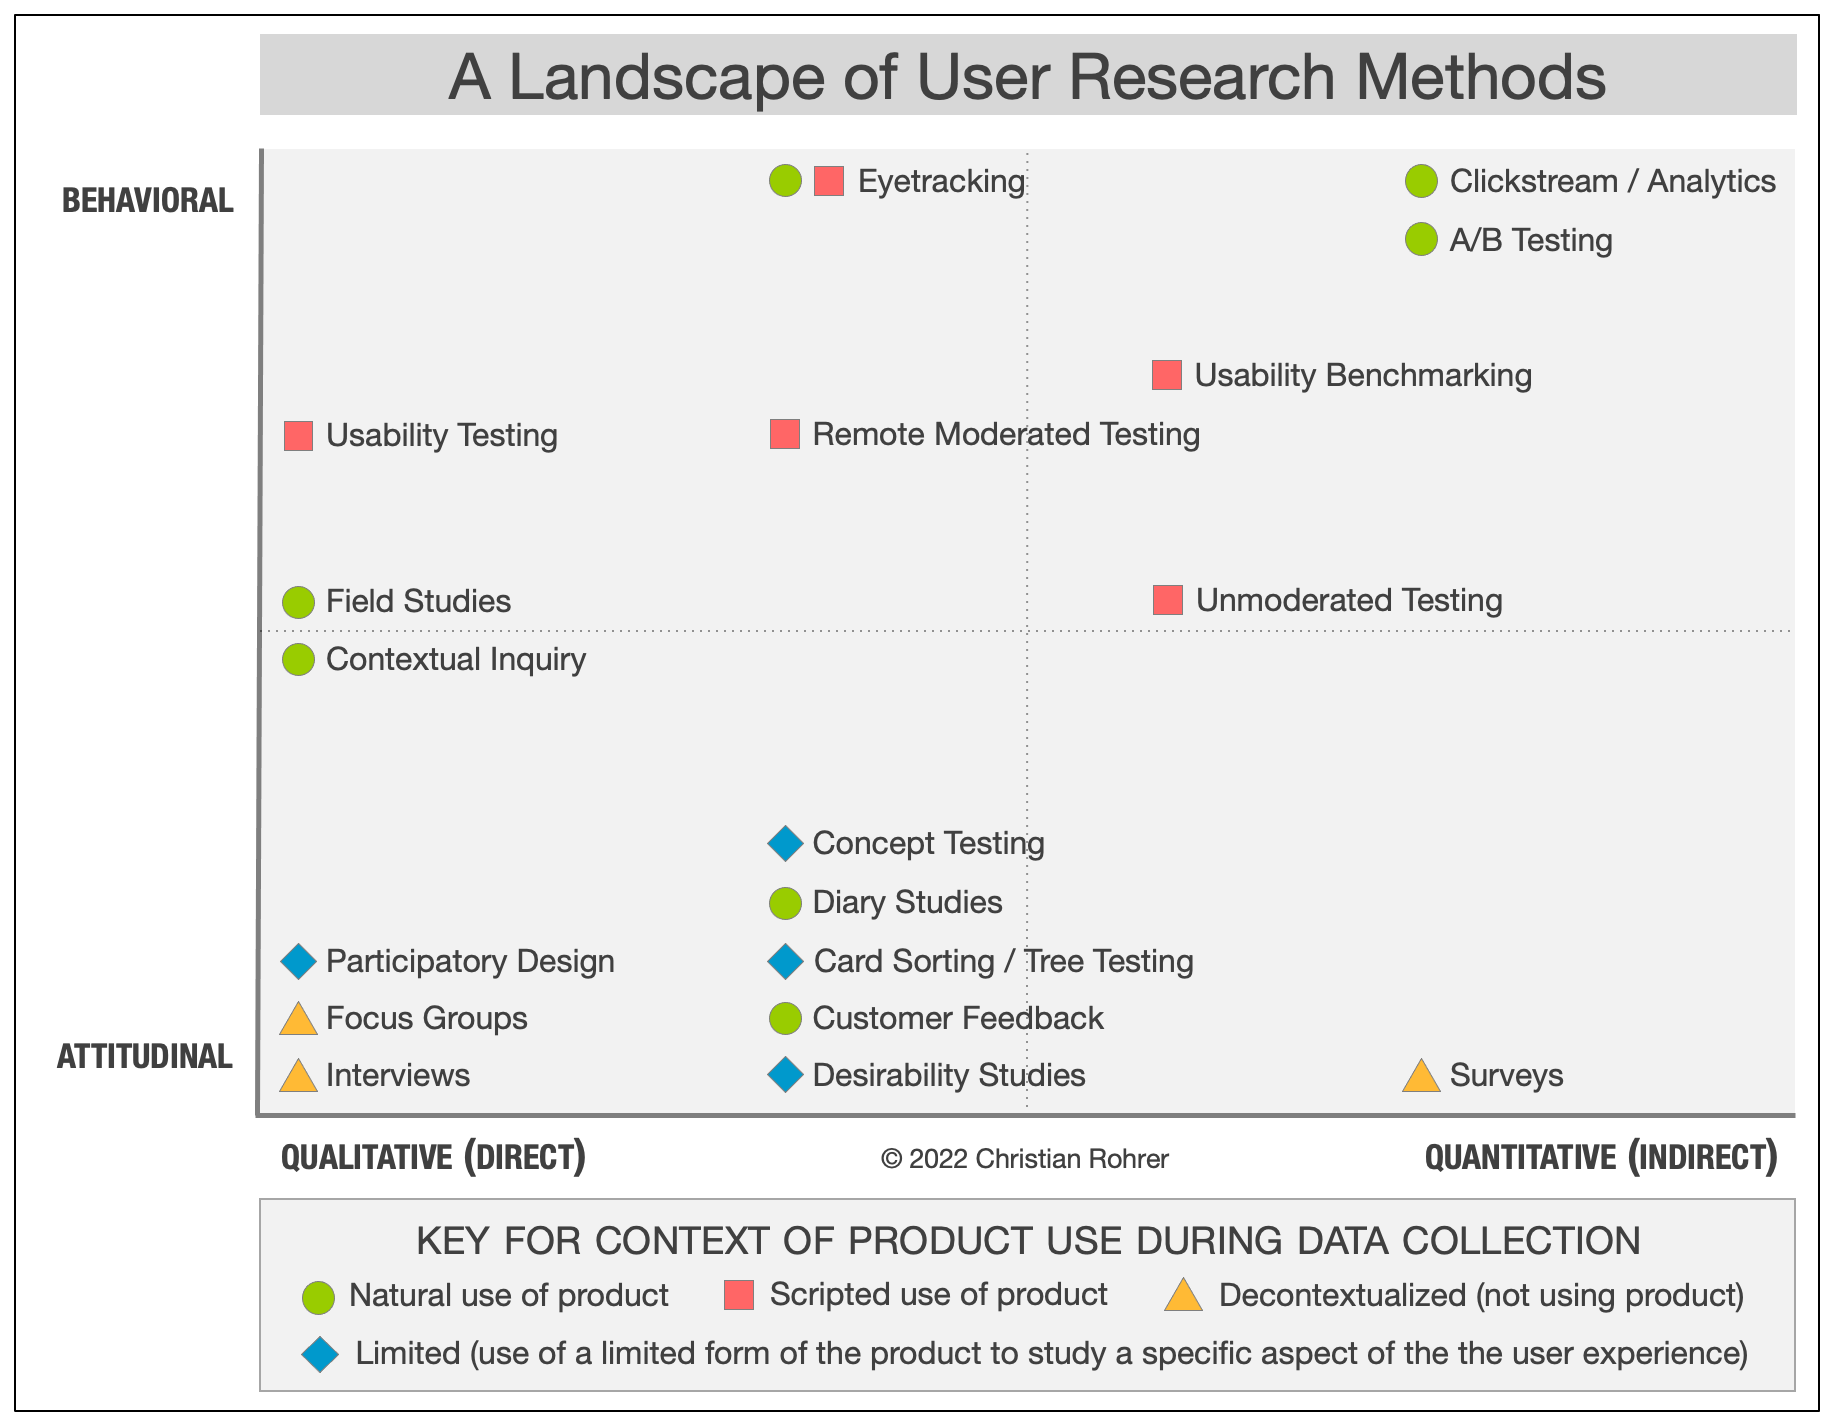
This distinction can be summed up by contrasting "what people say" versus "what people do" (very often the two are quite different). The purpose of attitudinal research is usually to understand or measure people's stated beliefs, but it is limited by what people are aware of and willing to report.
While most usability studies should rely on behavior , methods that use self-reported information can still be quite useful to designers. For example, card sorting provides insights about users' mental model of an information space and can help determine the best information architecture for your product, application, or website. Surveys measure and categorize attitudes or collect self-reported data that can help track or discover important issues to address. Focus groups tend to be less useful for usability purposes, for a variety of reasons, but can provide a top-of-mind view of what people think about a brand or product concept in a group setting.
On the other end of this dimension, methods that focus mostly on behavior seek to understand "what people do" with the product or service in question. For example A/B testing presents changes to a site's design to random samples of site visitors but attempts to hold all else constant, in order to see the effect of different site-design choices on behavior, while eyetracking seeks to understand how users visually interact with a design or visual stimulus.
Between these two extremes lie the two most popular methods we use: usability studies and field studies . They utilize a mixture of self-reported and behavioral data and can move toward either end of this dimension, though leaning toward the behavioral side is generally recommended.
The distinction here is an important one and goes well beyond the narrow view of qualitative as in an open-ended survey question. Rather, studies that are qualitative in nature generate data about behaviors or attitudes based on observing or hearing them directly , whereas in quantitative studies , the data about the behavior or attitudes in question are gathered indirectly , through a measurement or an instrument such as a survey or an analytics tool . In field studies and usability testing, for example, researchers directly observe how people use (or do not use) technology to meet their needs or to complete tasks. These observations give them the ability to ask questions, probe on behavior, or possibly even adjust the study protocol to better meet study objectives. Analysis of the data is usually not mathematical.
In contrast, the kind of data collected in quantitative methods is predetermined — it could include task time, success, whether the user has clicked on a given UI element or whether they selected a certain answer to a multiple-choice question. The insights in quantitative methods are typically derived from mathematical analysis, since the instrument of data collection (e.g., survey tool or analytics tool) captures such large amounts of data that are automatically coded numerically.
Due to the nature of their differences , qualitative methods are much better suited for answering questions about why or how to fix a problem, whereas quantitative methods do a much better job answering how many and how much types of questions. Having such numbers helps prioritize resources, for example to focus on issues with the biggest impact. The following chart illustrates how the first two dimensions affect the types of questions that can be asked:

The third distinction has to do with how and whether participants in the study are using the product or service in question. This can be described as:
- Natural or near-natural use of the product
- Scripted use of the product
- Limited in which a limited form of the product is used to study a specific aspect of the user experience
- Not using the product during the study (decontextualized)
When studying natural use of the product, the goal is to minimize interference from the study in order to understand behavior or attitudes as close to reality as possible. This provides greater external validity but less control over what topics you learn about. Many ethnographic field studies attempt to do this, though there are always some observation biases. Intercept surveys and data mining or other analytic techniques are quantitative examples of this.
A scripted study of product usage is done in order to focus the insights on specific product areas, such as a newly redesigned flow. The degree of scripting can vary quite a bit, depending on the study goals. For example, a benchmarking study is usually very tightly scripted, so that it can produce reliable usability metrics by ensuring consistency across participants.
Limited methods use a limited form of a product to study a specific or abstracted aspect of the experience. For example, participatory-design methods allow users to interact with and rearrange design elements that could be part of a product experience, in order discuss how their proposed solutions would meet their needs and why they made certain choices. Concept-testing methods employ an expression of the idea of a product or service that gets at the heart of what it would provide (and not at the details of the experience) in order to understand if users would want or need such a product or service. Card sorting and tree testing focus on how the information architecture is or could be arranged to best make sense to participants and make navigation easier.
Studies where the product is not used are conducted to examine issues that are broader than usage and usability, such as a study of the brand or discovering the aesthetic attributes that participants associate with a specific design style.
Many of the methods in the chart can move along one or more dimensions, and some do so even in the same study, usually to satisfy multiple goals. For example, field studies can focus a little more on what people say (ethnographic interviews) or emphasize studying what they do (extended observations); concept testing, desirability studies, and card sorting have both qualitative and quantitative versions; and eyetracking can be natural or scripted.
Another important distinction to consider when making a choice among research methodologies is the phase of product development and its associated objectives. For example, in the beginning of the product-development process, you are typically more interested in the strategic question of what direction to take the product, so methods at this stage are often generative in nature, because they help generate ideas and answers about which way to go. Once a direction is selected, the design phase begins, so methods in this stage are well-described as formative, because they inform how you can improve the design. After a product has been developed enough to measure it, it can be assessed against earlier versions of itself or competitors, and methods that do this are called summative. This following table describes where many methods map to these stages in time:
|
| ||
| Strategize | Design | Launch & Assess |
| | | |
| Generative research methods | Formative research methods | Summative research methods |
|
| ||
| Field studies, diary studies, interviews, surveys, participatory design, concept testing | Card sorting, tree testing, usability testing, remote testing (moderated and unmoderated) | Usability benchmarking, unmoderated UX testing, A/B testing, clickstream / analytics, surveys |
While many user-experience research methods have their roots in scientific practice, their aims are not purely scientific and still need to be adjusted to meet stakeholder needs. This is why the characterizations of the methods here are meant as general guidelines, rather than rigid classifications.
In the end, the success of your work will be determined by how much of an impact it has on improving the user experience of the website or product in question. These classifications are meant to help you make the best choice at the right time.
Here’s a short description of the user research methods shown in the above chart:
Usability testing (aka usability-lab studies): Participants are brought into a lab, one-on-one with a researcher, and given a set of scenarios that lead to tasks and usage of specific interest within a product or service.
Field studies : Researchers study participants in their own environment (work or home), where they would most likely encounter the product or service being used in the most realistic or natural environment.
Contextual inquiry : Researchers and participants collaborate together in the participants own environment to inquire about and observe the nature of the tasks and work at hand. This method is very similar to a field study and was developed to study complex systems and in-depth processes.
Participatory design : Participants are given design elements or creative materials in order to construct their ideal experience in a concrete way that expresses what matters to them most and why.
Focus groups : Groups of 3–12 participants are led through a discussion about a set of topics, giving verbal and written feedback through discussion and exercises.
Interviews : a researcher meets with participants one-on-one to discuss in depth what the participant thinks about the topic in question.
Eyetracking : an eyetracking device is configured to precisely measure where participants look as they perform tasks or interact naturally with websites, applications, physical products, or environments.
Usability benchmarking : tightly scripted usability studies are performed with larger numbers of participants, using precise and predetermined measures of performance, usually with the goal of tracking usability improvements of a product over time or comparing with competitors.
Remote moderated testing : Usability studies are conducted remotely , with the use of tools such as video conferencing, screen-sharing software, and remote-control capabilities.
Unmoderated testing: An automated method that can be used in both quantitative and qualitative studies and that uses a specialized research tool to capture participant behaviors and attitudes, usually by giving participants goals or scenarios to accomplish with a site, app, or prototype. The tool can record a video stream of each user session, and can gather usability metrics such as success rate, task time, and perceived ease of use.
Concept testing : A researcher shares an approximation of a product or service that captures the key essence (the value proposition) of a new concept or product in order to determine if it meets the needs of the target audience. It can be done one-on-one or with larger numbers of participants, and either in person or online.
Diary studies : Participants are using a mechanism (e.g., paper or digital diary, camera, smartphone app) to record and describe aspects of their lives that are relevant to a product or service or simply core to the target audience. Diary studies are typically longitudinal and can be done only for data that is easily recorded by participants.
Customer feedback : Open-ended and/or close-ended information is provided by a self-selected sample of users, often through a feedback link, button, form, or email.
Desirability studies : Participants are offered different visual-design alternatives and are expected to associate each alternative with a set of attributes selected from a closed list. These studies can be both qualitative and quantitative.
Card sorting : A quantitative or qualitative method that asks users to organize items into groups and assign categories to each group. This method helps create or refine the information architecture of a site by exposing users’ mental models .
Tree testing : A quantitative method of testing an information architecture to determine how easy it is to find items in the hierarchy. This method can be conducted on an existing information architecture to benchmark it and then again, after the information architecture is improved with card sorting, to demonstrate improvement.
Analytics : Analyzing data collected from user behavior like clicks, form filling, and other recorded interactions. It requires the site or application to be instrumented properly in advance.
Clickstream analytics: A particular type of analytics that involves analyzing the sequence of pages that users visit as they use a site or software application.
A/B testing (aka multivariate testing , live testing, or bucket testing): A method of scientifically testing different designs on a site by randomly assigning groups of users to interact with each of the different designs and measuring the effect of these assignments on user behavior.
Surveys : A quantitative measure of attitudes through a series of questions, typically more closed-ended than open-ended . A survey that is triggered during the use of a site or application is an intercept survey, often triggered by user behavior. More typically, participants are recruited from an email message or reached through some other channel such as social media.
In-Depth Course
More details about the methods and the dimensions of use in the full-day training course User Research Methods: From Strategy to Requirements to Design and the article A Guide to Using User-Experience Research Methods .
Free Downloads
Related courses, user research methods: from strategy to requirements to design.
Pick the best UX research method for each stage in the design process
Discovery: Building the Right Thing
Conduct successful discovery phases to ensure you build the best solution
Usability Testing
Learn how to plan, conduct, and analyze your own studies, whether in person or remote
Related Topics
- Research Methods Research Methods
- User Testing
- Analytics & Metrics
Learn More:
Please accept marketing cookies to view the embedded video. https://www.youtube.com/watch?v=OtUWbsvCujM
When to Use Which UX Research Method

Competitive Reviews vs. Competitive Research
Therese Fessenden · 4 min

15 User Research Methods to Know Beyond Usability Testing
Samhita Tankala · 3 min

Always Pilot Test User Research Studies
Kim Salazar · 3 min
Related Articles:
Open-Ended vs. Closed Questions in User Research
Maria Rosala · 5 min
Competitive Usability Evaluations
Tim Neusesser · 6 min
Why and How to Use Demographics in UX
Samhita Tankala · 6 min
A Guide to Using User-Experience Research Methods
Kelley Gordon and Christian Rohrer ·
Confounding Variables in Quantitative Studies
Caleb Sponheim · 5 min
UX Research Methods: Glossary
Raluca Budiu · 12 min
Integrations
What's new?
In-Product Prompts
Participant Management
Interview Studies
Prototype Testing
Card Sorting
Tree Testing
Live Website Testing
Automated Reports
Templates Gallery
Choose from our library of pre-built mazes to copy, customize, and share with your own users
Browse all templates
Financial Services
Tech & Software
Product Designers
Product Managers
User Researchers
By use case
Concept & Idea Validation
Wireframe & Usability Test
Content & Copy Testing
Feedback & Satisfaction
Content Hub
Educational resources for product, research and design teams
Explore all resources
Question Bank
Research Maturity Model
Guides & Reports
Help Center
Future of User Research Report
The Optimal Path Podcast
Maze Guides | Resources Hub
What is UX Research: The Ultimate Guide for UX Researchers
0% complete
The UX researcher’s toolkit: 11 UX research methods and when to use them
After defining your objectives and planning your research framework, it’s time to choose the research technique that will best serve your project's goals and yield the right insights. While user research is often treated as an afterthought, it should inform every design decision. In this chapter, we walk you through the most common research methods and help you choose the right one for you.

What are UX research methods?
A UX research method is a way of generating insights about your users, their behavior, motivations, and needs.
These methods help:
- Learn about user behavior and attitudes
- Identify key pain points and challenges in the user interface
- Develop user personas to identify user needs and drive solutions
- Test user interface designs to see what works and what doesn’t
You can use research methodologies like user interviews, surveys, focus groups, card sorting, usability testing to identify user challenges and turn them into opportunities to improve the user experience.
More of a visual learner? Check out this video for a speedy rundown. If you’re ready to get stuck in, jump straight to our full breakdown .
The most common types of user research
First, let’s talk about the types of UX research. Every individual research method falls under these types, which reflect different goals and objectives for conducting research.
Here’s a quick overview:

Qualitative vs. quantitative
All research methods are either quantitative or qualitative . Qualitative research focuses on capturing subjective insights into users' experiences. It aims to understand the underlying reasons, motivations, and behaviors of individuals.
Quantitative research, on the other hand, involves collecting and analyzing numerical data to identify patterns, trends, and significance. It aims to quantify user behaviors, preferences, and attitudes, allowing for generalizations and statistical insights.

Qualitative research also typically involves a smaller sample size than quantitative research. Nielsen Norman Group recommends 40 participants—see our full rundown of how many user testers you need for different research methods .
Attitudinal vs. behavioral
Attitudinal research is about understanding users' attitudes, perceptions, and beliefs. It delves into the 'why' behind user decisions and actions. It often involves surveys or interviews where users are asked about their feelings, preferences, or perceptions towards a product or service. It's subjective in nature, aiming to capture people's emotions and opinions.
Behavioral research is about what users do rather than what they say they do or would do. This kind of research is often based on observation methods like usability testing, eye-tracking, or heat maps to understand user behavior.

Generative vs. evaluative
Generative research is all about generating new ideas, concepts, and insights to fuel the design process. You might run brainstorming sessions with groups of users, card sorting, and co-design sessions to inspire creativity and guide the development of user-centered solutions.
On the other hand, evaluative research focuses on assessing the usability, effectiveness, and overall quality of existing designs or prototypes. Once you’ve developed a prototype of your product, it's time to evaluate its strengths and weaknesses. You can compare different versions of a product design or feature through A/B testing—ensuring your UX design meets user needs and expectations.

Remove the guesswork from product decisions
Collect both quantitative and qualitative insights from your customers and build truly user-centric products with Maze.

11 Best UX research methods and when to use them
There are various UX research techniques—each method serves a specific purpose and can provide unique insights into user behaviors and preferences. In this section, we’ll highlight the most common research techniques you need to know.
Read on for an at-a-glance table, and full breakdown of each method.
| User interviews | One-on-one open-ended and guided discussions | Start and end of your project | Qualitative Generative |
| Field studies | Observe people in their natural environment | All stages | Qualitative Behavioral |
| Focus group | Group discussions facilitated by a moderator | Start and end of your project | Qualitative Generative |
| Diary studies | Users keep a diary to track interactions and experience with a product | Start of your project | Qualitative Evaluative |
| Surveys | Asking people open or closed questions | All stages | Qualitative |
| Card sorting | Users sort information and ideas into groups that makes sense to them | Start of your project | Qualitative |
| Tree testing | Assess the findability and organization of information as users navigate a stripped-down IA | Start of your design or redesign process | Quantitative |
| Usability testing | Users perform a set of tasks in a controlled setting | All stages | Qualitative Behavioral |
| Five second testing | Collect immediate impressions within a short timeframe | During initial ideation and throughout design | Attitudinal Evaluative |
| A/B testing | Compare two versions of a solution | All stages | Quantitative |
| Concept testing | Evaluate the feasibility, appeal, and potential success of a new product | During initial ideation, design, and before launch | Qualitative |
1. User interviews
Tl;dr: user interviews.
Directly ask users about their experiences with a product to understand their thoughts, feelings, and problems
✅ Provides detailed insights that survey may miss ❌ May not represent the wider user base; depends on user’s memory and honesty
User interviews are a qualitative research method that involves having open-ended and guided discussions with users to gather in-depth insights about their experiences, needs, motivations, and behaviors.
Typically, you would ask a few questions on a specific topic during a user interview and analyze participants' answers. The results you get will depend on how well you form and ask questions, as well as follow up on participants’ answers.
“As a researcher, it's our responsibility to drive the user to their actual problems,” says Yuliya Martinavichene , User Experience Researcher at Zinio. She adds, “The narration of incidents can help you analyze a lot of hidden details with regard to user behavior.”
That’s why you should:
- Start with a wide context : Make sure that your questions don’t start with your product
- Ask questions: Always ask questions that focus on the tasks that users are trying to complete
- Invest in analysis : Get transcripts done and share the findings with your team
Tanya Nativ , Design Researcher at Sketch recommends defining the goals and assumptions internally. “Our beliefs about our users’ behavior really help to structure good questions and get to the root of the problem and its solution,” she explains.
It's easy to be misunderstood if you don't have experience writing interview questions. You can get someone to review them for you or use our Question Bank of 350+ research questions .
When to conduct user interviews
This method is typically used at the start and end of your project. At the start of a project, you can establish a strong understanding of your target users, their perspectives, and the context in which they’ll interact with your product. By the end of your project, new user interviews—often with a different set of individuals—offer a litmus test for your product's usability and appeal, providing firsthand accounts of experiences, perceived strengths, and potential areas for refinement.
2. Field studies
Tl;dr: field studies.
Observe users in their natural environment to inform design decisions with real-world context
✅ Provides contextual insights into user behavior in real-world situations ✅ Helps identify external factors and conditions that influence user experience ❌ Can be time-consuming and resource-intensive to conduct ❌ Participants may behave differently when they know they are being observed (Hawthorne effect)
Field studies—also known as ethnographic research—are research activities that take place in the user’s environment rather than in your lab or office. They’re a great method for uncovering context, unknown motivations, or constraints that affect the user experience.
An advantage of field studies is observing people in their natural environment, giving you a glimpse at the context in which your product is used. It’s useful to understand the context in which users complete tasks, learn about their needs, and collect in-depth user stories.
When to conduct field studies
This method can be used at all stages of your project—two key times you may want to conduct field studies are:
- As part of the discovery and exploration stage to define direction and understand the context around when and how users interact with the product
- During usability testing, once you have a prototype, to evaluate the effectiveness of the solution or validate design assumptions in real-world contexts
3. Focus groups
Tl;dr: focus groups.
Gather qualitative data from a group of users discussing their experiences and opinions about a product
✅ Allows for diverse perspectives to be shared and discussed ❌ Group dynamics may influence individual opinions
A focus group is a qualitative research method that includes the study of a group of people, their beliefs, and opinions. It’s typically used for market research or gathering feedback on products and messaging.
Focus groups can help you better grasp:
- How users perceive your product
- What users believe are a product’s most important features
- What problems do users experience with the product
As with any qualitative research method, the quality of the data collected through focus groups is only as robust as the preparation. So, it’s important to prepare a UX research plan you can refer to during the discussion.
Here’s some things to consider:
- Write a script to guide the conversation
- Ask clear, open-ended questions focused on the topics you’re trying to learn about
- Include around five to ten participants to keep the sessions focused and organized
When to conduct focus groups
It’s easier to use this research technique when you're still formulating your concept, product, or service—to explore user preferences, gather initial reactions, and generate ideas. This is because, in the early stages, you have flexibility and can make significant changes without incurring high costs.
Another way some researchers employ focus groups is post-launch to gather feedback and identify potential improvements. However, you can also use other methods here which may be more effective for identifying usability issues. For example, a platform like Maze can provide detailed, actionable data about how users interact with your product. These quantitative results are a great accompaniment to the qualitative data gathered from your focus group.
4. Diary studies
Tl;dr: diary studies.
Get deep insights into user thoughts and feelings by having them keep a product-related diary over a set period of time, typically a couple of weeks
✅ Gives you a peak into how users interact with your product in their day-to-day ❌ Depends on how motivated and dedicated the users are
Diary studies involve asking users to track their usage and thoughts on your product by keeping logs or diaries, taking photos, explaining their activities, and highlighting things that stood out to them.
“Diary studies are one of the few ways you can get a peek into how users interact with our product in a real-world scenario,” says Tanya.
A diary study helps you tell the story of how products and services fit into people’s daily lives, and the touch-points and channels they choose to complete their tasks.
There’s several key questions to consider before conducting diary research, from what kind of diary you want—freeform or structured, and digital or paper—to how often you want participants to log their thoughts.
- Open, ‘freeform’ diary: Users have more freedom to record what and when they like, but can also lead to missed opportunities to capture data users might overlook
- Closed, ‘structured; diary: Users follow a stricter entry-logging process and answer pre-set questions
Remember to determine the trigger: a signal that lets the participants know when they should log their feedback. Tanya breaks these triggers down into the following:
- Interval-contingent trigger : Participants fill out the diary at specific intervals such as one entry per day, or one entry per week
- Signal-contingent trigger : You tell the participant when to make an entry and how you would prefer them to communicate it to you as well as your preferred type of communication
- Event-contingent trigger : The participant makes an entry whenever a defined event occurs
When to conduct diary studies
Diary studies are often valuable when you need to deeply understand users' behaviors, routines, and pain points in real-life contexts. This could be when you're:
- Conceptualizing a new product or feature: Gain insights into user habits, needs, and frustrations to inspire your design
- Trying to enhance an existing product: Identify areas where users are having difficulties or where there are opportunities for better user engagement
TL;DR: Surveys
Collect quantitative data from a large sample of users about their experiences, preferences, and satisfaction with a product
✅ Provides a broad overview of user opinions and trends ❌ May lack in-depth insights and context behind user responses
Although surveys are primarily used for quantitative research, they can also provided qualitative data, depending on whether you use closed or open-ended questions:
- Closed-ended questions come with a predefined set of answers to choose from using formats like rating scales, rankings, or multiple choice. This results in quantitative data.
- Open-ended question s are typically open-text questions where test participants give their responses in a free-form style. This results in qualitative data.
Matthieu Dixte , Product Researcher at Maze, explains the benefit of surveys: “With open-ended questions, researchers get insight into respondents' opinions, experiences, and explanations in their own words. This helps explore nuances that quantitative data alone may not capture.”
So, how do you make sure you’re asking the right survey questions? Gregg Bernstein , UX Researcher at Signal, says that when planning online surveys, it’s best to avoid questions that begin with “How likely are you to…?” Instead, Gregg says asking questions that start with “Have you ever… ?” will prompt users to give more specific and measurable answers.
Make sure your questions:
- Are easy to understand
- Don't guide participants towards a particular answer
- Include both closed-ended and open-ended questions
- Respect users and their privacy
- Are consistent in terms of format
To learn more about survey design, check out this guide .
When to conduct surveys
While surveys can be used at all stages of project development, and are ideal for continuous product discovery , the specific timing and purpose may vary depending on the research goals. For example, you can run surveys at:
- Conceptualization phase to gather preliminary data, and identify patterns, trends, or potential user segments
- Post-launch or during iterative design cycles to gather feedback on user satisfaction, feature usage, or suggestions for improvements
6. Card sorting
Tl;dr: card sorting.
Understand how users categorize and prioritize information within a product or service to structure your information in line with user expectations
✅ Helps create intuitive information architecture and navigation ❌ May not accurately reflect real-world user behavior and decision-making
Card sorting is an important step in creating an intuitive information architecture (IA) and user experience. It’s also a great technique to generate ideas, naming conventions, or simply see how users understand topics.
In this UX research method, participants are presented with cards featuring different topics or information, and tasked with grouping the cards into categories that make sense to them.
There are three types of card sorting:
- Open card sorting: Participants organize topics into categories that make sense to them and name those categories, thus generating new ideas and names
- Hybrid card sorting: Participants can sort cards into predefined categories, but also have the option to create their own categories
- Closed card sorting: Participants are given predefined categories and asked to sort the items into the available groups

Card sorting type comparison table
You can run a card sorting session using physical index cards or digitally with a UX research tool like Maze to simulate the drag-and-drop activity of dividing cards into groups. Running digital card sorting is ideal for any type of card sort, and moderated or unmoderated sessions .
Read more about card sorting and learn how to run a card sorting session here .
When to conduct card sorting
Card sorting isn’t limited to a single stage of design or development—it can be employed anytime you need to explore how users categorize or perceive information. For example, you may want to use card sorting if you need to:
- Understand how users perceive ideas
- Evaluate and prioritize potential solutions
- Generate name ideas and understand naming conventions
- Learn how users expect navigation to work
- Decide how to group content on a new or existing site
- Restructure information architecture
7. Tree testing
Tl;dr: tree testing.
Evaluate the findability of existing information within a product's hierarchical structure or navigation
✅ Identifies potential issues in the information architecture ❌ Focuses on navigation structure, not visual design or content
During tree testing a text-only version of the site is given to your participants, who are asked to complete a series of tasks requiring them to locate items on the app or website.
The data collected from a tree test helps you understand where users intuitively navigate first, and is an effective way to assess the findability, labeling, and information architecture of a product.
We recommend keeping these sessions short, ranging from 15 to 20 minutes, and asking participants to complete no more than ten tasks. This helps ensure participants remain focused and engaged, leading to more reliable and accurate data, and avoiding fatigue.
If you’re using a platform like Maze to run remote testing, you can easily recruit participants based on various demographic filters, including industry and country. This way, you can uncover a broader range of user preferences, ensuring a more comprehensive understanding of your target audience.
To learn more about tree testing, check out this chapter .
When to conduct tree testing
Tree testing is often done at an early stage in the design or redesign process. That’s because it’s more cost-effective to address errors at the start of a project—rather than making changes later in the development process or after launch.
However, it can be helpful to employ tree testing as a method when adding new features, particularly alongside card sorting.
While tree testing and card sorting can both help you with categorizing the content on a website, it’s important to note that they each approach this from a different angle and are used at different stages during the research process. Ideally, you should use the two in tandem: card sorting is recommended when defining and testing a new website architecture, while tree testing is meant to help you test how the navigation performs with users.
8. Usability testing
Tl;dr: usability testing.
Observe users completing specific tasks with a product to identify usability issues and potential improvements
✅ Provides direct insights into user behavior and reveals pain points ❌ Conducted in a controlled environment, may not fully represent real-world usage
Usability testing evaluates your product with people by getting them to complete tasks while you observe and note their interactions (either during or after the test). The goal of conducting usability testing is to understand if your design is intuitive and easy to use. A sign of success is if users can easily accomplish their goals and complete tasks with your product.
There are various usability testing methods that you can use, such as moderated vs. unmoderated or qualitative vs. quantitative —and selecting the right one depends on your research goals, resources, and timeline.
Usability testing is usually performed with functional mid or hi-fi prototypes . If you have a Figma, InVision, Sketch, or prototype ready, you can import it into a platform like Maze and start testing your design with users immediately.
The tasks you create for usability tests should be:
- Realistic, and describe a scenario
- Actionable, and use action verbs (create, sign up, buy, etc)
Be mindful of using leading words such as ‘click here’ or ‘go to that page’ in your tasks. These instructions bias the results by helping users complete their tasks—something that doesn’t happen in real life.
✨ Product tip
With Maze, you can test your prototype and live website with real users to filter out cognitive biases, and gather actionable insights that fuel product decisions.
When to conduct usability testing
To inform your design decisions, you should do usability testing early and often in the process . Here are some guidelines to help you decide when to do usability testing:
- Before you start designing
- Once you have a wireframe or prototype
- Prior to the launch of the product
- At regular intervals after launch
To learn more about usability testing, check out our complete guide to usability testing .
9. Five-second testing
Tl;dr: five-second testing.
Gauge users' first impressions and understanding of a design or layout
✅ Provides insights into the instant clarity and effectiveness of visual communication ❌ Limited to first impressions, does not assess full user experience or interaction
In five-second testing , participants are (unsurprisingly) given five seconds to view an image like a design or web page, and then they’re asked questions about the design to gauge their first impressions.
Why five seconds? According to data , 55% of visitors spend less than 15 seconds on a website, so it;s essential to grab someone’s attention in the first few seconds of their visit. With a five-second test, you can quickly determine what information users perceive and their impressions during the first five seconds of viewing a design.
Product tip 💡
And if you’re using Maze, you can simply upload an image of the screen you want to test, or browse your prototype and select a screen. Plus, you can star individual comments and automatically add them to your report to share with stakeholders.
When to conduct five-second testing
Five-second testing is typically conducted in the early stages of the design process, specifically during initial concept testing or prototype development. This way, you can evaluate your design's initial impact and make early refinements or adjustments to ensure its effectiveness, before putting design to development.
To learn more, check out our chapter on five-second testing .
10. A/B testing
Tl;dr: a/b testing.
Compare two versions of a design or feature to determine which performs better based on user engagement
✅ Provides data-driven insights to guide design decisions and optimize user experience ❌ Requires a large sample size and may not account for long-term effects or complex interactions
A/B testing , also known as split testing, compares two or more versions of a webpage, interface, or feature to determine which performs better regarding engagement, conversions, or other predefined metrics.
It involves randomly dividing users into different groups and giving each group a different version of the design element being tested. For example, let's say the primary call-to-action on the page is a button that says ‘buy now’.
You're considering making changes to its design to see if it can lead to higher conversions, so you create two versions:
- Version A : The original design with the ‘buy now’ button positioned below the product description—shown to group A
- Version B : A variation with the ‘buy now’ button now prominently displayed above the product description—shown to group B
Over a planned period, you measure metrics like click-through rates, add-to-cart rates, and actual purchases to assess the performance of each variation. You find that Group B had significantly higher click-through and conversion rates than Group A. This indicates that showing the button above the product description drove higher user engagement and conversions.
Check out our A/B testing guide for more in-depth examples and guidance on how to run these tests.
When to conduct A/B testing
A/B testing can be used at all stages of the design and development process—whenever you want to collect direct, quantitative data and confirm a suspicion, or settle a design debate. This iterative testing approach allows you to continually improve your website's performance and user experience based on data-driven insights.
11. Concept testing
Tl;dr: concept testing.
Evaluate users' reception and understanding of a new product, feature, or design idea before moving on to development
✅ Helps validate and refine concepts based on user feedback ❌ Relies on users' perception and imagination, may not reflect actual use
Concept testing is a type of research that evaluates the feasibility, appeal, and potential success of a new product before you build it. It centers the user in the ideation process, using UX research methods like A/B testing, surveys, and customer interviews.
There’s no one way to run a concept test—you can opt for concept testing surveys, interviews, focus groups, or any other method that gets qualitative data on your concept.
*Dive into our complete guide to concept testing for more tips and tricks on getting started. *
When to conduct concept testing
Concept testing helps gauge your audience’s interest, understanding, and likelihood-to-purchase, before committing time and resources to a concept. However, it can also be useful further down the product development line—such as when defining marketing messaging or just before launching.
Which is the best UX research type?
The best research type varies depending on your project; what your objectives are, and what stage you’re in. Ultimately, the ideal type of research is one which provides the insights required, using the available resources.
For example, if you're at the early ideation or product discovery stage, generative research methods can help you generate new ideas, understand user needs, and explore possibilities. As you move to the design and development phase, evaluative research methods and quantitative data become crucial.
Discover the UX research trends shaping the future of the industry and why the best results come from a combination of different research methods.
How to choose the right user experience research method
In an ideal world, a combination of all the insights you gain from multiple types of user research methods would guide every design decision. In practice, this can be hard to execute due to resources.
Sometimes the right methodology is the one you can get buy-in, budget, and time for.

Gregg Bernstein , UX Researcher at Signal
UX research tools can help streamline the research process, making regular testing and application of diverse methods more accessible—so you always keep the user at the center of your design process. Some other key tips to remember when choosing your method are:
Define the goals and problems
A good way to inform your choice of user experience research method is to start by considering your goals. You might want to browse UX research templates or read about examples of research.
Michael Margolis , UX Research Partner at Google Ventures, recommends answering questions like:
- “What do your users need?”
- “What are your users struggling with?”
- “How can you help your users?”
Understand the design process stage
If your team is very early in product development, generative research —like field studies—make sense. If you need to test design mockups or a prototype, evaluative research methods—such as usability testing—will work best.
This is something they’re big on at Sketch, as we heard from Design Researcher, Tanya Nativ. She says, “In the discovery phase, we focus on user interviews and contextual inquiries. The testing phase is more about dogfooding, concept testing, and usability testing. Once a feature has been launched, it’s about ongoing listening.”
Consider the type of insights required
If you're looking for rich, qualitative data that delves into user behaviors, motivations, and emotions, then methods like user interviews or field studies are ideal. They’ll help you uncover the ‘why’ behind user actions.
On the other hand, if you need to gather quantitative data to measure user satisfaction or compare different design variations, methods like surveys or A/B testing are more suitable. These methods will help you get hard numbers and concrete data on preferences and behavior.
*Discover the UX research trends shaping the future of the industry and why the best results come from a combination of different research methods. *
Build a deeper understanding of your users with UX research
Think of UX research methods as building blocks that work together to create a well-rounded understanding of your users. Each method brings its own unique strengths, whether it's human empathy from user interviews or the vast data from surveys.
But it's not just about choosing the right UX research methods; the research platform you use is equally important. You need a platform that empowers your team to collect data, analyze, and collaborate seamlessly.
Simplifying product research is simple with Maze. From tree testing to card sorting, prototype testing to user interview analysis—Maze makes getting actionable insights easy, whatever method you opt for.
Meanwhile, if you want to know more about testing methods, head on to the next chapter all about tree testing .
Get valuable insights from real users
Conduct impactful UX research with Maze and improve your product experience and customer satisfaction.

Frequently asked questions
How do you choose the right UX research method?
Choosing the right research method depends on your goals. Some key things to consider are:
- The feature/product you’re testing
- The type of data you’re looking for
- The design stage
- The time and resources you have available
What is the best UX research method?
The best research method is the one you have the time, resources, and budget for that meets your specific needs and goals. Most research tools, like Maze, will accommodate a variety of UX research and testing techniques.
When to use which user experience research method?
Selecting which user research method to use—if budget and resources aren’t a factor—depends on your goals. UX research methods provide different types of data:
- Qualitative vs quantitative
- Attitudinal vs behavioral
- Generative vs evaluative
Identify your goals, then choose a research method that gathers the user data you need.
What results can I expect from UX research?
Here are some of the key results you can expect from actioning the insights uncovered during UX research:
- Improved user satisfaction
- Increased usability
- Better product fit
- Informed design decisions
- Reduced development costs
- Higher conversion rates
- Increased customer loyalty and retention
Tree Testing: Your Guide to Improve Navigation and UX
Just one more step to your free trial.
.surveysparrow.com
Already using SurveySparrow? Login
By clicking on "Get Started", I agree to the Privacy Policy and Terms of Service .
This site is protected by reCAPTCHA and the Google Privacy Policy and Terms of Service apply.
Enterprise Survey Software
Enterprise Survey Software to thrive in your business ecosystem
NPS® Software
Turn customers into promoters
Offline Survey
Real-time data collection, on the move. Go internet-independent.
360 Assessment
Conduct omnidirectional employee assessments. Increase productivity, grow together.
Reputation Management
Turn your existing customers into raving promoters by monitoring online reviews.
Ticket Management
Build loyalty and advocacy by delivering personalized support experiences that matter.
Chatbot for Website
Collect feedback smartly from your website visitors with the engaging Chatbot for website.
Swift, easy, secure. Scalable for your organization.
Executive Dashboard
Customer journey map, craft beautiful surveys, share surveys, gain rich insights, recurring surveys, white label surveys, embedded surveys, conversational forms, mobile-first surveys, audience management, smart surveys, video surveys, secure surveys, api, webhooks, integrations, survey themes, accept payments, custom workflows, all features, customer experience, employee experience, product experience, marketing experience, sales experience, hospitality & travel, market research, saas startup programs, wall of love, success stories, sparrowcast, nps® benchmarks, learning centre, apps & integrations, testimonials.
Our surveys come with superpowers ⚡
Blog Best Of
60+ User Experience Survey Questions & Free UX Survey Template
Last Updated:
10 July 2024
Table Of Contents
- User experience survey definition
- User experience survey questions
- User experience survey best practices
Looking to understand the “Why” behind your users’ behavior within your app? Need some sample user experience (UX) survey questions to customize and include in your own UX questionnaire ?
In this article, you’ll learn what a UX survey is, the best user experience survey questions you can ask your users, and the best practices for creating an effective UX questionnaire, along with a user satisfaction survey example template that you can use for free.
If you’re searching for a free user experience survey questionnaire , go ahead and use this for collecting critical insights into how users interact with your product or service without any incurring costs. It’s Free!
Try our UX survey to test the conversational experience!
By using this questionnaire, you can identify areas of improvement, increase user satisfaction, and ultimately drive product enhancements
Okay, now here’s everything we’ll cover. Use the links below to jump to a section that’s relevant to you:
What is a UX survey?
- 60+ user experience (UX) survey questions to ask your users
- 5 UX survey best practices
User research is essential when designing a new product or redesigning an existing one. You need to learn what works (and what doesn’t) to make UX changes and improve your UX.
A UX survey lets you gather quantitative and qualitative data about your users’ interactions and experiences within your app or software. You can gain a better understanding of why they started using your app, quickly gather feedback on a new, beta product, and gauge their overall satisfaction with your app.
That said, UX surveys, while helpful for gathering insights on user interactions and experiences, may not provide comprehensive information about user behavior, usability problems, or user needs and pain points, which can be better addressed through dedicated UX services such as user testing and usability studies.
60+ User Experience Survey Questions to Ask Your Users
Here are the UX survey questions to include in your UX questionnaire:
General Usability and Experience
- I understand what {product or app name} does.
- I know how to use {product or app name}.
- How useful is our product to you?
- Tell us about your experience using {product or app name}.
- How would you rate the user-friendliness of {product or app name} interface?
- Overall, how easy to use do you find {product or app name}?
- What do you find most frustrating about {product or app name}?
Feedback on Specific Features
- The usage of terms throughout the app is consistent.
- The positioning of messages across the screen is consistent.
- The prompts displayed for inputs are clear.
- Our app informs you about the progress of a task.
- The error messages displayed are helpful.
Create User Experience Surveys for Free!
Create Your Free Account and Start Instantly.
Please enter a valid Email ID.
- 14-Day Free Trial
- • Cancel Anytime
- • No Credit Card Required
- • Need a Demo?
Design and Aesthetics
- How would you rate the interface design of our app?
- I like the way this app looks.
- Is it easy to find what you’re looking for in the main navigation menu?
- Engagement and Usage Frequency:
- How often do you use our product?
- What features do you use the most on the app?
- Comparative and Competitive Analysis:
- How does {app or product name} compare to {competitor}?
- Which of our competitors did you consider before choosing us?
- Why choose us over competitors?
User Satisfaction Survey Questions
- Considering that you’ve used our interface extensively, how likely are you to recommend it to your friends and colleagues?
- On a scale of 1-10, how would your use of our app be impacted by {feature or update}?
- If you are unhappy with {product or app name}, what can we do to get you to come back?
- What was the one time you found our app to be highly satisfying?
Here’s a User satisfaction Survey Example created with SurveySparrow. Create a free account by singing up with your email and starte using it for free.
User Satisfaction Survey Template
Improvements and Suggestions
- How would you rate the usability of our app? Why?
- What would it be if you could improve one thing about the app?
- What is the one thing you wish the app could do that it doesn’t already?
- How can we improve {product or app name}? Send us your suggestions and ideas.
Miscellaneous
- What comes to your mind when considering {product or app name}?
- Anything else you want to share or get off your chest?
On a specific note, if you want to create a new, similar survey in just the nick of time, use the Surveys using AI feature from SurveySparrow that will help create a survey using AI.
Try Now for free!
14-Day Free Trial • No Credit Card Required • No Strings Attached
5 UX Survey Best Practices
Here are some best practices to follow when designing your UX questionnaire:
Have a goal
The first step is to define a goal for your UX survey. What aspects of your product or design are you looking to improve? What are you trying to learn about your users?
Keep it short and relevant
Make your UX surveys as quick and easy to complete as possible. Ask only those questions that would help you learn something that’s relevant to the goal of your survey
Check for bias
Ask neutral questions and avoid the leading ones. Check for certain phrases or words in a question that might force the respondent to pick a particular answer.
Keep it clear and transparent
Avoid jargon, acronyms, and terms your audience might not be familiar with. Also, tell them what you intend to collect with your survey and how you would use their data.
Provide incentives
If you want most of your user base to take your survey, you should provide financial incentives . Incentives are a great way to get more respondents and improve completion rates.
Create free user satisfaction surveys with SurveySparrow.
Claim your free account by signing up here and start creating numerous surveys for free.
Final thoughts
UX surveys help you gain insights into your product’s usability and your users’ overall experience. When done right, they will help you design a better product that helps your users accomplish their goals more efficiently. Use only the user experience survey questions examples that would help you achieve your UX survey’s goal. We hope this article will help you create a better UX questionnaire.
Are you looking to create and conduct UX surveys on your own? SurveySparrow provides you with everything you need to create and conduct conversational UX surveys that your users will love answering!
Conversational surveys typically tend to boost survey responses and create pleasant experiences for your users.
Most users will complete your survey as they would be pleased to take surveys that are conversational in nature and are quite different from the long, boring forms you’ve seen on the internet.
SurveySparrow provides you with a simple drag-and-drop interface and a free, premade UX survey template that anyone can use to create UX surveys in minutes without having to start from scratch.
If you’re looking to boost your survey responses and create pleasant experiences, take the conversational way and try SurveySparrow today!
Have you got any questions on UX surveys? Got any interesting tips or hacks for creating effective UX surveys? Let us know in the comment section below.
If you’re wondering whether SurveySparrow is the right fit for you and would rather have someone walk you through our platform, reach out to us for a free, personalized demo !
I'm a developer turned marketer, working as a Product Marketer at SurveySparrow — A survey tool that lets anyone create beautiful, conversational surveys people love to answer.
You Might Also Like
10 360 degree feedback examples for coworkers and teammates, 10 workplace trends for 2024, digital marketing questionnaire for client & student onboarding and market research, see it to believe it..
14-Day Free Trial • Cancel Anytime • No Credit Card Required • Need a Demo?
Start your free trial today
No Credit Card Required. 14-Day Free Trial
Request a Demo
Want to learn more about SurveySparrow? We'll be in touch soon!
Create Conversational UX Surveys!
Conversational surveys boost completion rates by 40% and create pleasant experiences.
14-Day Free Trial • No Credit card required • 40% more completion rate
Hi there, we use cookies to offer you a better browsing experience and to analyze site traffic. By continuing to use our website, you consent to the use of these cookies. Learn More
Root out friction in every digital experience, super-charge conversion rates, and optimize digital self-service
Uncover insights from any interaction, deliver AI-powered agent coaching, and reduce cost to serve
Increase revenue and loyalty with real-time insights and recommendations delivered to teams on the ground
Know how your people feel and empower managers to improve employee engagement, productivity, and retention
Take action in the moments that matter most along the employee journey and drive bottom line growth
Whatever they’re are saying, wherever they’re saying it, know exactly what’s going on with your people
Get faster, richer insights with qual and quant tools that make powerful market research available to everyone
Run concept tests, pricing studies, prototyping + more with fast, powerful studies designed by UX research experts
Track your brand performance 24/7 and act quickly to respond to opportunities and challenges in your market
Explore the platform powering Experience Management
- Free Account
- Product Demos
- For Digital
- For Customer Care
- For Human Resources
- For Researchers
- Financial Services
- All Industries
Popular Use Cases
- Customer Experience
- Employee Experience
- Employee Exit Interviews
- Net Promoter Score
- Voice of Customer
- Customer Success Hub
- Product Documentation
- Training & Certification
- XM Institute
- Popular Resources
- Customer Stories
- Artificial Intelligence
- Market Research
- Partnerships
- Marketplace
The annual gathering of the experience leaders at the world’s iconic brands building breakthrough business results, live in Sydney.
- English/AU & NZ
- Español/Europa
- Español/América Latina
- Português Brasileiro
- REQUEST DEMO
- Experience Management
- What is a survey?
- Survey Research
Try Qualtrics for free
What is survey research.
15 min read Find out everything you need to know about survey research, from what it is and how it works to the different methods and tools you can use to ensure you’re successful.
Survey research is the process of collecting data from a predefined group (e.g. customers or potential customers) with the ultimate goal of uncovering insights about your products, services, or brand overall .
As a quantitative data collection method, survey research can provide you with a goldmine of information that can inform crucial business and product decisions. But survey research needs careful planning and execution to get the results you want.
So if you’re thinking about using surveys to carry out research, read on.
Types of survey research
Calling these methods ‘survey research’ slightly underplays the complexity of this type of information gathering. From the expertise required to carry out each activity to the analysis of the data and its eventual application, a considerable amount of effort is required.
As for how you can carry out your research, there are several options to choose from — face-to-face interviews, telephone surveys, focus groups (though more interviews than surveys), online surveys , and panel surveys.
Typically, the survey method you choose will largely be guided by who you want to survey, the size of your sample , your budget, and the type of information you’re hoping to gather.
Here are a few of the most-used survey types:
Face-to-face interviews
Before technology made it possible to conduct research using online surveys, telephone, and mail were the most popular methods for survey research. However face-to-face interviews were considered the gold standard — the only reason they weren’t as popular was due to their highly prohibitive costs.
When it came to face-to-face interviews, organisations would use highly trained researchers who knew when to probe or follow up on vague or problematic answers. They also knew when to offer assistance to respondents when they seemed to be struggling. The result was that these interviewers could get sample members to participate and engage in surveys in the most effective way possible, leading to higher response rates and better quality data.
Free eBook: Learn how to increase response rates to your survey
Telephone surveys
While phone surveys have been popular in the past, particularly for measuring general consumer behaviour or beliefs, response rates have been declining since the 1990s.
Phone surveys are usually conducted using a random dialling system and software that a researcher can use to record responses.
This method is beneficial when you want to survey a large population but don’t have the resources to conduct face-to-face research surveys or run focus groups, or want to ask multiple-choice and open-ended questions .
The downsides are they can: take a long time to complete depending on the response rate, and you may have to do a lot of cold-calling to get the information you need.
You also run the risk of respondents not being completely honest . Instead, they’ll answer your survey questions quickly just to get off the phone.
Focus groups (interviews — not surveys)
Focus groups are a separate qualitative methodology rather than surveys — even though they’re often bunched together. They’re normally used for survey pretesting and designing , but they’re also a great way to generate opinions and data from a diverse range of people.
Focus groups involve putting a cohort of demographically or socially diverse people in a room with a moderator and engaging them in a discussion on a particular topic, such as your product, brand, or service.
They remain a highly popular method for market research , but they’re expensive and require a lot of administration to conduct and analyse the data properly.
You also run the risk of more dominant members of the group taking over the discussion and swaying the opinions of other people — potentially providing you with unreliable data.
Online surveys
Online surveys have become one of the most popular survey methods due to being cost-effective, enabling researchers to accurately survey a large population quickly.
Online surveys can essentially be used by anyone for any research purpose – we’ve all seen the increasing popularity of polls on social media (although these are not scientific).
Using an online survey allows you to ask a series of different question types and collect data instantly that’s easy to analyse with the right software.
There are also several methods for running and distributing online surveys that allow you to get your questionnaire in front of a large population at a fraction of the cost of face-to-face interviews or focus groups.
This is particularly true when it comes to mobile surveys as most people with a smartphone can access them online.
However, you have to be aware of the potential dangers of using online surveys, particularly when it comes to the survey respondents. The biggest risk is because online surveys require access to a computer or mobile device to complete, they could exclude elderly members of the population who don’t have access to the technology — or don’t know how to use it.
It could also exclude those from poorer socio-economic backgrounds who can’t afford a computer or consistent internet access. This could mean the data collected is more biased towards a certain group and can lead to less accurate data when you’re looking for a representative population sample.
When it comes to surveys, every voice matters.
Find out how to create more inclusive and representative surveys for your research.
Panel surveys
A panel survey involves recruiting respondents who have specifically signed up to answer questionnaires and who are put on a list by a research company. This could be a workforce of a small company or a major subset of a national population. Usually, these groups are carefully selected so that they represent a sample of your target population — giving you balance across criteria such as age, gender, background, and so on.
Panel surveys give you access to the respondents you need and are usually provided by the research company in question. As a result, it’s much easier to get access to the right audiences as you just need to tell the research company your criteria. They’ll then determine the right panels to use to answer your questionnaire.
However, there are downsides. The main one being that if the research company offers its panels incentives, e.g. discounts, coupons, money — respondents may answer a lot of questionnaires just for the benefits.
This might mean they rush through your survey without providing considered and truthful answers. As a consequence, this can damage the credibility of your data and potentially ruin your analyses.
What are the benefits of using survey research?
Depending on the research method you use, there are lots of benefits to conducting survey research for data collection. Here, we cover a few:

1. They’re relatively easy to do
Most research surveys are easy to set up, administer and analyse. As long as the planning and survey design is thorough and you target the right audience , the data collection is usually straightforward regardless of which survey type you use.
2. They can be cost effective
Survey research can be relatively cheap depending on the type of survey you use.
Generally, qualitative research methods that require access to people in person or over the phone are more expensive and require more administration.
Online surveys or mobile surveys are often more cost-effective for market research and can give you access to the global population for a fraction of the cost.
3. You can collect data from a large sample
Again, depending on the type of survey, you can obtain survey results from an entire population at a relatively low price. You can also administer a large variety of survey types to fit the project you’re running.
4. You can use survey software to analyse results immediately
Using survey software, you can use advanced statistical analysis techniques to gain insights into your responses immediately.
Analysis can be conducted using a variety of parameters to determine the validity and reliability of your survey data at scale.
5. Surveys can collect any type of data
While most people view surveys as a quantitative research method, they can just as easily be adapted to gain qualitative information by simply including open-ended questions or conducting interviews face to face.
How to measure concepts with survey questions
While surveys are a great way to obtain data, that data on its own is useless unless it can be analysed and developed into actionable insights.
The easiest, and most effective way to measure survey results, is to use a dedicated research tool that puts all of your survey results into one place.
When it comes to survey measurement, there are four measurement types to be aware of that will determine how you treat your different survey results:
Nominal scale
With a nominal scale , you can only keep track of how many respondents chose each option from a question, and which response generated the most selections.
An example of this would be simply asking a responder to choose a product or brand from a list.
You could find out which brand was chosen the most but have no insight as to why.
Ordinal scale
Ordinal scales are used to judge an order of preference. They do provide some level of quantitative value because you’re asking responders to choose a preference of one option over another.
Ratio scale
Ratio scales can be used to judge the order and difference between responses. For example, asking respondents how much they spend on their weekly shopping on average.
Interval scale
In an interval scale, values are lined up in order with a meaningful difference between the two values — for example, measuring temperature or measuring a credit score between one value and another.
Step by step: How to conduct surveys and collect data
Conducting a survey and collecting data is relatively straightforward, but it does require some careful planning and design to ensure it results in reliable data.

Step 1 – Define your objectives
What do you want to learn from the survey? How is the data going to help you? Having a hypothesis or series of assumptions about survey responses will allow you to create the right questions to test them.
Step 2 – Create your survey questions
Once you’ve got your hypotheses or assumptions, write out the questions you need answering to test your theories or beliefs. Be wary about framing questions that could lead respondents or inadvertently create biased responses .
Step 3 – Choose your question types
Your survey should include a variety of question types and should aim to obtain quantitative data with some qualitative responses from open-ended questions. Using a mix of questions (simple Yes/ No, multiple-choice, rank in order, etc) not only increases the reliability of your data but also reduces survey fatigue and respondents simply answering questions quickly without thinking.
Find out how to create a survey that’s easy to engage with
Step 4 – Test your questions
Before sending your questionnaire out, you should test it (e.g. have a random internal group do the survey) and carry out A/B tests to ensure you’ll gain accurate responses.
Step 5 – Choose your target and send out the survey
Depending on your objectives, you might want to target the general population with your survey or a specific segment of the population. Once you’ve narrowed down who you want to target, it’s time to send out the survey.
After you’ve deployed the survey, keep an eye on the response rate to ensure you’re getting the number you expected. If your response rate is low, you might need to send the survey out to a second group to obtain a large enough sample — or do some troubleshooting to work out why your response rates are so low. This could be down to your questions, delivery method, selected sample, or otherwise.
Step 6 – Analyse results and draw conclusions
Once you’ve got your results back, it’s time for the fun part.
Break down your survey responses using the parameters you’ve set in your objectives and analyse the data to compare to your original assumptions. At this stage, a research tool or software can make the analysis a lot easier — and that’s somewhere Qualtrics can help.
Get reliable insights with survey software from Qualtrics
Gaining feedback from leads is critical for any business, data gathered from surveys can prove invaluable for understanding your products and your market position, and with survey software from Qualtrics, it couldn’t be easier.
Used by more than 13,000 brands and supporting more than 1 billion surveys a year, Qualtrics empowers everyone in your organisation to gather insights and take action. No coding required — and your data is housed in one system.
Get feedback from more than 125 sources on a single platform and view and measure your data in one place to create actionable insights and gain a deeper understanding of your target customers .
Automatically run complex text and statistical analysis to uncover exactly what your survey data is telling you, so you can react in real-time and make smarter decisions.
We can help you with survey management, too. From designing your survey and finding your target respondents to getting your survey in the field and reporting back on the results, we can help you every step of the way.
And for expert market researchers and survey designers, Qualtrics features custom programming to give you total flexibility over question types, survey design, embedded data, and other variables.
No matter what type of survey you want to run, what target audience you want to reach, or what assumptions you want to test or answers you want to uncover, we’ll help you design, deploy and analyse your survey with our team of experts.
Ready to find out more about Qualtrics CoreXM?
Start your survey research today with Qualtrics
Related resources
Survey bias types 24 min read, post event survey questions 10 min read, questionnaires design 15 min read, best survey software 16 min read, survey vs questionnaire 12 min read, close-ended questions 7 min read, likert scales 14 min read, request demo.
Ready to learn more about Qualtrics?

Useful UX Research Survey Questions
What is the user experience research survey? How to prepare the questionnaire? And what questions to ask to obtain quantitative and qualitative data? If you’re looking for answers to these questions, you couldn’t have found a better place. We have prepared ready-made solutions to help you prepare user experience survey templates tailored to your needs.
Learn How to Conduct Website UX Survey
UX research is a process of collecting information on the behavior, needs, and expectations of users of websites, applications, products, or services. We conduct them to improve the experience of Internet users or increase customer satisfaction.
In this article, we will concentrate on a practical approach to UX research. We will show you how to create an online survey for conducting website UX studies and discuss the most crucial components of the questionnaire and the types of questions that work best in the UX research survey to provide valuable user feedback.
Try one of the best UX survey tools for free!
Start trial period without any credit card or subscription and easily gather user experience feedback via link, social media, email, and more.
Create first survey
No credit card required · Cancel any time · GDRP Compilant
What Is a User Experience Research Survey?
Before we go into practice and collect UX feedback, let’s get to know the definition of this issue. For the development of a product or service (to increase sales, online shoppers, or user interactions on our website), it is crucial to understand the recipient’s view, learn about their problems and challenges, and then solve their problems to improve the UX of most users. Why the most of them? Because we’ll never satisfy everyone, right?
User Experience Research Survey is a tool that allows you to gather the data necessary to collect key information for this process. With the help of a well-crafted questionnaire and surgically precise questions, we can obtain quantitative data and meaningful insights into change and development. The survey gives us an insight into the view of users. It is an opportunity to learn their natural reactions in contact with our product, service, or program.
Gathering feedback requires the right questions, as there is no one ready-made template. Every situation is different. However, within the next few minutes, we will show you how to create a questionnaire to increase your chances of getting valuable insights.
Why survey? Because it helps you save time and money, automatically collecting quantitative data. The professional survey tool, like Startquestion, also provides analytics. You can prepare questions and send them to respondents, collect the results, prepare reports and draw impactful conclusions.
Ready to move forward? Let’s check what we need to keep in mind when preparing the User Experience Research Survey.

Use analytical tools for your UX research.
Things to Consider When Preparing UX Survey
In this section, we will present the seven main principles of a good UX feedback questionnaire. Grab a cup of coffee and enjoy your reading.
Introduce Yourself to the Audience
Introduction to the UX survey is a place to encourage respondents to take part in the survey. If we send our questionnaire by e-mail, it is worth informing the respondents about the subject and purpose of the study at the beginning.
Good practice also suggests providing the approximate time needed to complete the user survey and explaining what we will do with the collected data. The introduction to the questionnaire also includes the basics of netiquette. The more polite and helpful we are to the respondents, the greater the chance they will repay us by devoting their time to providing reliable user insights.
Keep UX Survey Questions Simple
It is one of the most important rules for a good questionnaire. Each question or instruction must be understandable to the respondent. Besides – the name obliges. Since you are sending a survey on improving user experience, make sure that completing it is also a pleasure, not a chore.
How to check if the questionnaire is user-friendly? Conduct a pilot study. Send the survey to colleagues at work, and see how they cope with it. Ask if anything was incomprehensible to them. If so, please correct the questionnaire before sending it to respondents. Remember to keep your language simple and consistent in every question or instruction.
Choose the Right Type of Survey Question
Each questionnaire should ask the right questions to the right people at the right time. Therefore, in creating a survey, the way you ask is so important. The format should be appropriately adapted to the examined issue to facilitate the respondent’s task.
The rule is simple: take care of the positive experiences of people completing the survey for a greater chance of a high response rate.
In the Startquestion platform , you will find 19 types of questions, from open-ended questions; closed questions; single, or multiple-choice questions; scale; matrix; net promoter score; drag and drop; to the text box to type the answer, or overall rating.

Choose the best user experience survey questions to ask.
Avoid UX Survey Questions Bias
A questionnaire bias is a serious trap in user experience surveys. We unconsciously put it not so much on the respondent but ourselves. Incorrectly constructed questions, even with good faith and willingness of the respondent, may yield worthless answers that will not bring us meaningful data. And thus, we will have to repeat our UX research.
What to keep in mind hoping for qualitative data?
A question bias in a user survey is related to suggesting possible answers. For a better understanding of the issue let’s take a look at an example.
Suppose you’d like to ask such a question: “What problems did you encounter when installing our application?”. It’s not a good one for a UX feedback survey. It suggests looking for troubles only. To evaluate the whole process, ask the following question: “Was installing the application easy or complicated for you?”
It is just one example of a bias in a questionnaire. Others may concern, i.a., looking for confirmation of your hypotheses (confirmation bias), favoring selected issues, the tone in questions, or closing answers only to those specified by us, not by the user. Hint: UX survey is about to address pain points, not collect positive responses only.
Use Clear and Concise Language
“If you can’t explain it simply, you don’t understand it well enough.”
Keep in mind Albert Einstein’s words. And remember a simple rule: if respondents have to check on the Internet what the author of the question meant, they will lose not only time but also patience. Simple, understandable language is the basis of a good user research questionnaire, even if we want to get answers to complex questions and problems.
Design for Conditionality
A good questionnaire is based on logic.
When working on the perfect template for your research, keep in mind the correct question format and avoid bias. The order of the questions is equally important, especially when they are related, and the answer to the first affects the sound of the second. Do not place them randomly on the questionnaire.
Survey software helps to control the logic of the survey by displaying the questions conditionally to the respondents. Thanks to this, you will ensure a higher user experience, which will help provide you with a higher response rate and more qualitative data.
Reward Respondents for Their Time & Feedback
Finish your questionnaire with a thank you note. Explain (or remind) respondents how you will use their feedback. Inform them if you intend to share your survey results with them. We recommend doing so.
It is a good practice to reward respondents for their feedback. It is especially true of time-consuming studies. The rewards may be financial (e.g., free access to online courses or webinars, ebooks, discount coupons) or non-financial (e.g., to provide a sense of influence).
A personalized thank you note (add name, surname, or job title) for participating in the UX survey will show your appreciation and encourage respondents to participate in your further client or customer feedback studies.

An example of a Net Promoter Score (NPS) question.
Popular UX Research Survey Questions Examples
We already know what to consider when preparing our questionnaire. We now take a look at what UX design research questions should be in it. Here are the most popular user experience survey questions types and specific examples that will help you create perfect user surveys.
User Expectations and Impressions Questions
This type of UX research question is closely related to users’ expectations and impressions. First impression matters, right? We want to know the feelings (related to customer satisfaction) of respondents in contact with our features, website, product, or service. This stage of the study also allows you to verify the expectations of users in comparison with the solution we propose.
Here are sample questions to ask in that part of a user survey:
- Have you come across a similar new feature on the market?
- Would this feature be useful for you and in what way?
- How would you start your first project in this program?
- Do you trust that this online service is safe?
- What are your first impressions of contact with the product?
General Feedback Questions
The next group of questions necessary to create a user experience survey template is aimed to collect feedback on the respondent’s contact with the website, product, or service. We ask the respondents to perform a specific task (in the case of survey software, this would be the first project), and then we check the effort put into its implementation. Post-task questions in UX surveys might look like this:
- How would you execute the following command? [insert task]
- Describe how did you set up the first project:
- What was the easiest / hardest part of your assignment?
- Did you use the new feature while completing the task?
- How long did it take you to prepare the questionnaire?
Specific Task Usability Questions
This group of UX design research questions works very well when testing a website, SaaS, or new features that we want to verify before launching the product on the market. General feedback questions check impressions of the entire process. Specific task usability questions (tasks) provide an in-depth analysis of each of their stages. Let’s see what they look like in practice:
- Log in to the platform and change your password
- Set up a new newsletter mailing list
- Change the type of question number 5 in the questionnaire
- Reply to a new message from the clients’ support section
- Navigate to the landing page/pricing page and buy an e-book about SEO
UX Discovery and Behavioral Questions
Another meaningful part of the user experience survey template is UX discovery and behavioral questions. These types of questions serve to deepen user surveys.
Remember when we said that the questionnaire should base on logic? By preparing it in the online version following the principles of design and conditionality, we can display specific questions to respondents, asking them to expand the answer.
Here are some examples of such follow-up questions in a user survey:
- Why did you think the checkout was not intuitive?
- What specifically made you appreciate the app interface so high?
- How can sorting folders make your daily work easier?
- Are existing features better than the new ones?
- Why do you negatively evaluate the colors of the new website?

UX research question about features.
User Experience Survey Questions – Key Takeaways
Writing survey questions to obtain quantitative and qualitative data is a challenge.
However, with a good understanding of the issue and a little help from a user-friendly survey tool, you may prepare a questionnaire template that will enable you to collect user insights.
What to Keep in Mind to Conduct UX Surveys:
- Ask for honest and direct feedback
- Create a survey form easy to complete
- Make every survey question as simple as possible
- Prepare UX survey questions early
- Avoid bias, address pain points
- Dig deeper with follow up questions
- Be nice and polite to your respondents
- Take care of their positive experience
Ready to create your first UX research?
Try online surveys to make your job easier.

Author: Dariusz Jaroń
Updated: 07 March 2023

How to Understand and Manage Customer Expectations
Customers are not just looking for products or services; they crave experiences that resonate with their needs and values. This article examines how businesses can not only meet but exceed what customers expect, forging lasting relationships and fueling growth.

Analyzing Open Ended Survey Responses with AI – Meet Insightomat
While closed-ended questions provide quick and quantifiable data, open-ended questions unlock deeper insights into customer sentiments and behaviors. But how do you efficiently analyze the wealth of qualitative data that open-ended questions generate?

Qualitative Survey Questions with Some Examples
Understanding your customers' experiences and perceptions is crucial for enhancing your products and services. While quantitative research provides numerical insights, qualitative survey questions dive deeper, exploring the "why" behind customer behaviors.
- Product Management
- Product Roadmap
- Team Alignment
- Idea Management
- Prioritization
- Product Strategy
- Product Development
- Customer Experience
- User Research
Home » Top 15 User Research Tools for Your Product Development 2024
Top 15 User Research Tools for Your Product Development 2024
This article contains:
- Introduction
Top 15 User Research Tools
Things to consider while choosing a user feedback tools.
- 5 Key Values User Feedback Tools Can Provide.
Summary Table
Introduction .
Imagine being able to access your user’s mind. Would you know more about how people use your product? Absolutely! You can streamline your process, cut down on repetitive duties by tapping into the best user research tools. There are a lot of parameters to take into account while using tools for user research, the main ones include:
- Recruiting & Screening
- Qualitative and Quantitative Methodology
- Analysis & Reporting
Sounds complicated? Do not worry, we’ve got you covered.
Every researcher needs to be aware of these 15 best user research tools. Let’s deep-dive into each of them one by one

Starting out with the best user research tool out there, we have Chisel at the top of the list.
It provides a bird’s-eye view of a product’s lifecycle. This helps you keep an eye on what features are in development now and at the launch.
How Do Chisel’s User Research Features Help You?
- The timeline view gives you a big-picture look at the roadmap and makes the plan clear. In strategic planning, you have to be able to see the big picture, and Chisel makes it happen.
- The Kanban view shows the entire scope of the roadmaps. This lets you see how projects are doing in the backlog, staging, and production stages.
- Using Idea Box, the user research tool makes it easy to collect, sort, rank, and arrange ideas. It also helps get upright feedback from customers through its own customer portal and user surveys.
- Chisel gives you the tools to figure out the priority score of different features. Not only that, but it also shows how the teams align for these scores.
Rating:
G2- 4.9 / 5
- Premium: 49$ per maker per month
- Enterprise: Contact Sales
2. User Interviews

User interviews is a research tool that brings together participants and researchers.
How Do User Interviews Research Features Help You?
- You can filter out possible participants from the selection to identify the most suitable individuals for your research. Their main filters include age, location, and industry.
- Recruit makes it possible to get in touch with a lot of possible participants easily.
- If one cancels right before the meeting, the software links you with the next accepted user.
- Various payment options are available to participants
- Automated email reminders for scheduling
- Thorough screening for participant profiles
In short, you need not worry about screening, arranging, and giving out incentives. User Interviews takes care of it for you automatically.
G2- 4.7 / 5
- Pay as you go: 49$ per session
- Essential: $36 per session
- Custom: Lowest Rate billed annually
Hotjar, as a user research tool in analytics, helps you find out how people surf your website.
How Do Hotjar User Research Features Help You?
- Realtime playbacks of user actions let you observe where clicks, scrolls, and mouse cursors move.
- It can identify where “rage clicks” occur, which are typically a bunch of loud clicks in one spot.
- Hotjar has a survey tool that lets you make focused polls for users and people in online groups.
- This way, you can learn more about your audience and get their ideas and suggestions.
It can also make a tip box for users so that you can get straight feedback from them about your:
- Mobile app
You can connect Hotjar with tools like Google Optimize, Segment, Optimizely, and Omniconvert. If you have a Zapier account, you can link Hotjar to it to access more premium tools.
G2- 4.3 / 5
Pricing:
- Basic: Free
- Plus: $32 per month
- Business: $80 per month
- Scale: $171 per month
4. User Testing
UserTesting is a tool for user stats that lets you get feedback from both online and real-life users.
You can find testers in UserTesting’s online group based on demographics such as age, gender, area, and so on.
How Do User Testing Research Features Help You?
- The user research tool helps find trends from multiple testing rounds by making highlight reels for you.
- User pathway mapping feature helps if you want to know how people use your website, product, or mobile app
- It can help you find places where customers are having trouble, which could lead to a higher churn rate.
- Plus, they get rid of people who don’t focus to polls, questions, etc.
G2- 4.5 / 5
Contact Sales team for pricing details.

Maze is a complete piece of user research tool. It is an enhanced user testing and analytics research tool that helps organizations with quick, remote user testing and get useful information
It’s easy to set up and run usability tests with Maze. You can change the testing methods to fit every scenario.
How Do Maze’s User Research Features Help You?
- Website testing
- Prototype testing
- Tree testing
- Card sorting
- Unmoderated user tests.
The user research tool gives you thorough analytics on how users perform and behave.
Heatmaps, click rates, and task completion time work as the tracking features here. This information helps you find problems with how easy it is to use.
- Starter – $99 per month
- Organization – Contact Sales Team

Figjam is an interactive whiteboarding and planning user research tool. It helps teams visually collaborate and share insights.
How Do Figma’s User Research Features Help You?
- The user research tool helps designers and researchers to graphically plan user journeys, build interactive prototypes, and cooperatively aggregate and arrange data.
- FigJam lets several individuals collaborate in real time. Sticky notes and flow charts help them readily arrange ideas and results. This helps one visualize user comments really well.
- Voting stickers and emoji responses help in interactive feedback sessions. This helps to simplify team discussion, consensus building, or critical topic highlighting.
- Easy connection with design tools—especially Figma—allows for a smooth shift from research to design.
To further simplify your research analysis process, you also have access to:
- Plugins with integrations like JIra, Github and Asana
$5 per editor / month
7. SurveyMonkey

SurveyMonkey is a strong user research platform that assists researchers in collecting thorough data.
How Do Survey Monkey’s User Research Features Help You?
- Collects data by using emails, online links, and integrated forms on their website or via social media.
- Researchers especially like it because of its flexible survey forms and strong data analysis advantages.
- Advanced survey logic and customizing choices in the software help to fit surveys to particular research goals.
- SurveyMonkey helps researchers do insightful studies of survey answers. It does this by offering strong data analysis features.
G2- 4.4 / 5
Pricing :
Contact Sales Team
8. DoveTail

Dovetail is a complete user research tool. It is a consumer feedback solution that enables teams to save, examine, and coordinate research data.
How Do Dovetail’s User Research Features Help You?
- The user research tool provides a centralized location for analyzing qualitative data from user feedback and research.
- It helps in assisting researchers in organizing, analyzing, and making better use of the data.
- Dovetail lets researchers methodically control and examine several data types. These include transcripts of interviews, survey answers, and user testing notes.
- This software also lets researchers label and code data, thereby improving categorization and information retrieval for theme studies.
- Dovetail improves communication and decision-making by allowing the delivery of interesting reports and ideas across teams.
Rating:
- Professional: $29 per month

ProdPad is a solution for product management to help teams stay on track to create incredible products.
How Do ProdPad’s User Research Features Help You?
- It lets stakeholders record and rank user evaluations and feature requests. This enables efficient feedback management.
- The user research tool helps you by providing a complete suite with all you need to monitor projects and handle the product lifetime from design to release.
- ProdPad tackles issues including absent lines of communication and confusing product roadmaps.
Its best qualities include:
- Easy route mapping
- Seamless interaction with Pivotal Tracker
- Strong capabilities for compiling and using stakeholder comments.
- Roadmaps Essentials: $24 per editor
- Roadmaps Advanced: $44 per editor
- Ideas Essentials: $24 per editor
- Ideas Advanced: $36 per editor
- Feedback Essentials: $24 per editor
- Feedback Advanced: $36 per editor
10. Otter.ai

Otterai is an artificial intelligence transcription and note-taking software that turns audible speech into textual content.
You can save plenty of time using Otter.ai to compile and translate user interviews. Additionally, it provides tools for modifying and arranging the transcriptions .
In this way, UX researchers can easily search transcripts for particular keywords or subjects. This helps one to locate and examine key areas of dialogue about their topic.
How Do Otter.ai’s User Research Features Help You?
- The user research tool can name and mark several speakers in a discussion. In group environments or diverse participant interviews, this is very helpful.
- You can also share these transcripts with stakeholders or team members.. This function enables group study and conversation of user comments.
- For remote UX research, Otter.ai connects with video conference solutions such as Zoom and Google Meet.
- Starting immediately on these platforms allows one to capture and examine remote exchanges more quickly.
- Pro: $17 per month
- Business: $30 per month
- Enterprise: Contact Sales team
11. Typeform

Typeform is an online user research tool that allows users to design and deliver qualitative analysis.
How Do Typeform’s User Research Features Help You?
- They include dynamic quizzes, questionnaires, and surveys to compile statistics and get opinions.
- Typeform provides several blueprints.
- This allows UX researchers to easily construct forms and surveys specific to their particular demands. These models allow one to fit the assignment’s tone and identity.
- You can also include images, videos, and GIFs in the surveys and forms.
- In UX research, this may especially help to show user design mock-ups, prototypes, or specialized situations.
Users generally find Typeform surveys more fun to complete than ordinary forms. Its easy and interesting design can result in better response rates.
- Basic: $29 per month
- Plus: $59 per month
- Business: $99 per month

Miro is an online, real-time user research tool that enables teams working remotely to collaborate efficiently. In an interactive visual workstation, it is excellent for organizing, brainstorming, and developing.
How Do Miro.com’s User Research Features Help You?
- It enables to solve for many tasks from user journey mapping to sprint planning.
- Miro allows accessible models for UX design, agile processes, and strategy development, among other usage scenarios.
- Teams using live cursors and simultaneous editing can function simultaneously anywhere.
- Miro.com has tools such as sticky notes, voting, and timers to support engaging seminars or brainstorming sessions.
G2- 4.8 / 5
- Starter: $8 per month
- Business: $16 per month
13. Userbrain

Userbrain is another piece of software for usability testing. It helps evaluate and establish customer experiences by getting feedback all the time.
How Do Userbrain’s User Research Features Help You?
- The software lets testers take screenshots and record videos. Users can also share their experiences and add voice notes to depict the state of the product.
- Userbrain lets product managers run tests according to area, gender, age, and other factors.
- It also makes it easier to make test cases and links that you can share with people.
- The user research tool helps executives set up recurring tests and make an automatic plan for user testing.
Prominent features include:
- Issue tracking
- Access control
- Audience targeting
- Task management
- Progress Tracking
- Starter: $124 per month
- Pro: $374 per month
- Agency: $999 per month

Asana is a SaaS tool for user research and teamwork that helps teams keep track of their tasks and plan them. It’s known for having a strong set of features and an easy-to-use layout.
How Do Asana’s User Research Features Help You?
- It lets you construct, distribute, and monitor tasks so that everyone knows what they need to do and when they need to do it.
- Gantt charts let you see project timelines so you can keep track of work and allocation.
- You can make your work easier by even connecting tools like Slack, Google Drive, and Microsoft Teams.
- Personal: Free
- Starter: $11 per month
- Advanced: $24 month
- Enterprise: Contact Sales Team
15. Useberry

Useberry is a user research tool that allows you to run tests in an unmoderated manner.
The fact that you can intergate tools like Protopie, Adobe XD, Sketch, Marvel, and InVision is one of the best things about Useberry.
How Do Useberry’s User Research Features Help You?
- In addition to basic Figma prototypes, this lets you try more complicated and real prototypes with your users.
- The software’s User Flow features lets Figma variants connect with each other in a seamless manner.
- This lets you look at how users explore and interact with different design variations as part of your analysis.
- You will have a thorough idea of how people move along lines and use complicated interfaces while doing so.
- $67 per month
- Custom Pricing: Contact Sales Team
Right before you pick a UX research method, you should think about these four things:
1. The Product Phase
Does it have to be brand new, or is it already on the market? Your approach to doing research should be different for different situations.
If the product is already in use, getting feedback from current users can help you learn more. You can also look for trends in the data that already exists.
But in the early stages of an endeavor, you can try out new ideas and make changes for the future.
2. Duration
You should also keep in mind the time it takes to do the study, analyze it, and write it up so you can use it again in the future.
This is because it’s not always easy to evaluate a study method. Some tests, like an A/B test, take a long time to do but are easy to grade, while others, like a usability test, may take less time to do but are harder to evaluate.
Do you have enough capital to do this research? You may need to visit the person to observe or talk to them according to the study method you pick.
Or offer to drive them to and from your office. You might need to give gift certificates to the people who take part in the study as a thank you for their time.
All of these budgetary issues need to be thought about ahead of time.
4. What kind of information
What exactly is it that you’re looking for? Does the why and how to solve the issue matter to you? Or are you looking to just quantify your results?
How people interact with your product is another question you could ask yourself. These questions and more will change the way you do your research project.
5 Key Values a User Feedback Tools Can Provide.
We have discussed what are the best tools out there, now lets peel back a little and also quickly understand the true value of a user feedback tool.
Real-Time User Feedback
User feedback tools let you get suggestions from customers in real time. This makes sure that it properly reflects their goals and requirements. ?
Organized data arrangement
User feedback tools give you information in a way that is easy to understand. You can search for particular words or grades and make choices according to the data. ?
Quick prompts on important feedback
User feedback tools let you know right away when you get negative feedback. This feedback can either be from important and risky customers or positive feedback that could lead to an accomplishment story. ?
Visualization of KPIs
The best user research tools have graphs and charts that you can customize. They also come with set KPIs that help you measure how happy your customers are.
You can see how your scores and reviews change over time, figure out what your efforts are doing, and then make your goods and services better based on what you learn.
Effortless Survey Delivery
Sending feedback forms to users and leads is simple with user feedback tools. You don’t need to use external products to do this.
| Chisel | FreemiumPremium: 49$ per maker per monthEnterprise: Contact Sales | 4.9 / 5 |
| User Interviews | Pay as you go: 49$ per sessionEssential: $36 per sessionCustom: Lowest Rate billed annually | 4.7 / 5 |
| Hotjar | Basic: FreePlus: $32 per monthBusiness: $80 per monthScale: $171 per month | 4.3 / 5 |
| User Testing | Contact Sales team for pricing details. | 4.5 / 5 |
| Maze | FreeStarter – $99 per monthOrganization – Contact Sales Team | 4.5 / 5 |
| FigJam | $5 per editor / month | 4.5 / 5 |
| Survey Monkey | Contact Sales Team | 4.4 / 5 |
| DoveTail | FreeProfessional: $29 per monthEnterprise: Contact Sales | 4.4 / 5 |
| ProdPAd | Roadmaps Essentials: $24 per editorRoadmaps Advanced: $44 per editorIdeas Essentials: $24 per editorIdeas Advanced: $36 per editorFeedback Essentials: $24 per editorFeedback Advanced: $36 per editor | 4.3 / 5 |
| Otter.ai | Basic: FreePro: $17 per monthBusiness: $30 per monthEnterprise: Contact Sales team | 4.3 / 5 |
| TypeForm | Basic: $29 per monthPlus: $59 per monthBusiness: $99 per monthEnterprise: Contact Sales team | 4.5 / 5 |
| Miro.com | FreeStarter: $8 per monthBusiness: $16 per monthEnterprise: Contact Sales team | 4.8 / 5 |
| User Brain | Starter: $124 per monthPro: $374 per monthAgency: $999 per month | 4.8 / 5 |
| Asana | Personal: FreeStarter: $11 per monthAdvanced: $24 monthEnterprise: Contact Sales Team | 4.4 / 5 |
| Userberry | Free$67 per monthCustom Pricing: Contact Sales Team | 4.5 / 5 |
Hoping to become more customer-focused? Do this by building trust and making the experience better for customers, instead of focusing on how easy the tool is to use. We hope this review will help you figure out which user experience will help you do that.
You should always and completely follow through with your user experience management program. To do this, you need to keep getting feedback from your viewers through all the user experience tools.
But keep in mind that not all user research tools make it easy to look at your feedback and act on it. Thus, be sure that the software you choose, such as Chisel, can handle all of your tasks.
More to Read From Chisel :-
- 12 Best Practices to Improve User Onboarding Process
- 12 Tips to Boost Remote Work Collaboration In 2024
- How to Conduct User Sentiment Analysis In 2024
Crafting great product requires great tools. Try Chisel today, it's free forever.
- Services & Info
- Information Security - UNT System
- Name Change Services
- Distributed IT Support Groups
- HelpDesk Technology Services
- EagleConnect
- Microsoft 365
- Remote Software Access
- AnyConnect VPN Client
- LockDown Browser
- Mathematica
- Microsoft Office
- LinkedIn Learning
- Search Type THIS SITE ALL of UNT Search Search
- Quicklinks:
- STUDENT EMAIL
- UNT DIRECTORY
Qualtrics Online Surveys
Create online surveys to collect and analyze data for your academic research, user satisfaction, and website feedback.
Do not collect confidential information in Qualtrics. Confidential information includes, but is not limited to, student information protected by FERPA, personal health information protected by HIPPA, and personally identifiable information (SSNs, DOBs, etc). Commercial use is prohibited.
Learn Qualtrics
- Academic Support Portal : Primary portal for all Qualtrics Support, documentation, community boards, etc.
- Survey Platform documentation : The Qualtrics knowledge base covers the use of every section, tab, and setting of the survey platform. Start with Projects Overview to create your first survey or jump right into learning the Survey Editor .
- Experience Basecamp : On-demand video courses guide you through survey development. It's recommended to start with the Learn to Use Research Core series. You must be signed in to authorize the application on your account.
- Qualtrics Support : Qualtrics provides chat, email, phone, and an online community board to help with your questions. You must be signed in to receive support.
Brand Administrator
Support hours.
Current Hours: Monday–Thursday: 8 a.m.- 9 p.m. (CST) Friday: 8 a.m.- 5 p.m. (CST) Saturday–Sunday: 11 a.m.- 3 p.m. (CST)
Current Walk-in Hours: Monday–Friday: 8 a.m.- 5 p.m. (CST)
Contact Information
Call: 940-565-2324 Email: [email protected] Walk-in: Sage Hall , Room 330
Numbers, Facts and Trends Shaping Your World
Read our research on:
Full Topic List
Regions & Countries
- Publications
- Our Methods
- Short Reads
- Tools & Resources
Read Our Research On:
Frequently Asked Questions
Why am i never asked to take a poll.
You have roughly the same chance of being polled as anyone else living in the United States. This chance, however, is only about 1 in 170,000 for a typical Pew Research Center survey. To obtain that rough estimate, we divide the current adult population of the U.S. (about 255 million) by the typical number of adults we recruit to our survey panel each year (usually around 1,500 people). We draw a random sample of addresses from the U.S. Postal Service’s master residential address file. We recruit one randomly selected adult from each of those households to join our survey panel. This process gives every non-institutionalized adult a known chance of being included. The only people who are not included are those who do not live at a residential address (e.g., adults who are incarcerated, living at a group facility like a rehabilitation center, or living in a remote area without a standard postal address).
Can I volunteer to be polled?
While we appreciate people who want to participate, we can’t base our polls on volunteers. The key to survey research is to have a random sample so that every person has a chance of having their views captured. The kinds of people who might volunteer for our polls are likely to be very different from the average American – at the very least they would probably be more politically interested and engaged, which would not be a true representation of the general population.
Why should I participate in surveys?
Polls are a way for you to express your opinions to the nation’s leaders and the country as a whole. Public officials and other leaders pay attention to the results of polls and often take them into account in their decision-making. If certain kinds of people do not participate in the surveys, then the results won’t represent the full range of opinions in the nation.
What good are polls?
Polls seek to measure public opinion and document the experiences of the public on a range of subjects. The results provide information for academics, researchers and government officials and help to inform the decision-making process for policymakers and others. Much of what the country knows about its media usage, labor and job markets, educational performance, crime victimization and social conditions is based on data collected through polls.
Do pollsters have a code of ethics? If so, what is in the code?
The major professional organizations of survey researchers have very clear codes of ethics for their members. These codes cover the responsibilities of pollsters with respect to the treatment of respondents, their relationships with clients and their responsibilities to the public when reporting on polls. Some good examples of a pollster’s Code of Ethics include:
American Association for Public Opinion Research (AAPOR)
Council of American Survey Research Organizations (CASRO)
You can read Pew Research Center’s mission and code of ethics here .
How are your polls different from market research?
One main difference is the subject matter. Market research explores opinions about products and services and measures your buying patterns, awareness of products and services or willingness to buy something. Our polls typically focus on public policy issues, mainly aimed at informing the public. We also try to measure topics like how voters are reacting to candidates in political campaigns and what issues are important to them.
Do you survey Asian Americans?
Yes. Our surveys are representative of the entire adult population of the United States and accurately account for the full population’s diversity by age, gender, race and ethnicity, region, and socioeconomic factors such as education levels, household income and employment status. We do not exclude anyone from our analyses based on his or her demographic characteristics. With the American Trends Panel, the Center release results specifically for Asian Americans in multiple reports each year.
How are people selected for your polls?
Most of our U.S. surveys are conducted on the American Trends Panel (ATP), the Center’s national survey panel of over 10,000 randomly selected U.S. adults. ATP participants are recruited offline using random sampling from the U.S. Postal Service’s residential address file. Respondents complete the surveys online using smartphones, tablets or desktop devices. We provide tablets and data plans to adults without home internet.
Do people lie to pollsters?
We know that not all survey questions are answered accurately, but it’s impossible to gauge intent and to say that any given inaccurate answer necessarily involves lying. People may simply not remember their behavior accurately.
More people say they voted in a given election than voting records indicate actually cast ballots. In some instances, researchers have actually verified the voting records of people who were interviewed and found that some of them said they voted but did not. Voting is generally considered a socially desirable behavior, like attending church or donating money to charity. Studies suggest these kinds of behaviors are overreported. Similarly, socially undesirable behaviors such as illegal drug use, certain kinds of sexual behavior or driving while intoxicated are underreported.
We take steps to minimize errors related to questions about socially desirable or undesirable activities. For example, questions about voter registration and voting usually acknowledge that not everyone takes part in elections. Pew Research Center’s voter turnout question is worded this way:
“Which of the following statements best describes you? I did not vote in the [YEAR] presidential election; I planned to vote but wasn’t able to; I definitely voted in the [YEAR] presidential election”
Do people really have opinions on all of those questions?
When we poll on a topic that may be unfamiliar, we typically start by asking how much, if anything, people have heard about it. This way we can get some insight into who knows about the subject and who does not. When we release results from the poll, we typically report just the opinions of people who say they had heard about the topic, and we also report what share of the public had not heard about the topic.
How can I tell a high-quality poll from a lower-quality one?
Two key aspects to consider are transparency and representation. Pollsters who provide clear, detailed explanations about how the poll was conducted (and by whom) tend to be more accurate than those who do not. For example, reputable pollsters will report the source from which the sample was selected, the mode(s) used for interviewing, question wording, etc. High-quality polls also have procedures to ensure that the poll represents the public, even though response rates are low, and some groups are more likely to participate in polls than others. For example, it helps to sample from a database that includes virtually all Americans (e.g., a master list of addresses or phone numbers). Also, it is critical that the poll uses a statistical adjustment (called “weighting”) to make sure that it aligns with an accurate profile of the public. For example, Pew Research Center polls adjust on variables ranging from age, sex and education to voter registration status and political party affiliation. More general guidelines on high-quality polling are available here .
How can a small sample of 1,000 (or even 10,000) accurately represent the views of 250,000,000+ Americans?
Two main statistical techniques are used to ensure that our surveys are representative of the populations they’re drawn from: random sampling and weighting. Random sampling ensures that each person has the same chance of selection to participate in a survey and that the people selected into a sample are a good mix of various demographics, such as age, race, income and education, just like in the general population. However, sample compositions can differ. For example, one sample drawn from a nationally representative list of residential addresses may have a higher percentage of rural dwellers compared with another sample drawn from the exact same list. To ensure that samples drawn ultimately resemble the population they are meant to represent, we use weighting techniques in addition to random sampling. These weighting techniques adjust for differences between respondents’ demographics in the sample and what we know them to be at population level, based on information obtained through institutions such as the U.S. Census Bureau. For more on this topic, check out our Methods 101 video on random sampling.
Do your surveys include people who are offline?
Yes. For the online ATP panel to be truly nationally representative, the share of those who do not use the internet nationally must be represented on the panel. In the past, we did this by providing identified non-internet users with paper questionnaires to complete and mail back. Now, those who don’t have internet access are provided with internet-enabled tablets to take their surveys. These tablet-provided individuals are representative of our non-internet population in the Center’s analyses.
U.S. Surveys
Other research methods.
1615 L St. NW, Suite 800 Washington, DC 20036 USA (+1) 202-419-4300 | Main (+1) 202-857-8562 | Fax (+1) 202-419-4372 | Media Inquiries
Research Topics
- Email Newsletters
ABOUT PEW RESEARCH CENTER Pew Research Center is a nonpartisan fact tank that informs the public about the issues, attitudes and trends shaping the world. It conducts public opinion polling, demographic research, media content analysis and other empirical social science research. Pew Research Center does not take policy positions. It is a subsidiary of The Pew Charitable Trusts .
© 2024 Pew Research Center
Cookies on the Gambling Commission website
The Gambling Commission website uses cookies to make the site work better for you. Some of these cookies are essential to how the site functions and others are optional. Optional cookies help us remember your settings, measure your use of the site and personalise how we communicate with you. Any data collected is anonymised and we do not set optional cookies unless you consent.
You've accepted all cookies. You can change your cookie settings at any time.
Gambling Survey for Great Britain – Wave 2 results published
Our head of statistics, Helen Bryce, talks through the launch of the second wave of data from the Gambling Survey for Great Britain, and the plans for the future.
Posted 10 July 2024 by Helen Bryce

We have recently published the second wave of data from the new Gambling Survey for Great Britain (GSGB) . The findings are based on responses from 5,003 people from across the country who kindly agreed to take part in our survey between November 2023 and February 2024.
This is the second publication of official statistics from the GSGB and like the first, this wave specific publication focuses on the gambling activities that people have participated in and how they have taken part. We’ve also published data on why people gamble, which shows that most people take part for fun or for the chance to win money. As part of our research we asked people who had gambled in the last 12 months to rate how they felt about their last gambling experience. We found 41 percent rated it positively whereas 22 percent expressed negative feelings towards it. Over one third (37 percent) said they neither loved nor hated their last gambling experience.
A number of stakeholders were also interested in the findings from the Short Warwick Edinburgh Mental Wellbeing Scale (SWEMWBS) questions that are asked in the GSGB. SWEMWBS is a short version of the Warwick Edinburgh Mental Wellbeing scale which measures the mental wellbeing of the population. There are seven questions which make up the scale and we have published the metric score that was collected in both Wave 1 and Wave 2 of the GSGB as well as data that was collected in the developmental stages of the GSGB.
On the 25 July, we will be publishing the first annual report of the GSGB. For the first year, this is based on data collected across two waves from July 2023 to February 2024 (10,000 responses), but in future years our annual reports will be based on four waves of data collected across the calendar year (20,000 responses). By combining responses across multiple waves we’ll be able to go into more detail about how responses vary across different population sub groups, and will also publish more data in the annual report about the consequences of gambling.
For more information about the Gambling Survey for Great Britain , please go to our website where you can find information about the development of the GSGB and latest publications. Based on user feedback we have also implemented some changes to our Statistics and Research Hub to more clearly label which of our publications are official statistics and as usual you can find out when official statistics are due for publication in our publication calendar .
We are not able to respond to comments but your feedback will help us improve our website.
Complaints and queries
Do not use this form for complaints as we will not reply. If you want to complain about a gambling business or need further help please contact us .
User research
If you want to provide feedback about new services and features, join our user research programme .
This form is protected by reCAPTCHA and the Google Privacy Policy (opens in new tab) and Terms of Service (opens in new tab) apply.

An official website of the United States government
Here's how you know
Official websites use .gov A .gov website belongs to an official government organization in the United States.
Secure .gov websites use HTTPS A lock ( ) or https:// means you’ve safely connected to the .gov website. Share sensitive information only on official, secure websites.
- Digg
Latest Earthquakes | Chat Share Social Media
Think regionally, act locally: Perspectives on co-design of spatial conservation prioritization tools
In this paper USGS researchers describe a workshop series designed to facilitate the co-design of a new spatial decision support system (SDSS) to guide the protection and restoration of sagebrush ecosystems in the Colorado River Basin.
Throughout the process, USGS scientists identified four generalizable themes which may be informative for future co-design efforts. They discovered end-user confidence in SDSS inputs and transparency regarding SDSS assumptions is critical for building trust between technical experts and end-users. The virtual format, with smaller breakout groups, effectively facilitated discussions and may have increased inclusivity throughout the process.
Finally, they noted the co-design effort requires considerable expert and end-user time but can lead to important understanding and actionable tools. As a result of these co-design efforts, the group ultimately decided to shift ongoing co-design efforts to consider local-scale tools which can be scaled up to larger geographic extents.
Related Content

Prioritizing restoration and conservation of sagebrush ecosystems in northwestern Colorado

Prioritizing sagebrush protection and restoration within the upper Colorado River Basin

Prioritizing Restoration of Sagebrush Ecosystems Tool (PReSET): A USGS-facilitated Decision-support Tool for Sagebrush Ecosystem Conservation and Restoration Actions
Get our news.
These items are in the RSS feed format (Really Simple Syndication) based on categories such as topics, locations, and more. You can install and RSS reader browser extension, software, or use a third-party service to receive immediate news updates depending on the feed that you have added. If you click the feed links below, they may look strange because they are simply XML code. An RSS reader can easily read this code and push out a notification to you when something new is posted to our site.
Biology News
Ecosystems News
Fort Collins Science Center News
Rocky Mountain Region News
Utah Water Science Center News
COMMENTS
Step 3: Craft Engaging Questions for the Questionnaire. Step 4: Select a Tool For the UX Research Survey. Step 5: Pilot the Survey. Step 6: Launch the Survey. Step 7: Analyze and Interpret the Results. Step 8: Share Insights and Implement Changes. The 20 Best User Experience Survey Questions. UX Survey Templates.
In UX research, surveys are typically used as an evaluative research method, but they can also be used in generative research and as a continuous research method. In-product surveys, for example, are an easy and effective way to automate ongoing data collection. . There is a variety of approaches you can take to designing and implementing a ...
UX Research Cheat Sheet. Susan Farrell. February 12, 2017. Summary: User research can be done at any point in the design cycle. This list of methods and activities can help you decide which to use when. User-experience research methods are great at producing data and insights, while ongoing activities help get the right things done.
1. Avoid bias and leading questions. A survey question with an unbalanced scale. Before you launch your survey, check that you're avoiding bias. Here are a few things to look out for as you state your survey objectives and write your questions: Confirmation bias: seeking only the data that confirms your beliefs.
Here are three best practices to ensure your user surveys are a joy to complete. 1. Make sure your questions are crystal-clear. The key to effective user surveys is asking the right questions—and making sure they're crystal-clear for the user. Use plain, jargon-free language and avoid over-complicated or ambiguous wording.
You'll get to influence things millions of people use every day, from email and productivity apps to tools for developers and educators. Even if you don't currently use Google products, you can still sign up for a chance to participate in our research. If one of our studies is a good fit for you, we'll get in touch with details and next ...
CES = % of responses as "Difficult" ― % of responses as "Easy". For a numeric scale survey like this: Use this CES formula: CES = Total sum of individual CES. Total number of customers who responded. Now that you know how to create engaging UX surveys, let's discuss the best practices you can use to ensure a high response rate.
A UX survey is used to collect information about users for a specific product. It is designed specifically for user research and testing. Surveys are an excellent way for user researchers and other developers to determine the needs of the people for whom they are designing as well as collect feedback after the product has been launched.
UX survey is one of the most common UX research methods for getting both qualitative and quantitative insights from your users. User experience surveys are essential because they allow companies to determine areas of improvement, enhance the product and improve user experience. You should conduct UX surveys across all customer journey stages to ...
A user survey is a questionnaire designed specifically for use in user testing and UX research. While surveys have been a core component in applications like market research and academic studies, they're less central to the field of user experience. Your user survey questionnaire will be circulated to user testing subjects, who might be ...
User research, or UX research, is an absolutely vital part of the user experience design process. Typically done at the start of a project, it encompasses different types of research methodologies to gather valuable data and feedback. When conducting user research, you'll engage with and observe your target users, getting to know their needs ...
Step #1: Define research objectives. Go ahead - create that fake persona. Step #2: Pick your methods. Qualitative methods - the WHY. Quantitative methods - the WHAT. Behavioral and attitudinal methods. Step #3: Find your participants. How to recruit participants.
User surveys to engage SaaS customers and prevent churn. 1. Surveys to determine your most effective marketing channels. Although you can see which channels attract more users in your analytics dashboard, you may want to dig a bit deeper and find out what types of customers each channel attracts.
Quick tips for designing. Before we get deep into it, here are some quick and easy tips you can apply to your next survey: Don't use UX jargon (ex: ask about frustrations instead of pain points) Ask one question at a time. Use simple and easy-to-understand language at an eight-year-old reading level.
Here are some research-based user experience survey questions to help get the ball rolling: 1. Please provide your demographic information (age, gender, location, income, education, occupation) 2. Please describe the current issue you're facing, including details about the type of issue (e.g., technical, usability, content-related) and where it ...
Questions for user research can typically be categorized three ways: Questions about the problem e.g., what are users' pain points, what task are they trying to complete, what solution do they want. Questions about the people e.g., who they are, how they use products, what they want to accomplish, how likely are they to use the product.
User research is an umbrella of tools and methods of knowing who our users are, what do they want to achieve, what do they think of your product and more. There are various ways of User Research such as User Interview, Ethnography Research, Personas, A/B testing, UX Surveys and more. For this article, we are going to focus on User Survey.
What is a survey? A survey is a simple tool for gathering information. Surveys typically consist of a set of questions used to assess a participant's preferences, attitudes, characteristics and opinions on a given topic. As a research method, surveys allow us to count or quantify concepts—a sample or subset of the broader audience is used, the learnings from which can be applied to a ...
"Surveys are overused and badly used. People should mostly just stop." - Erika Hall, Co-founder of Mule Design, Awkward Silences ep. 21 We agree—surveys are over- and misused.But in the right hands, they can be a powerful tool for doing user research at scale.. So why do surveys "suck"? 🤔As simple as surveys may seem, there's a lot of room for bias and poor design to sway survey ...
The field of user experience has a wide range of research methods available, ranging from tried-and-true methods such as lab-based usability testing to those that have been more recently developed, such as unmoderated UX assessments. While it's not realistic to use the full set of methods on a given project, nearly all projects would benefit from multiple research methods and from combining ...
A UX research method is a way of generating insights about your users, their behavior, motivations, and needs. These methods help: Learn about user behavior and attitudes. Identify key pain points and challenges in the user interface. Develop user personas to identify user needs and drive solutions.
What is a UX survey? User research is essential when designing a new product or redesigning an existing one. You need to learn what works (and what doesn't) to make UX changes and improve your UX. A UX survey lets you gather quantitative and qualitative data about your users' interactions and experiences within your app or software.
Survey research is the process of collecting data from a predefined group (e.g. customers or potential customers) with the ultimate goal of uncovering insights about your products, services, or brand overall.. As a quantitative data collection method, survey research can provide you with a goldmine of information that can inform crucial business and product decisions.
User Experience Research Survey is a tool that allows you to gather the data necessary to collect key information for this process. With the help of a well-crafted questionnaire and surgically precise questions, we can obtain quantitative data and meaningful insights into change and development. The survey gives us an insight into the view of ...
Discover the top 15 user research tools for 2024 that will enhance your product development process with actionable insights and better user experiences. ... and arrange ideas. It also helps get upright feedback from customers through its own customer portal and user surveys. Chisel gives you the tools to figure out the priority score of ...
Academic Support Portal: Primary portal for all Qualtrics Support, documentation, community boards, etc.; Survey Platform documentation: The Qualtrics knowledge base covers the use of every section, tab, and setting of the survey platform.Start with Projects Overview to create your first survey or jump right into learning the Survey Editor.
This chance, however, is only about 1 in 170,000 for a typical Pew Research Center survey. To obtain that rough estimate, we divide the current adult population of the U.S. (about 255 million) by the typical number of adults we recruit to our survey panel each year (usually around 1,500 people). We draw a random sample of addresses from the U.S ...
Gambling Survey for Great Britain - Wave 2 results published Our head of statistics, Helen Bryce, talks through the launch of the second wave of data from the Gambling Survey for Great Britain, and the plans for the future. ... User research. If you want to provide feedback about new services and features, join our user research programme ...
Based on the user's selection, I'll respond with an appropriate message. There will also be a method to handle cases where the user doesn't choose any of the options. Variable to save user response: Here, I'll define the type, name, and scope of the variable to save the user's response. I'll use this variable in the specified choices and attach ...
Finally, they noted the co-design effort requires considerable expert and end-user time but can lead to important understanding and actionable tools. As a result of these co-design efforts, the group ultimately decided to shift ongoing co-design efforts to consider local-scale tools which can be scaled up to larger geographic extents.