

Writing Center: Experimental Research Papers
- How to Set Up an Appointment Online
- Documentation Styles
- Parts of Speech
- Types of Clauses
- Punctuation
- Spelling & Mechanics
- Usage & Styles
- Resources for ESL Students
- How to Set up an APA Paper
- How to Set up an MLA Paper
- Adapt to Academic Learning
- Audience Awareness
- Learn Touch Typing
- Getting Started
- Thesis Statement
- The First Draft
- Proofreading
- Writing Introductions
- Writing Conclusions
- Chicago / Turabian Style
- CSE / CBE Style
- Avoiding Plagiarism
- Cross-Cultural Understanding
- Writing Resources
- Research Paper - General Guidelines
- Annotated Bibliographies
- History Papers
- Science Papers
- Experimental Research Papers
- Exegetical Papers
- FAQs About Creative Writing
- Tips For Creative Writing
- Exercises To Develop Creative Writing Skills
- Checklist For Creative Writing
- Additional Resources For Creative Writing
- FAQs About Creating PowerPoints
- Tips For Creating PowerPoints
- Exercises to Improve PowerPoint Skills
- Checklist For PowerPoints
- Structure For GRE Essay
- Additional Resources For PowerPoints
- Additional Resources For GRE Essay Writing
- FAQs About Multimodal Assignments
- Tips For Creating Multimodal Assignments
- Checklist For Multimodal Assignments
- Additional Resources For Multimodal Assignments
- GRE Essay Writing FAQ
- Tips for GRE Essay Writing
- Sample GRE Essay Prompts
- Checklist For GRE Essays
- Cover Letter
- Personal Statements
- Resources for Tutors
- Chapter 2: Theoretical Perspectives on Learning a Second Language
- Chapter 4: Reading an ESL Writer's Text
- Chapter 5: Avoiding Appropriation
- Chapter 6: 'Earth Aches by Midnight': Helping ESL Writers Clarify Their Intended Meaning
- Chapter 7: Looking at the Whole Text
- Chapter 8: Meeting in the Middle: Bridging the Construction of Meaning with Generation 1.5 Learners
- Chapter 9: A(n)/The/Ø Article About Articles
- Chapter 10: Editing Line by Line
- Chapter 14: Writing Activities for ESL Writers
- Resources for Faculty
- Writing Center Newsletter
- Writing Center Survey
FAQs About Experimental Research Papers (APA)
What is a research paper?
A researcher uses a research paper to explain how they conducted a research study to answer a question or test a hypothesis. They explain why they conducted the study, the research question or hypothesis they tested, how they conducted the study, the results of their study, and the implications of these results.
What is the purpose of an experimental research paper?
A research paper is intended to inform others about advancement in a particular field of study. The researcher who wrote the paper identified a gap in the research in a field of study and used their research to help fill this gap. The researcher uses their paper to inform others about the knowledge that the results of their study contribute.
What sections are included in an experimental research paper?
A typical research paper contains a Title Page, Abstract, Introduction, Methods, Results, Discussion, and References section. Some also contain a Table and Figures section and Appendix section.
What citation style is used for experimental research papers?
APA (American Psychological Association) style is most commonly used for research papers.
Structure Of Experimental Research Papers (APA)
- Answers the question of “What is this paper about and who wrote it?”
- Located on the first page of the paper
- The author’s note acknowledges any support that the authors received from others
- A student paper also includes the course number and name, instructor’s name, and assignment due date
- Contains a title that summarizes the purpose and content of the research study and engages the audience
- No longer than 250 words
- Summarizes important background information, the research questions and/or hypothesis, methods, key findings, and implications of the findings
- Explains what the topic of the research is and why the topic is worth studying
- Summarizes and discusses prior research conducted on the topic
- Identifies unresolved issues and gaps in past research that the current research will address
- Ends with an overview of the current research study, including how the independent and dependent variables, the research questions or hypotheses, and the objective of the research
- Explains how the research study was conducted
- Typically includes 3 sections: Participants, Materials, and Procedure
- Includes characteristics of the subjects, how the subjects were selected and recruited, how their anonymity was protected, and what feedback was provided to the participants
- Describes any equipment, surveys, tests, questionnaires, informed consent forms, and observational techniques
- Describes the independent and dependent variables, the type of research design, and how the data was collected
- Explains what results were found in the research study
- Describes the data that was collected and the results of statistical tests
- Explains the significance of the results
- Accepts or denies the hypotheses
- Details the implications of these findings
- Addresses the limitations of the study and areas for future research
- Includes all sources that were mentioned in the research study
- Adheres to APA citation styles
- Includes all tables and/or figures that were used in the research study
- Each table and figure is placed on a separate page
- Tables are included before figures
- Begins with a bolded, centered header such as “ Table 1 ”
- Appends all forms, surveys, tests, etc. that were used in the study
- Only includes documents that were referenced in the Methods section
- Each entry is placed on a separate page
- Begins with a bolded, centered header such as “ Appendix A ”
Tips For Experimental Research Papers (APA)
- Initial interest will motivate you to complete your study
- Your entire study will be centered around this question or statement
- Use only verifiable sources that provide accurate information about your topic
- You need to thoroughly understand the field of study your topic is on to help you recognize the gap your research will fill and the significance of your results
- This will help you identify what you should study and what the significance of your study will be
- Create an outline before you begin writing to help organize your thoughts and direct you in your writing
- This will prevent you from losing the source or forgetting to cite the source
- Work on one section at a time, rather than trying to complete multiple sections at once
- This information can be easily referred to as your write your various sections
- When conducting your research, working general to specific will help you narrow your topic and fully understand the field your topic is in
- When writing your literature review, writing from general to specific will help the audience understand your overall topic and the narrow focus of your research
- This will prevent you from losing sources you may need later
- Incorporate correct APA formatting as you write, rather than changing the formatting at the end of the writing process
Checklist For Experimental Research Papers (APA)
- If the paper is a student paper, it contains the title of the project, the author’s name(s), the instructor's name, course number and name, and assignment due date
- If the paper is a professional paper, it includes the title of the paper, the author’s name(s), the institutional affiliation, and the author note
- Begins on the first page of the paper
- The title is typed in upper and lowercase letters, four spaces below the top of the paper, and written in boldface
- Other information is separated by a space from the title
Title (found on title page)
- Informs the audience about the purpose of the paper
- Captures the attention of the audience
- Accurately reflects the purpose and content of the research paper
Abstract
- Labeled as “ Abstract ”
- Begins on the second page
- Provides a short, concise summary of the content of the research paper
- Includes background information necessary to understand the topic
- Background information demonstrates the purpose of the paper
- Contains the hypothesis and/or research questions addressed in the paper
- Has a brief description of the methods used
- Details the key findings and significance of the results
- Illustrates the implications of the research study
- Contains less than 250 words
Introduction
- Starts on the third page
- Includes the title of the paper in bold at the top of the page
- Contains a clear statement of the problem that the paper sets out to address
- Places the research paper within the context of previous research on the topic
- Explains the purpose of the research study and what you hope to find
- Describes the significance of the study
- Details what new insights the research will contribute
- Concludes with a brief description of what information will be mentioned in the literature review
Literature Review
- Labeled as “ Literature Review”
- Presents a general description of the problem area
- Defines any necessary terms
- Discusses and summarizes prior research on the selected topic
- Identifies any unresolved issues or gaps in research that the current research plans to address
- Concludes with a summary of the current research study, including the independent and dependent variables, the research questions or hypotheses, and the objective of the research
- Labeled as “ Methods ”
- Efficiently explains how the research study was conducted
- Appropriately divided into sections
- Describes the characteristics of the participants
- Explains how the participants were selected
- Details how the anonymity of the participants was protected
- Notes what feedback the participants will be provided
- Describes all materials and instruments that were used
- Mentions how the procedure was conducted and data collected
- Notes the independent and dependent variables
- Includes enough information that another researcher could duplicate the research
Results
- Labeled as “ Results ”
- Describes the data was collected
- Explains the results of statistical tests that were performed
- Omits any analysis or discussion of the implications of the study
Discussion
- Labeled as “ Discussion ”
- Describes the significance of the results
- Relates the results to the research questions and/or hypotheses
- States whether the hypotheses should be rejected or accepted
- Addresses limitations of the study, including potential bias, confounds, imprecision of measures, and limits to generalizability
- Explains how the study adds to the knowledge base and expands upon past research
- Labeled as “ References ”
- Correctly cites sources according to APA formatting
- Orders sources alphabetically
- All sources included in the study are cited in the reference section
Table and Figures (optional)
- Each table and each figure is placed on a separate page
- Tables and figures are included after the reference page
- Tables and figures are correctly labeled
- Each table and figure begins with a bolded, centered header such as “ Table 1 ,” “ Table 2 ,”
Appendix (optional)
- Any forms, surveys, tests, etc. are placed in the Appendix
- All appendix entries are mentioned in the Methods section
- Each appendix begins on a new page
- Each appendix begins with a bolded, centered header such as “ Appendix A, ” “ Appendix B ”
Additional Resources For Experimental Research Papers (APA)
- https://www.mcwritingcenterblog.org/single-post/how-to-conduct-research-using-the-library-s-resources
- https://www.mcwritingcenterblog.org/single-post/how-to-read-academic-articles
- https://researchguides.ben.edu/source-evaluation
- https://researchguides.library.brocku.ca/external-analysis/evaluating-sources
- https://writing.wisc.edu/handbook/assignments/planresearchpaper/
- https://nmu.edu/writingcenter/tips-writing-research-paper
- https://writingcenter.gmu.edu/guides/how-to-write-a-research-question
- https://www.unr.edu/writing-speaking-center/student-resources/writing-speaking-resources/guide-to-writing-research-papers
- https://drive.google.com/drive/folders/1F4DFWf85zEH4aZvm10i8Ahm_3xnAekal?usp=sharing
- https://owl.purdue.edu/owl/research_and_citation/apa_style/apa_formatting_and_style_guide/general_format.html
- https://libguides.elmira.edu/research
- https://www.nhcc.edu/academics/library/doing-library-research/basic-steps-research-process
- https://libguides.wustl.edu/research
- << Previous: Science Papers
- Next: Exegetical Papers >>
- Last Updated: Sep 14, 2023 10:30 AM
- URL: https://mc.libguides.com/writingcenter
- Translation
Mastering the Art of Writing Experimental Research Papers
By charlesworth author services.
- 21 November, 2023
Writing an experimental research paper is a challenging yet rewarding task that requires careful planning, attention to detail, and adherence to a structured format. Understanding the intricacies of composing a well-organised experimental research paper can help you communicate your research findings effectively.
Experimental research design is a framework for conducting research, utilising two sets of variables. The first set remains constant, facilitating the measurement of differences in the second set. The importance of a well-crafted experimental research design is underscored, as it forms the foundation for publishing significant results , aids in decision-making, structures research for easier analysis, and addresses the main research question.
Structure of an Experimental Research Paper
The structure of an experimental research paper plays a pivotal role in presenting your study in a logical and organised manner. The sections included in an experimental research paper typically follows the IMRAD formula: Introduction, Methods, Results, and Discussion. Additionally, there is the Title Page, Abstract, References, and, optionally, a Table and Figures section, as well as an Appendix section. Each section serves a specific purpose, contributing to the overall structure and coherence of the research paper.
The key components of this structure include:
1. Title and Abstract:
- The title should succinctly convey the essence of your research.
- The abstract provides a brief overview of your study, including the research question, methods, results, and conclusion.
2. Methods:
- The methods section must clearly define your research question or objective.
- One must conduct a thorough literature review and describe the experimental design in sufficient detail for reproducibility.
3. Results:
- The results must have a logical organisation of the data, using tables, figures, or graphs to present data effectively.
4. Discussion:
- The discussion must include the objective interpretation of your results by comparing them to existing literature.
- Acknowledge any limitations or potential sources of bias in your study.
5. Conclusion:
- Provide a concise conclusion by summarising the key findings and implications for the broader field.
6. References:
- Cite all sources accurately and in the appropriate format.
7. Appendices (Supplementary Materials):
- Include additional materials that support and complement the main text, such as raw data or detailed experimental protocols.
The purpose of an experimental research paper is to inform others about advancements in a particular field of study. It serves as a vehicle for researchers to share their findings, filling gaps in existing research and contributing to the collective knowledge of a specific subject. The researcher identifies a void in the literature and utilises their study to address and provide insights into this gap. The ultimate goal of these papers is to disseminate valuable information, fostering the progression of knowledge in the field.
Practical Tips for Writing an Experimental Research Paper
Writing an experimental research paper include selecting a topic of interest, creating a clear research question or hypothesis, conducting thorough research, identifying gaps in existing literature , and organizing thoughts through an outline. Generally, the "trial and error" approach is recommended for learning basic skills in constructing a research paper.
To ensure the success of your experimental research paper, consider the following practical tips:
1. Define clearly your research question or objective
2. Conduct a thorough review of relevant literature
3. Provide a detailed description of the experimental design and methodology
4. Organise your results logically, using tables, figures, or graphs
5. Interpret and discuss your results objectively, comparing them to existing literature
6. Acknowledge any limitations or potential sources of bias in your study
7. Proofread and edit your paper for grammar, spelling, and clarity.
Mastering the art of writing experimental research papers requires a combination of careful planning, attention to detail, and adherence to a structured format. By understanding the essential components of the paper, implementing effective writing strategies, and following appropriate formatting guidelines, researchers can ensure that their work is presented in a compelling and accessible manner. A well-crafted experimental research paper not only contributes to the scientific discourse but also showcases the researcher's commitment to excellence in communication and research methodology.
Share with your colleagues
Scientific Editing Services
Sign up – stay updated.
We use cookies to offer you a personalized experience. By continuing to use this website, you consent to the use of cookies in accordance with our Cookie Policy.
- Search This Site All UCSD Sites Faculty/Staff Search Term
- Contact & Directions
- Climate Statement
- Cognitive Behavioral Neuroscience
- Cognitive Psychology
- Developmental Psychology
- Social Psychology
- Adjunct Faculty
- Non-Senate Instructors
- Researchers
- Psychology Grads
- Affiliated Grads
- New and Prospective Students
- Honors Program
- Experiential Learning
- Programs & Events
- Psi Chi / Psychology Club
- Prospective PhD Students
- Current PhD Students
- Area Brown Bags
- Colloquium Series
- Anderson Distinguished Lecture Series
- Speaker Videos
- Undergraduate Program
- Academic and Writing Resources
Writing Research Papers
- Research Paper Structure
Whether you are writing a B.S. Degree Research Paper or completing a research report for a Psychology course, it is highly likely that you will need to organize your research paper in accordance with American Psychological Association (APA) guidelines. Here we discuss the structure of research papers according to APA style.
Major Sections of a Research Paper in APA Style
A complete research paper in APA style that is reporting on experimental research will typically contain a Title page, Abstract, Introduction, Methods, Results, Discussion, and References sections. 1 Many will also contain Figures and Tables and some will have an Appendix or Appendices. These sections are detailed as follows (for a more in-depth guide, please refer to " How to Write a Research Paper in APA Style ”, a comprehensive guide developed by Prof. Emma Geller). 2
What is this paper called and who wrote it? – the first page of the paper; this includes the name of the paper, a “running head”, authors, and institutional affiliation of the authors. The institutional affiliation is usually listed in an Author Note that is placed towards the bottom of the title page. In some cases, the Author Note also contains an acknowledgment of any funding support and of any individuals that assisted with the research project.
One-paragraph summary of the entire study – typically no more than 250 words in length (and in many cases it is well shorter than that), the Abstract provides an overview of the study.
Introduction
What is the topic and why is it worth studying? – the first major section of text in the paper, the Introduction commonly describes the topic under investigation, summarizes or discusses relevant prior research (for related details, please see the Writing Literature Reviews section of this website), identifies unresolved issues that the current research will address, and provides an overview of the research that is to be described in greater detail in the sections to follow.
What did you do? – a section which details how the research was performed. It typically features a description of the participants/subjects that were involved, the study design, the materials that were used, and the study procedure. If there were multiple experiments, then each experiment may require a separate Methods section. A rule of thumb is that the Methods section should be sufficiently detailed for another researcher to duplicate your research.
What did you find? – a section which describes the data that was collected and the results of any statistical tests that were performed. It may also be prefaced by a description of the analysis procedure that was used. If there were multiple experiments, then each experiment may require a separate Results section.
What is the significance of your results? – the final major section of text in the paper. The Discussion commonly features a summary of the results that were obtained in the study, describes how those results address the topic under investigation and/or the issues that the research was designed to address, and may expand upon the implications of those findings. Limitations and directions for future research are also commonly addressed.
List of articles and any books cited – an alphabetized list of the sources that are cited in the paper (by last name of the first author of each source). Each reference should follow specific APA guidelines regarding author names, dates, article titles, journal titles, journal volume numbers, page numbers, book publishers, publisher locations, websites, and so on (for more information, please see the Citing References in APA Style page of this website).
Tables and Figures
Graphs and data (optional in some cases) – depending on the type of research being performed, there may be Tables and/or Figures (however, in some cases, there may be neither). In APA style, each Table and each Figure is placed on a separate page and all Tables and Figures are included after the References. Tables are included first, followed by Figures. However, for some journals and undergraduate research papers (such as the B.S. Research Paper or Honors Thesis), Tables and Figures may be embedded in the text (depending on the instructor’s or editor’s policies; for more details, see "Deviations from APA Style" below).
Supplementary information (optional) – in some cases, additional information that is not critical to understanding the research paper, such as a list of experiment stimuli, details of a secondary analysis, or programming code, is provided. This is often placed in an Appendix.
Variations of Research Papers in APA Style
Although the major sections described above are common to most research papers written in APA style, there are variations on that pattern. These variations include:
- Literature reviews – when a paper is reviewing prior published research and not presenting new empirical research itself (such as in a review article, and particularly a qualitative review), then the authors may forgo any Methods and Results sections. Instead, there is a different structure such as an Introduction section followed by sections for each of the different aspects of the body of research being reviewed, and then perhaps a Discussion section.
- Multi-experiment papers – when there are multiple experiments, it is common to follow the Introduction with an Experiment 1 section, itself containing Methods, Results, and Discussion subsections. Then there is an Experiment 2 section with a similar structure, an Experiment 3 section with a similar structure, and so on until all experiments are covered. Towards the end of the paper there is a General Discussion section followed by References. Additionally, in multi-experiment papers, it is common for the Results and Discussion subsections for individual experiments to be combined into single “Results and Discussion” sections.
Departures from APA Style
In some cases, official APA style might not be followed (however, be sure to check with your editor, instructor, or other sources before deviating from standards of the Publication Manual of the American Psychological Association). Such deviations may include:
- Placement of Tables and Figures – in some cases, to make reading through the paper easier, Tables and/or Figures are embedded in the text (for example, having a bar graph placed in the relevant Results section). The embedding of Tables and/or Figures in the text is one of the most common deviations from APA style (and is commonly allowed in B.S. Degree Research Papers and Honors Theses; however you should check with your instructor, supervisor, or editor first).
- Incomplete research – sometimes a B.S. Degree Research Paper in this department is written about research that is currently being planned or is in progress. In those circumstances, sometimes only an Introduction and Methods section, followed by References, is included (that is, in cases where the research itself has not formally begun). In other cases, preliminary results are presented and noted as such in the Results section (such as in cases where the study is underway but not complete), and the Discussion section includes caveats about the in-progress nature of the research. Again, you should check with your instructor, supervisor, or editor first.
- Class assignments – in some classes in this department, an assignment must be written in APA style but is not exactly a traditional research paper (for instance, a student asked to write about an article that they read, and to write that report in APA style). In that case, the structure of the paper might approximate the typical sections of a research paper in APA style, but not entirely. You should check with your instructor for further guidelines.
Workshops and Downloadable Resources
- For in-person discussion of the process of writing research papers, please consider attending this department’s “Writing Research Papers” workshop (for dates and times, please check the undergraduate workshops calendar).
Downloadable Resources
- How to Write APA Style Research Papers (a comprehensive guide) [ PDF ]
- Tips for Writing APA Style Research Papers (a brief summary) [ PDF ]
- Example APA Style Research Paper (for B.S. Degree – empirical research) [ PDF ]
- Example APA Style Research Paper (for B.S. Degree – literature review) [ PDF ]
Further Resources
How-To Videos
- Writing Research Paper Videos
APA Journal Article Reporting Guidelines
- Appelbaum, M., Cooper, H., Kline, R. B., Mayo-Wilson, E., Nezu, A. M., & Rao, S. M. (2018). Journal article reporting standards for quantitative research in psychology: The APA Publications and Communications Board task force report . American Psychologist , 73 (1), 3.
- Levitt, H. M., Bamberg, M., Creswell, J. W., Frost, D. M., Josselson, R., & Suárez-Orozco, C. (2018). Journal article reporting standards for qualitative primary, qualitative meta-analytic, and mixed methods research in psychology: The APA Publications and Communications Board task force report . American Psychologist , 73 (1), 26.
External Resources
- Formatting APA Style Papers in Microsoft Word
- How to Write an APA Style Research Paper from Hamilton University
- WikiHow Guide to Writing APA Research Papers
- Sample APA Formatted Paper with Comments
- Sample APA Formatted Paper
- Tips for Writing a Paper in APA Style
1 VandenBos, G. R. (Ed). (2010). Publication manual of the American Psychological Association (6th ed.) (pp. 41-60). Washington, DC: American Psychological Association.
2 geller, e. (2018). how to write an apa-style research report . [instructional materials]. , prepared by s. c. pan for ucsd psychology.
Back to top
- Formatting Research Papers
- Using Databases and Finding References
- What Types of References Are Appropriate?
- Evaluating References and Taking Notes
- Citing References
- Writing a Literature Review
- Writing Process and Revising
- Improving Scientific Writing
- Academic Integrity and Avoiding Plagiarism
- Writing Research Papers Videos

Tips for Writing Better Science Papers: Experimental (7)
Author: Richard Threlfall
Have you ever struggled to write up your results into a publishable paper only to get it rejected? Richard Threlfall, Managing Editor, Asian Journal of Organic Chemistry , gives some insider tips on how to improve each section of your article and increase your chances of getting published.
Experimental
Possibly the easiest section of the whole manuscript to write—write down what you did, how much you used, and how long you left it to stir, then hey presto! You have your experimental section. Easy though it may be to write, there are still things you can do to make your experimental section an easy read. Don’t forget, this is the evidence for all of your ideas presented in the paper and there are people who will use or try to reproduce your methods. Therefore, clarity and good presentation really helps.
Two good tips are to avoid repetition and to be consistent in the way you present your data. Repeatedly stating reaction conditions, amounts used, or analytical techniques doesn’t add very much to the paper and makes the important things harder to find. A summary of general procedures, analytical techniques, and other relevant details in a “general” section at the beginning of the experimental is a great tool for avoiding unnecessary repetition.
Consistency in data presentation makes the experimental section easier to use when it comes to peer review. Check the author guidelines (AJOC’s can be found here: http://onlinelibrary.wiley.com/journal/10.1002/(ISSN)2193-5815/homepage/2157_notice.html ) and previous issues of the journal you are submitting to for how to format your data. Remember that most journals only require the analytical data for compounds that are new to be disclosed in the experimental section, but check the author guidelines first.
Reviewers will often highlight or question inconsistencies in experimental data as things that should be examined further, when in reality it is just a typo or something left over from a previous version of your manuscript. Therefore, presenting your data clearly and checking it thoroughly before submission is well worth it to avoid unnecessary rounds of revision and review.
- Next month: References – Like the experimental, the reference section is very easy to compile, but there are some small things you can do to make it user friendly.
- See all Tips for Writing Better Science Papers
Leave a Reply Cancel reply
Kindly review our community guidelines before leaving a comment.
Your email address will not be published. Required fields are marked *
Related Content

Summer Reading 2024
June 12, 2024

Tools for Chemists and other Scientists
May 7, 2024

ChemistryViews Discoveries (05/2024)

NFDI4Chem Stammtisch
April 26, 2024 to June 28, 2024
Educational resources and simple solutions for your research journey

How to Write the Methods Section of a Research Paper
Writing a research paper is both an art and a skill, and knowing how to write the methods section of a research paper is the first crucial step in mastering scientific writing. If, like the majority of early career researchers, you believe that the methods section is the simplest to write and needs little in the way of careful consideration or thought, this article will help you understand it is not 1 .
We have all probably asked our supervisors, coworkers, or search engines “ how to write a methods section of a research paper ” at some point in our scientific careers, so you are not alone if that’s how you ended up here. Even for seasoned researchers, selecting what to include in the methods section from a wealth of experimental information can occasionally be a source of distress and perplexity.
Additionally, journal specifications, in some cases, may make it more of a requirement rather than a choice to provide a selective yet descriptive account of the experimental procedure. Hence, knowing these nuances of how to write the methods section of a research paper is critical to its success. The methods section of the research paper is not supposed to be a detailed heavy, dull section that some researchers tend to write; rather, it should be the central component of the study that justifies the validity and reliability of the research.
Are you still unsure of how the methods section of a research paper forms the basis of every investigation? Consider the last article you read but ignore the methods section and concentrate on the other parts of the paper . Now think whether you could repeat the study and be sure of the credibility of the findings despite knowing the literature review and even having the data in front of you. You have the answer!

Having established the importance of the methods section , the next question is how to write the methods section of a research paper that unifies the overall study. The purpose of the methods section , which was earlier called as Materials and Methods , is to describe how the authors went about answering the “research question” at hand. Here, the objective is to tell a coherent story that gives a detailed account of how the study was conducted, the rationale behind specific experimental procedures, the experimental setup, objects (variables) involved, the research protocol employed, tools utilized to measure, calculations and measurements, and the analysis of the collected data 2 .
In this article, we will take a deep dive into this topic and provide a detailed overview of how to write the methods section of a research paper . For the sake of clarity, we have separated the subject into various sections with corresponding subheadings.
Table of Contents
What is the methods section of a research paper ?
The methods section is a fundamental section of any paper since it typically discusses the ‘ what ’, ‘ how ’, ‘ which ’, and ‘ why ’ of the study, which is necessary to arrive at the final conclusions. In a research article, the introduction, which serves to set the foundation for comprehending the background and results is usually followed by the methods section, which precedes the result and discussion sections. The methods section must explicitly state what was done, how it was done, which equipment, tools and techniques were utilized, how were the measurements/calculations taken, and why specific research protocols, software, and analytical methods were employed.
Why is the methods section important?
The primary goal of the methods section is to provide pertinent details about the experimental approach so that the reader may put the results in perspective and, if necessary, replicate the findings 3 . This section offers readers the chance to evaluate the reliability and validity of any study. In short, it also serves as the study’s blueprint, assisting researchers who might be unsure about any other portion in establishing the study’s context and validity. The methods plays a rather crucial role in determining the fate of the article; an incomplete and unreliable methods section can frequently result in early rejections and may lead to numerous rounds of modifications during the publication process. This means that the reviewers also often use methods section to assess the reliability and validity of the research protocol and the data analysis employed to address the research topic. In other words, the purpose of the methods section is to demonstrate the research acumen and subject-matter expertise of the author(s) in their field.
Structure of methods section of a research paper
Similar to the research paper, the methods section also follows a defined structure; this may be dictated by the guidelines of a specific journal or can be presented in a chronological or thematic manner based on the study type. When writing the methods section , authors should keep in mind that they are telling a story about how the research was conducted. They should only report relevant information to avoid confusing the reader and include details that would aid in connecting various aspects of the entire research activity together. It is generally advisable to present experiments in the order in which they were conducted. This facilitates the logical flow of the research and allows readers to follow the progression of the study design.

It is also essential to clearly state the rationale behind each experiment and how the findings of earlier experiments informed the design or interpretation of later experiments. This allows the readers to understand the overall purpose of the study design and the significance of each experiment within that context. However, depending on the particular research question and method, it may make sense to present information in a different order; therefore, authors must select the best structure and strategy for their individual studies.
In cases where there is a lot of information, divide the sections into subheadings to cover the pertinent details. If the journal guidelines pose restrictions on the word limit , additional important information can be supplied in the supplementary files. A simple rule of thumb for sectioning the method section is to begin by explaining the methodological approach ( what was done ), describing the data collection methods ( how it was done ), providing the analysis method ( how the data was analyzed ), and explaining the rationale for choosing the methodological strategy. This is described in detail in the upcoming sections.
How to write the methods section of a research paper
Contrary to widespread assumption, the methods section of a research paper should be prepared once the study is complete to prevent missing any key parameter. Hence, please make sure that all relevant experiments are done before you start writing a methods section . The next step for authors is to look up any applicable academic style manuals or journal-specific standards to ensure that the methods section is formatted correctly. The methods section of a research paper typically constitutes materials and methods; while writing this section, authors usually arrange the information under each category.
The materials category describes the samples, materials, treatments, and instruments, while experimental design, sample preparation, data collection, and data analysis are a part of the method category. According to the nature of the study, authors should include additional subsections within the methods section, such as ethical considerations like the declaration of Helsinki (for studies involving human subjects), demographic information of the participants, and any other crucial information that can affect the output of the study. Simply put, the methods section has two major components: content and format. Here is an easy checklist for you to consider if you are struggling with how to write the methods section of a research paper .
- Explain the research design, subjects, and sample details
- Include information on inclusion and exclusion criteria
- Mention ethical or any other permission required for the study
- Include information about materials, experimental setup, tools, and software
- Add details of data collection and analysis methods
- Incorporate how research biases were avoided or confounding variables were controlled
- Evaluate and justify the experimental procedure selected to address the research question
- Provide precise and clear details of each experiment
- Flowcharts, infographics, or tables can be used to present complex information
- Use past tense to show that the experiments have been done
- Follow academic style guides (such as APA or MLA ) to structure the content
- Citations should be included as per standard protocols in the field
Now that you know how to write the methods section of a research paper , let’s address another challenge researchers face while writing the methods section —what to include in the methods section . How much information is too much is not always obvious when it comes to trying to include data in the methods section of a paper. In the next section, we examine this issue and explore potential solutions.

What to include in the methods section of a research paper
The technical nature of the methods section occasionally makes it harder to present the information clearly and concisely while staying within the study context. Many young researchers tend to veer off subject significantly, and they frequently commit the sin of becoming bogged down in itty bitty details, making the text harder to read and impairing its overall flow. However, the best way to write the methods section is to start with crucial components of the experiments. If you have trouble deciding which elements are essential, think about leaving out those that would make it more challenging to comprehend the context or replicate the results. The top-down approach helps to ensure all relevant information is incorporated and vital information is not lost in technicalities. Next, remember to add details that are significant to assess the validity and reliability of the study. Here is a simple checklist for you to follow ( bonus tip: you can also make a checklist for your own study to avoid missing any critical information while writing the methods section ).
- Structuring the methods section : Authors should diligently follow journal guidelines and adhere to the specific author instructions provided when writing the methods section . Journals typically have specific guidelines for formatting the methods section ; for example, Frontiers in Plant Sciences advises arranging the materials and methods section by subheading and citing relevant literature. There are several standardized checklists available for different study types in the biomedical field, including CONSORT (Consolidated Standards of Reporting Trials) for randomized clinical trials, PRISMA (Preferred Reporting Items for Systematic reviews and Meta-Analysis) for systematic reviews and meta-analysis, and STROBE (STrengthening the Reporting of OBservational studies in Epidemiology) for cohort, case-control, cross-sectional studies. Before starting the methods section , check the checklist available in your field that can function as a guide.
- Organizing different sections to tell a story : Once you are sure of the format required for structuring the methods section , the next is to present the sections in a logical manner; as mentioned earlier, the sections can be organized according to the chronology or themes. In the chronological arrangement, you should discuss the methods in accordance with how the experiments were carried out. An example of the method section of a research paper of an animal study should first ideally include information about the species, weight, sex, strain, and age. Next, the number of animals, their initial conditions, and their living and housing conditions should also be mentioned. Second, how the groups are assigned and the intervention (drug treatment, stress, or other) given to each group, and finally, the details of tools and techniques used to measure, collect, and analyze the data. Experiments involving animal or human subjects should additionally state an ethics approval statement. It is best to arrange the section using the thematic approach when discussing distinct experiments not following a sequential order.
- Define and explain the objects and procedure: Experimental procedure should clearly be stated in the methods section . Samples, necessary preparations (samples, treatment, and drug), and methods for manipulation need to be included. All variables (control, dependent, independent, and confounding) must be clearly defined, particularly if the confounding variables can affect the outcome of the study.
- Match the order of the methods section with the order of results: Though not mandatory, organizing the manuscript in a logical and coherent manner can improve the readability and clarity of the paper. This can be done by following a consistent structure throughout the manuscript; readers can easily navigate through the different sections and understand the methods and results in relation to each other. Using experiment names as headings for both the methods and results sections can also make it simpler for readers to locate specific information and corroborate it if needed.
- Relevant information must always be included: The methods section should have information on all experiments conducted and their details clearly mentioned. Ask the journal whether there is a way to offer more information in the supplemental files or external repositories if your target journal has strict word limitations. For example, Nature communications encourages authors to deposit their step-by-step protocols in an open-resource depository, Protocol Exchange which allows the protocols to be linked with the manuscript upon publication. Providing access to detailed protocols also helps to increase the transparency and reproducibility of the research.
- It’s all in the details: The methods section should meticulously list all the materials, tools, instruments, and software used for different experiments. Specify the testing equipment on which data was obtained, together with its manufacturer’s information, location, city, and state or any other stimuli used to manipulate the variables. Provide specifics on the research process you employed; if it was a standard protocol, cite previous studies that also used the protocol. Include any protocol modifications that were made, as well as any other factors that were taken into account when planning the study or gathering data. Any new or modified techniques should be explained by the authors. Typically, readers evaluate the reliability and validity of the procedures using the cited literature, and a widely accepted checklist helps to support the credibility of the methodology. Note: Authors should include a statement on sample size estimation (if applicable), which is often missed. It enables the reader to determine how many subjects will be required to detect the expected change in the outcome variables within a given confidence interval.
- Write for the audience: While explaining the details in the methods section , authors should be mindful of their target audience, as some of the rationale or assumptions on which specific procedures are based might not always be obvious to the audience, particularly for a general audience. Therefore, when in doubt, the objective of a procedure should be specified either in relation to the research question or to the entire protocol.
- Data interpretation and analysis : Information on data processing, statistical testing, levels of significance, and analysis tools and software should be added. Mention if the recommendations and expertise of an experienced statistician were followed. Also, evaluate and justify the preferred statistical method used in the study and its significance.
What NOT to include in the methods section of a research paper
To address “ how to write the methods section of a research paper ”, authors should not only pay careful attention to what to include but also what not to include in the methods section of a research paper . Here is a list of do not’s when writing the methods section :
- Do not elaborate on specifics of standard methods/procedures: You should refrain from adding unnecessary details of experiments and practices that are well established and cited previously. Instead, simply cite relevant literature or mention if the manufacturer’s protocol was followed.
- Do not add unnecessary details : Do not include minute details of the experimental procedure and materials/instruments used that are not significant for the outcome of the experiment. For example, there is no need to mention the brand name of the water bath used for incubation.
- Do not discuss the results: The methods section is not to discuss the results or refer to the tables and figures; save it for the results and discussion section. Also, focus on the methods selected to conduct the study and avoid diverting to other methods or commenting on their pros or cons.
- Do not make the section bulky : For extensive methods and protocols, provide the essential details and share the rest of the information in the supplemental files. The writing should be clear yet concise to maintain the flow of the section.
We hope that by this point, you understand how crucial it is to write a thoughtful and precise methods section and the ins and outs of how to write the methods section of a research paper . To restate, the entire purpose of the methods section is to enable others to reproduce the results or verify the research. We sincerely hope that this post has cleared up any confusion and given you a fresh perspective on the methods section .
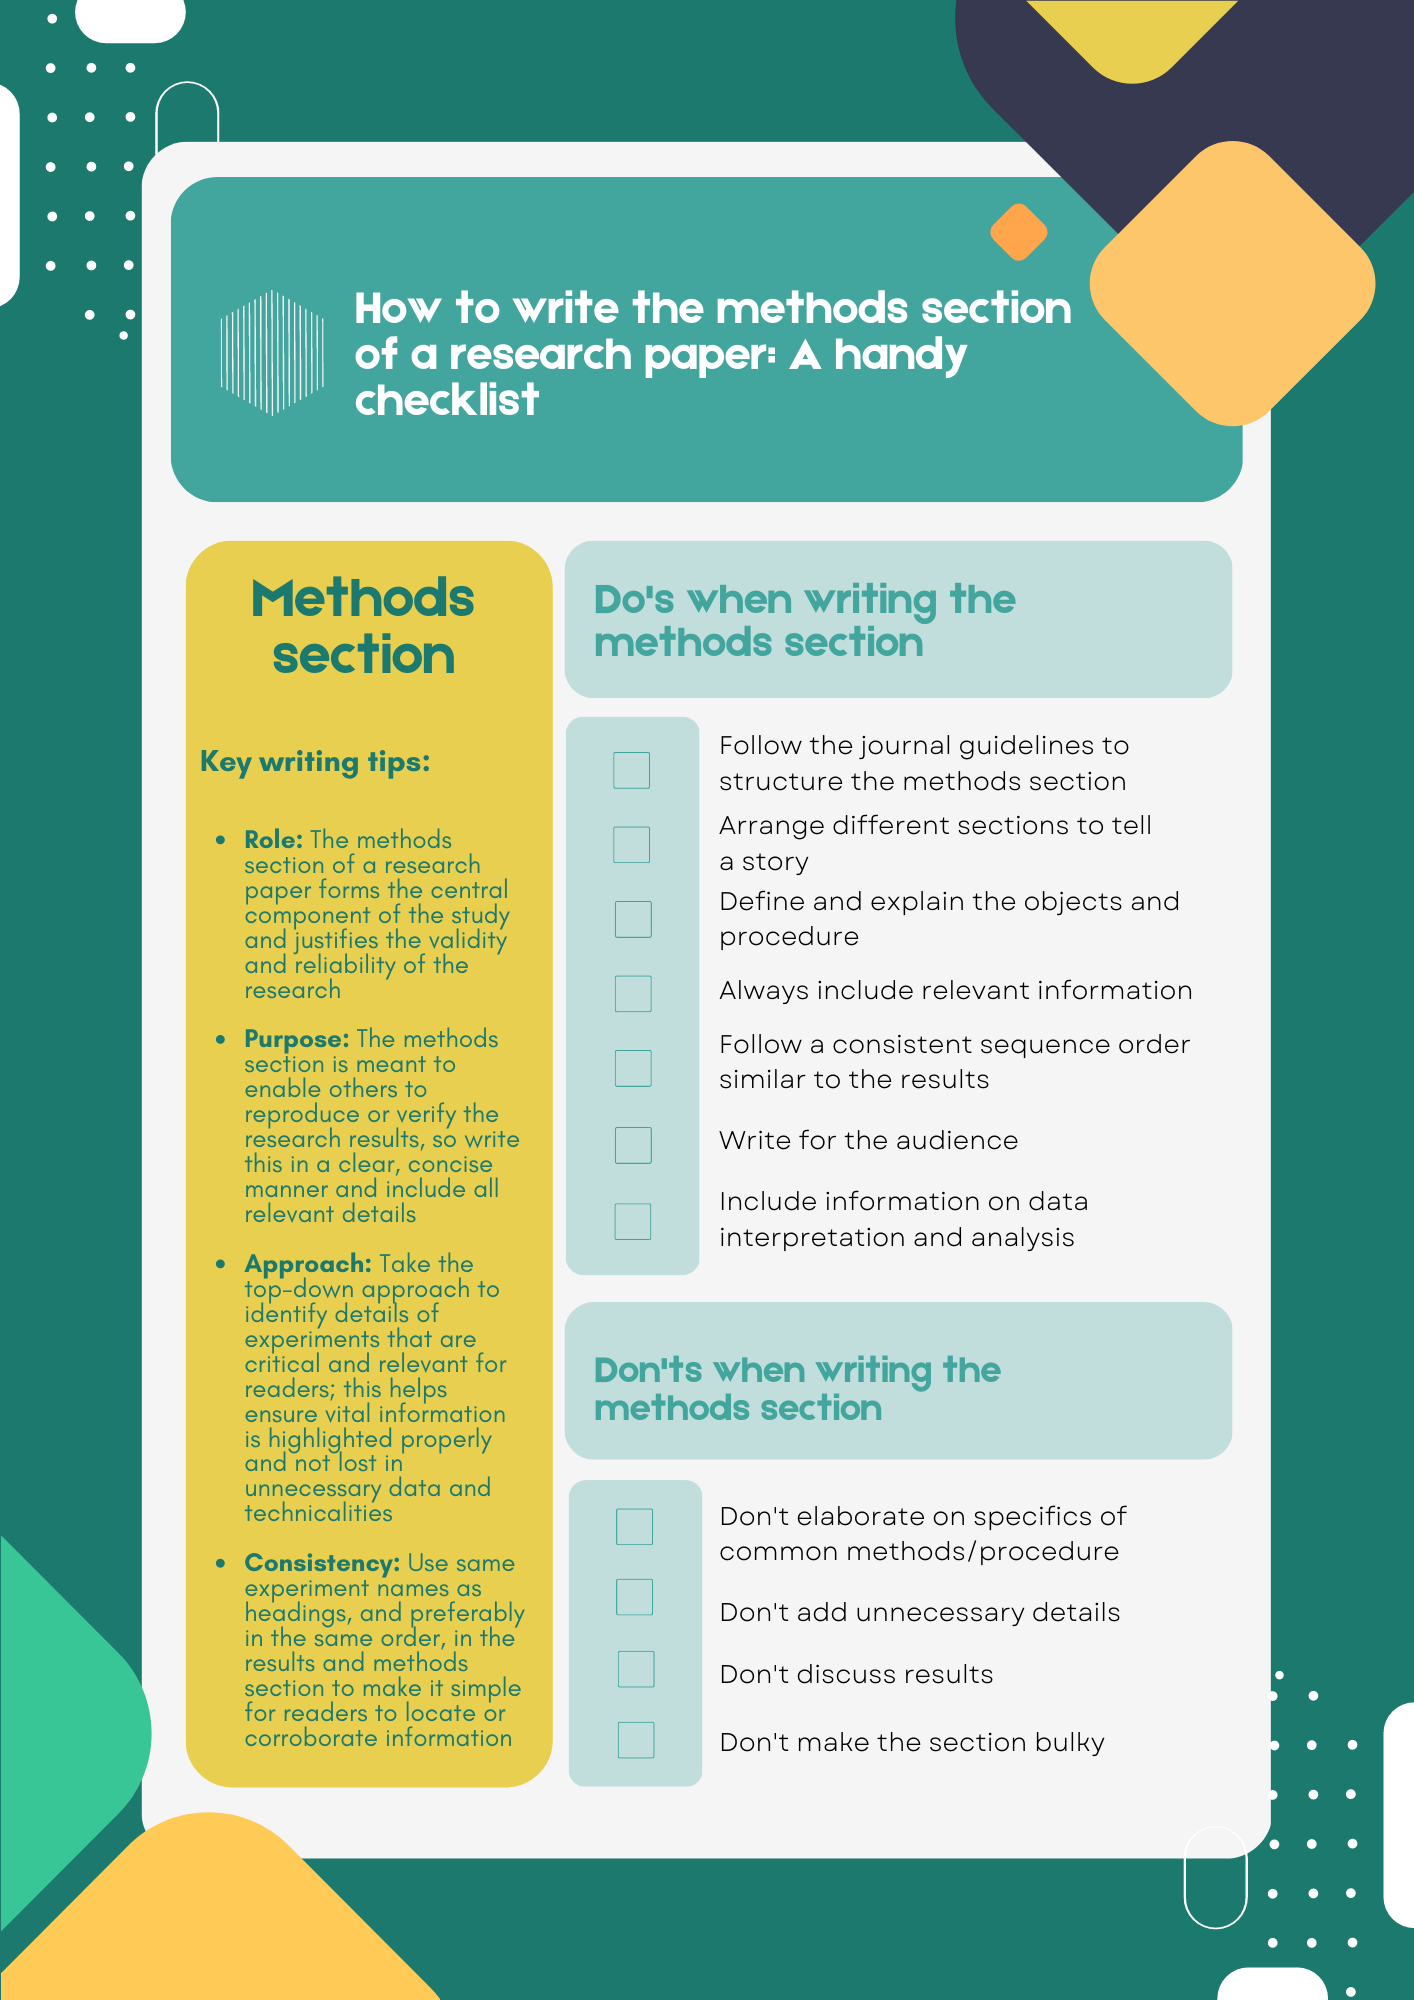
As a parting gift, we’re leaving you with a handy checklist that will help you understand how to write the methods section of a research paper . Feel free to download this checklist and use or share this with those who you think may benefit from it.
References
- Bhattacharya, D. How to write the Methods section of a research paper. Editage Insights, 2018. https://www.editage.com/insights/how-to-write-the-methods-section-of-a-research-paper (2018).
- Kallet, R. H. How to Write the Methods Section of a Research Paper. Respiratory Care 49, 1229–1232 (2004). https://pubmed.ncbi.nlm.nih.gov/15447808/
- Grindstaff, T. L. & Saliba, S. A. AVOIDING MANUSCRIPT MISTAKES. Int J Sports Phys Ther 7, 518–524 (2012). https://www.ncbi.nlm.nih.gov/pmc/articles/PMC3474299/
Editage All Access is a subscription-based platform that unifies the best AI tools and services designed to speed up, simplify, and streamline every step of a researcher’s journey. The Editage All Access Pack is a one-of-a-kind subscription that unlocks full access to an AI writing assistant, literature recommender, journal finder, scientific illustration tool, and exclusive discounts on professional publication services from Editage.
Based on 22+ years of experience in academia, Editage All Access empowers researchers to put their best research forward and move closer to success. Explore our top AI Tools pack, AI Tools + Publication Services pack, or Build Your Own Plan. Find everything a researcher needs to succeed, all in one place – Get All Access now starting at just $14 a month !
Related Posts

How to Make a Graphical Abstract for Your Research Paper (with Examples)

Leveraging AI in Research: Kick-Start Your Academic Year with Editage All Access

An official website of the United States government
The .gov means it’s official. Federal government websites often end in .gov or .mil. Before sharing sensitive information, make sure you’re on a federal government site.
The site is secure. The https:// ensures that you are connecting to the official website and that any information you provide is encrypted and transmitted securely.
- Publications
- Account settings
- My Bibliography
- Collections
- Citation manager
Save citation to file
Email citation, add to collections.
- Create a new collection
- Add to an existing collection
Add to My Bibliography
Your saved search, create a file for external citation management software, your rss feed.
- Search in PubMed
- Search in NLM Catalog
- Add to Search
How to write the methods section of a research paper
Affiliation.
- 1 Respiratory Care Services, San Francisco General Hospital, NH:GA-2, 1001 Potrero Avenue, San Francisco, CA 94110, USA. [email protected]
- PMID: 15447808
The methods section of a research paper provides the information by which a study's validity is judged. Therefore, it requires a clear and precise description of how an experiment was done, and the rationale for why specific experimental procedures were chosen. The methods section should describe what was done to answer the research question, describe how it was done, justify the experimental design, and explain how the results were analyzed. Scientific writing is direct and orderly. Therefore, the methods section structure should: describe the materials used in the study, explain how the materials were prepared for the study, describe the research protocol, explain how measurements were made and what calculations were performed, and state which statistical tests were done to analyze the data. Once all elements of the methods section are written, subsequent drafts should focus on how to present those elements as clearly and logically as possibly. The description of preparations, measurements, and the protocol should be organized chronologically. For clarity, when a large amount of detail must be presented, information should be presented in sub-sections according to topic. Material in each section should be organized by topic from most to least important.
PubMed Disclaimer
Similar articles
- Creating Logical Flow When Writing Scientific Articles. Barroga E, Matanguihan GJ. Barroga E, et al. J Korean Med Sci. 2021 Oct 18;36(40):e275. doi: 10.3346/jkms.2021.36.e275. J Korean Med Sci. 2021. PMID: 34664802 Free PMC article. Review.
- Writing the materials and methods. Ng KH, Peh WC. Ng KH, et al. Singapore Med J. 2008 Nov;49(11):856-8; quiz 859. Singapore Med J. 2008. PMID: 19037549
- [Procedures and methods of benefit assessments for medicines in Germany]. Bekkering GE, Kleijnen J. Bekkering GE, et al. Dtsch Med Wochenschr. 2008 Dec;133 Suppl 7:S225-46. doi: 10.1055/s-0028-1100954. Epub 2008 Nov 25. Dtsch Med Wochenschr. 2008. PMID: 19034813 German.
- Procedures and methods of benefit assessments for medicines in Germany. Bekkering GE, Kleijnen J. Bekkering GE, et al. Eur J Health Econ. 2008 Nov;9 Suppl 1:5-29. doi: 10.1007/s10198-008-0122-5. Eur J Health Econ. 2008. PMID: 18987905
- Teaching how to prepare a manuscript by means of rewriting published scientific papers. Tomaska L. Tomaska L. Genetics. 2007 Jan;175(1):17-20. doi: 10.1534/genetics.106.066217. Epub 2006 Nov 16. Genetics. 2007. PMID: 17110479 Free PMC article. Review.
- Writing a manuscript for publication in a peer-reviewed scientific journal: Guidance from the European Society of Clinical Pharmacy. Wirth F, Cadogan CA, Fialová D, Hazen A, Lutters M, Paudyal V, Weidmann AE, Okuyan B, Henman MC. Wirth F, et al. Int J Clin Pharm. 2024 Apr;46(2):548-554. doi: 10.1007/s11096-023-01695-6. Epub 2024 Feb 8. Int J Clin Pharm. 2024. PMID: 38332208 Free PMC article.
- How to Write the Methods Section of a Research Manuscript. Willis LD. Willis LD. Respir Care. 2023 Nov 25;68(12):1763-1770. doi: 10.4187/respcare.11437. Respir Care. 2023. PMID: 37643870
- Moving From Abstract to Manuscript. Miller AG. Miller AG. Respir Care. 2023 Aug 8;69(1):139-44. doi: 10.4187/respcare.11370. Online ahead of print. Respir Care. 2023. PMID: 37553216
- Pitfalls in Article Submissions for Publication. Nair B. Nair B. Indian Dermatol Online J. 2020 Nov 8;11(6):937-943. doi: 10.4103/idoj.IDOJ_658_20. eCollection 2020 Nov-Dec. Indian Dermatol Online J. 2020. PMID: 33344343 Free PMC article.
- Strategies for writing a successful National Institutes of Health grant proposal for the early-career neurointerventionalist. Kan P, Mokin M, Mack WJ, Starke RM, Sheth KN, Albuquerque FC, Levitt MR. Kan P, et al. J Neurointerv Surg. 2020 Nov 25:neurintsurg-2020-016964. doi: 10.1136/neurintsurg-2020-016964. Online ahead of print. J Neurointerv Surg. 2020. PMID: 33239307 Free PMC article. Review.
- Search in MeSH
LinkOut - more resources
Full text sources.
- Citation Manager
NCBI Literature Resources
MeSH PMC Bookshelf Disclaimer
The PubMed wordmark and PubMed logo are registered trademarks of the U.S. Department of Health and Human Services (HHS). Unauthorized use of these marks is strictly prohibited.
When you choose to publish with PLOS, your research makes an impact. Make your work accessible to all, without restrictions, and accelerate scientific discovery with options like preprints and published peer review that make your work more Open.
- PLOS Biology
- PLOS Climate
- PLOS Complex Systems
- PLOS Computational Biology
- PLOS Digital Health
- PLOS Genetics
- PLOS Global Public Health
- PLOS Medicine
- PLOS Mental Health
- PLOS Neglected Tropical Diseases
- PLOS Pathogens
- PLOS Sustainability and Transformation
- PLOS Collections
- How to Write Discussions and Conclusions

The discussion section contains the results and outcomes of a study. An effective discussion informs readers what can be learned from your experiment and provides context for the results.
What makes an effective discussion?
When you’re ready to write your discussion, you’ve already introduced the purpose of your study and provided an in-depth description of the methodology. The discussion informs readers about the larger implications of your study based on the results. Highlighting these implications while not overstating the findings can be challenging, especially when you’re submitting to a journal that selects articles based on novelty or potential impact. Regardless of what journal you are submitting to, the discussion section always serves the same purpose: concluding what your study results actually mean.
A successful discussion section puts your findings in context. It should include:
- the results of your research,
- a discussion of related research, and
- a comparison between your results and initial hypothesis.
Tip: Not all journals share the same naming conventions.
You can apply the advice in this article to the conclusion, results or discussion sections of your manuscript.
Our Early Career Researcher community tells us that the conclusion is often considered the most difficult aspect of a manuscript to write. To help, this guide provides questions to ask yourself, a basic structure to model your discussion off of and examples from published manuscripts.

Questions to ask yourself:
- Was my hypothesis correct?
- If my hypothesis is partially correct or entirely different, what can be learned from the results?
- How do the conclusions reshape or add onto the existing knowledge in the field? What does previous research say about the topic?
- Why are the results important or relevant to your audience? Do they add further evidence to a scientific consensus or disprove prior studies?
- How can future research build on these observations? What are the key experiments that must be done?
- What is the “take-home” message you want your reader to leave with?
How to structure a discussion
Trying to fit a complete discussion into a single paragraph can add unnecessary stress to the writing process. If possible, you’ll want to give yourself two or three paragraphs to give the reader a comprehensive understanding of your study as a whole. Here’s one way to structure an effective discussion:

Writing Tips
While the above sections can help you brainstorm and structure your discussion, there are many common mistakes that writers revert to when having difficulties with their paper. Writing a discussion can be a delicate balance between summarizing your results, providing proper context for your research and avoiding introducing new information. Remember that your paper should be both confident and honest about the results!

- Read the journal’s guidelines on the discussion and conclusion sections. If possible, learn about the guidelines before writing the discussion to ensure you’re writing to meet their expectations.
- Begin with a clear statement of the principal findings. This will reinforce the main take-away for the reader and set up the rest of the discussion.
- Explain why the outcomes of your study are important to the reader. Discuss the implications of your findings realistically based on previous literature, highlighting both the strengths and limitations of the research.
- State whether the results prove or disprove your hypothesis. If your hypothesis was disproved, what might be the reasons?
- Introduce new or expanded ways to think about the research question. Indicate what next steps can be taken to further pursue any unresolved questions.
- If dealing with a contemporary or ongoing problem, such as climate change, discuss possible consequences if the problem is avoided.
- Be concise. Adding unnecessary detail can distract from the main findings.

Don’t
- Rewrite your abstract. Statements with “we investigated” or “we studied” generally do not belong in the discussion.
- Include new arguments or evidence not previously discussed. Necessary information and evidence should be introduced in the main body of the paper.
- Apologize. Even if your research contains significant limitations, don’t undermine your authority by including statements that doubt your methodology or execution.
- Shy away from speaking on limitations or negative results. Including limitations and negative results will give readers a complete understanding of the presented research. Potential limitations include sources of potential bias, threats to internal or external validity, barriers to implementing an intervention and other issues inherent to the study design.
- Overstate the importance of your findings. Making grand statements about how a study will fully resolve large questions can lead readers to doubt the success of the research.
Snippets of Effective Discussions:
Consumer-based actions to reduce plastic pollution in rivers: A multi-criteria decision analysis approach
Identifying reliable indicators of fitness in polar bears
- How to Write a Great Title
- How to Write an Abstract
- How to Write Your Methods
- How to Report Statistics
- How to Edit Your Work
The contents of the Peer Review Center are also available as a live, interactive training session, complete with slides, talking points, and activities. …
The contents of the Writing Center are also available as a live, interactive training session, complete with slides, talking points, and activities. …
There’s a lot to consider when deciding where to submit your work. Learn how to choose a journal that will help your study reach its audience, while reflecting your values as a researcher…
- Research Guides
BSCI 1510L Literature and Stats Guide: 3.2 Components of a scientific paper
- 1 What is a scientific paper?
- 2 Referencing and accessing papers
- 2.1 Literature Cited
- 2.2 Accessing Scientific Papers
- 2.3 Traversing the web of citations
- 2.4 Keyword Searches
- 3 Style of scientific writing
- 3.1 Specific details regarding scientific writing
3.2 Components of a scientific paper
- 4 Summary of the Writing Guide and Further Information
- Appendix A: Calculation Final Concentrations
- 1 Formulas in Excel
- 2 Basic operations in Excel
- 3 Measurement and Variation
- 3.1 Describing Quantities and Their Variation
- 3.2 Samples Versus Populations
- 3.3 Calculating Descriptive Statistics using Excel
- 4 Variation and differences
- 5 Differences in Experimental Science
- 5.1 Aside: Commuting to Nashville
- 5.2 P and Detecting Differences in Variable Quantities
- 5.3 Statistical significance
- 5.4 A test for differences of sample means: 95% Confidence Intervals
- 5.5 Error bars in figures
- 5.6 Discussing statistics in your scientific writing
- 6 Scatter plot, trendline, and linear regression
- 7 The t-test of Means
- 8 Paired t-test
- 9 Two-Tailed and One-Tailed Tests
- 10 Variation on t-tests: ANOVA
- 11 Reporting the Results of a Statistical Test
- 12 Summary of statistical tests
- 1 Objectives
- 2 Project timeline
- 3 Background
- 4 Previous work in the BSCI 111 class
- 5 General notes about the project
- 6 About the paper
- 7 References
Nearly all journal articles are divided into the following major sections: abstract, introduction, methods, results, discussion, and references or literature cited. Usually the sections are labeled as such, although often the introduction (and sometimes the abstract) is not labeled. Sometimes alternative section titles are used. The abstract is sometimes called the "summary", the methods are sometimes called "materials and methods", and the discussion is sometimes called "conclusions". Some journals also include the minor sections of "key words" following the abstract, and "acknowledgments" following the discussion. In some journals, the sections may be divided into subsections that are given descriptive titles. However, the general division into the six major sections is nearly universal.
3.2.1 Abstract
The abstract is a short summary (150-200 words or less) of the important points of the paper. It does not generally include background information. There may be a very brief statement of the rationale for conducting the study. It describes what was done, but without details. It also describes the results in a summarized way that usually includes whether or not the statistical tests were significant. It usually concludes with a brief statement of the importance of the results. Abstracts do not include references. When writing a paper, the abstract is always the last part to be written.
The purpose of the abstract is to allow potential readers of a paper to find out the important points of the paper without having to actually read the paper. It should be a self-contained unit capable of being understood without the benefit of the text of the article . It essentially serves as an "advertisement" for the paper that readers use to determine whether or not they actually want to wade through the entire paper or not. Abstracts are generally freely available in electronic form and are often presented in the results of an electronic search. If searchers do not have electronic access to the journal in which the article is published, the abstract is the only means that they have to decide whether to go through the effort (going to the library to look up the paper journal, requesting a reprint from the author, buying a copy of the article from a service, requesting the article by Interlibrary Loan) of acquiring the article. Therefore it is important that the abstract accurately and succinctly presents the most important information in the article.
3.2.2 Introduction
The introduction section of a paper provides the background information necessary to understand why the described experiment was conducted. The introduction should describe previous research on the topic that has led to the unanswered questions being addressed by the experiment and should cite important previous papers that form the background for the experiment. The introduction should also state in an organized fashion the goals of the research, i.e. the particular, specific questions that will be tested in the experiments. There should be a one-to-one correspondence between questions raised in the introduction and points discussed in the conclusion section of the paper. In other words, do not raise questions in the introduction unless you are going to have some kind of answer to the question that you intend to discuss at the end of the paper.
You may have been told that every paper must have a hypothesis that can be clearly stated. That is often true, but not always. If your experiment involves a manipulation which tests a specific hypothesis, then you should clearly state that hypothesis. On the other hand, if your experiment was primarily exploratory, descriptive, or measurative, then you probably did not have an a priori hypothesis, so don't pretend that you did and make one up. (See the discussion in the introduction to Experiment 5 for more on this.) If you state a hypothesis in the introduction, it should be a general hypothesis and not a null or alternative hypothesis for a statistical test. If it is necessary to explain how a statistical test will help you evaluate your general hypothesis, explain that in the methods section.
A good introduction should be fairly heavy with citations. This indicates to the reader that the authors are informed about previous work on the topic and are not working in a vacuum. Citations also provide jumping-off points to allow the reader to explore other tangents to the subject that are not directly addressed in the paper. If the paper supports or refutes previous work, readers can look up the citations and make a comparison for themselves.
"Do not get lost in reviewing background information. Remember that the Introduction is meant to introduce the reader to your research, not summarize and evaluate all past literature on the subject (which is the purpose of a review paper). Many of the other studies you may be tempted to discuss in your Introduction are better saved for the Discussion, where they become a powerful tool for comparing and interpreting your results. Include only enough background information to allow your reader to understand why you are asking the questions you are and why your hypotheses are reasonable ones. Often, a brief explanation of the theory involved is sufficient.
Write this section in the past or present tense, never in the future. " (Steingraber et al. 1985)
In other words, the introduction section relates what the topic being investigated is, why it is important, what research (if any) has been done prior that is relevant to what you are trying to do, and in what ways you will be looking into this topic.
An example to think about:
This is an example of a student-derived introduction. Read the paragraph and before you go beyond, think about the paragraph first.
"Hand-washing is one of the most effective and simplest of ways to reduce infection and disease, and thereby causing less death. When examining the effects of soap on hands, it was the work of Sickbert-Bennett and colleagues (2005) that showed that using soap or an alcohol on the hands during hand-washing was a significant effect in removing bacteria from the human hand. Based on the work of this, the team led by Larsen (1991) then showed that the use of computer imaging could be a more effective way to compare the amount of bacteria on a hand."
There are several aspects within this "introduction" that could use improvement. A group of any random 4 of you could easily come up with at 10 different things to reword, revise, expand upon.
In specific, there should be one thing addressed that more than likely you did not catch when you were reading it.
The citations: Not the format, but the logical use of them.
Look again. "...the work of Sickbert-Bennett...(2005)" and then "Based on the work of this, the team led by Larsen (1991)..."
How can someone in 1991 use or base their work on something from 2005?
They cannot. You can spend an entire hour using spellcheck and reading through and through again to find all the little things to "give it more oomph", but at the core, you still must present a clear and concise and logical thought-process.
3.2.3 Methods (taken mostly verbatim from Steingraber et al. 1985, until the version A, B,C portion)
The function of the methods section is to describe all experimental procedures, including controls. The description should be complete enough to enable someone else to repeat your work. If there is more than one part to the experiment, it is a good idea to describe your methods and present your results in the same order in each section. This may not be the same order in which the experiments were performed -it is up to you to decide what order of presentation will make the most sense to your reader.
1. Explain why each procedure was done, i.e., what variable were you measuring and why? Example:
Difficult to understand : First, I removed the frog muscle and then I poured Ringer’s solution on it. Next, I attached it to the kymograph.
Improved: I removed the frog muscle and poured Ringer’s solution on it to prevent it from drying out. I then attached the muscle to the kymograph in order to determine the minimum voltage required for contraction.
Better: Frog muscle was excised between attachment points to the bone. Ringer's solution was added to the excised section to prevent drying out. The muscle was attached to the kymograph in order to determine the minimum voltage required for contraction.
2. Experimental procedures and results are narrated in the past tense (what you did, what you found, etc.) whereas conclusions from your results are given in the present tense.
3. Mathematical equations and statistical tests are considered mathematical methods and should be described in this section along with the actual experimental work. (Show a sample calculation, state the type of test(s) performed and program used)
4. Use active rather than passive voice when possible. [Note: see Section 3.1.4 for more about this.] Always use the singular "I" rather than the plural "we" when you are the only author of the paper (Methods section only). Throughout the paper, avoid contractions, e.g. did not vs. didn’t.
5. If any of your methods is fully described in a previous publication (yours or someone else’s), you can cite work that instead of describing the procedure again.
Example: The chromosomes were counted at meiosis in the anthers with the standard acetocarmine technique of Snow (1955).
Below is a PARTIAL and incomplete version of a "method". Without getting into the details of why, Version A and B are bad. A is missing too many details and B is giving some extra details but not giving some important ones, such as the volumes used. Version C is still not complete, but it is at least a viable method. Notice that C is also not the longest....it is possible to be detailed without being long-winded.

In other words, the methods section is what you did in the experiment and has enough details that someone else can repeat your experiment. If the methods section has excluded one or more important detail(s) such that the reader of the method does not know what happened, it is a 'poor' methods section. Similarly, by giving out too many useless details a methods section can be 'poor'.
You may have multiple sub-sections within your methods (i.e., a section for media preparation, a section for where the chemicals came from, a section for the basic physical process that occurred, etc.,). A methods section is NEVER a list of numbered steps.
3.2.4 Results (with excerpts from Steingraber et al. 1985)
The function of this section is to summarize general trends in the data without comment, bias, or interpretation. The results of statistical tests applied to your data are reported in this section although conclusions about your original hypotheses are saved for the Discussion section. In other words, you state "the P-value" in Results and whether below/above 0.05 and thus significant/not significant while in the Discussion you restate the P-value and then formally state what that means beyond "significant/not significant".
Tables and figures should be used when they are a more efficient way to convey information than verbal description. They must be independent units, accompanied by explanatory captions that allow them to be understood by someone who has not read the text. Do not repeat in the text the information in tables and figures, but do cite them, with a summary statement when that is appropriate. Example:
Incorrect: The results are given in Figure 1.
Correct: Temperature was directly proportional to metabolic rate (Fig. 1).
Please note that the entire word "Figure" is almost never written in an article. It is nearly always abbreviated as "Fig." and capitalized. Tables are cited in the same way, although Table is not abbreviated.
Whenever possible, use a figure instead of a table. Relationships between numbers are more readily grasped when they are presented graphically rather than as columns in a table.
Data may be presented in figures and tables, but this may not substitute for a verbal summary of the findings. The text should be understandable by someone who has not seen your figures and tables.
1. All results should be presented, including those that do not support the hypothesis.
2. Statements made in the text must be supported by the results contained in figures and tables.
3. The results of statistical tests can be presented in parentheses following a verbal description.
Example: Fruit size was significantly greater in trees growing alone (t = 3.65, df = 2, p < 0.05).
Simple results of statistical tests may be reported in the text as shown in the preceding example. The results of multiple tests may be reported in a table if that increases clarity. (See Section 11 of the Statistics Manual for more details about reporting the results of statistical tests.) It is not necessary to provide a citation for a simple t-test of means, paired t-test, or linear regression. If you use other more complex (or less well-known) tests, you should cite the text or reference you followed to do the test. In your materials and methods section, you should report how you did the test (e.g. using the statistical analysis package of Excel).
It is NEVER appropriate to simply paste the results from statistical software into the results section of your paper. The output generally reports more information than is required and it is not in an appropriate format for a paper. Similar, do NOT place a screenshot.
Should you include every data point or not in the paper? Prior to 2010 or so, most papers would probably not present the actual raw data collected, but rather show the "descriptive statistics" about their data (mean, SD, SE, CI, etc.). Often, people could simply contact the author(s) for the data and go from there. As many journals have a significant on-line footprint now, it has become increasingly more common that the entire data could be included in the paper. And realize why the entire raw data may not have been included in a publication. Prior to about 2010, your publication had limited paper space to be seen on. If you have a sample of size of 10 or 50, you probably could show the entire data set easily in one table/figure and it not take up too much printed space. If your sample size was 500 or 5,000 or more, the size of the data alone would take pages of printed text. Given how much the Internet and on-line publications have improved/increased in storage space, often now there will be either an embedded file to access or the author(s) will place the file on-line somewhere with an address link, such as GitHub. Videos of the experiment are also shown as well now.
3.2.4.1 Tables
- Do not repeat information in a table that you are depicting in a graph or histogram; include a table only if it presents new information.
- It is easier to compare numbers by reading down a column rather than across a row. Therefore, list sets of data you want your reader to compare in vertical form.
- Provide each table with a number (Table 1, Table 2, etc.) and a title. The numbered title is placed above the table .
- Please see Section 11 of the Excel Reference and Statistics Manual for further information on reporting the results of statistical tests.
3.2.4.2. Figures
- These comprise graphs, histograms, and illustrations, both drawings and photographs. Provide each figure with a number (Fig. 1, Fig. 2, etc.) and a caption (or "legend") that explains what the figure shows. The numbered caption is placed below the figure . Figure legend = Figure caption.
- Figures submitted for publication must be "photo ready," i.e., they will appear just as you submit them, or photographically reduced. Therefore, when you graduate from student papers to publishable manuscripts, you must learn to prepare figures that will not embarrass you. At the present time, virtually all journals require manuscripts to be submitted electronically and it is generally assumed that all graphs and maps will be created using software rather than being created by hand. Nearly all journals have specific guidelines for the file types, resolution, and physical widths required for figures. Only in a few cases (e.g. sketched diagrams) would figures still be created by hand using ink and those figures would be scanned and labeled using graphics software. Proportions must be the same as those of the page in the journal to which the paper will be submitted.
- Graphs and Histograms: Both can be used to compare two variables. However, graphs show continuous change, whereas histograms show discrete variables only. You can compare groups of data by plotting two or even three lines on one graph, but avoid cluttered graphs that are hard to read, and do not plot unrelated trends on the same graph. For both graphs, and histograms, plot the independent variable on the horizontal (x) axis and the dependent variable on the vertical (y) axis. Label both axes, including units of measurement except in the few cases where variables are unitless, such as absorbance.
- Drawings and Photographs: These are used to illustrate organisms, experimental apparatus, models of structures, cellular and subcellular structure, and results of procedures like electrophoresis. Preparing such figures well is a lot of work and can be very expensive, so each figure must add enough to justify its preparation and publication, but good figures can greatly enhance a professional article, as your reading in biological journals has already shown.
3.2.5 Discussion (modified; taken from Steingraber et al. 1985)
The function of this section is to analyze the data and relate them to other studies. To "analyze" means to evaluate the meaning of your results in terms of the original question or hypothesis and point out their biological significance.
1. The Discussion should contain at least:
- the relationship between the results and the original hypothesis, i.e., whether they support the hypothesis, or cause it to be rejected or modified
- an integration of your results with those of previous studies in order to arrive at explanations for the observed phenomena
- possible explanations for unexpected results and observations, phrased as hypotheses that can be tested by realistic experimental procedures, which you should describe
2. Trends that are not statistically significant can still be discussed if they are suggestive or interesting, but cannot be made the basis for conclusions as if they were significant.
3. Avoid redundancy between the Results and the Discussion section. Do not repeat detailed descriptions of the data and results in the Discussion. In some journals, Results and Discussions are joined in a single section, in order to permit a single integrated treatment with minimal repetition. This is more appropriate for short, simple articles than for longer, more complicated ones.
4. End the Discussion with a summary of the principal points you want the reader to remember. This is also the appropriate place to propose specific further study if that will serve some purpose, but do not end with the tired cliché that "this problem needs more study." All problems in biology need more study. Do not close on what you wish you had done, rather finish stating your conclusions and contributions.
5. Conclusion section. Primarily dependent upon the complexity and depth of an experiment, there may be a formal conclusion section after the discussion section. In general, the last line or so of the discussion section should be a more or less summary statement of the overall finding of the experiment. IF the experiment was large enough/complex enough/multiple findings uncovered, a distinct paragraph (or two) may be needed to help clarify the findings. Again, only if the experiment scale/findings warrant a separate conclusion section.
3.2.6 Title
The title of the paper should be the last thing that you write. That is because it should distill the essence of the paper even more than the abstract (the next to last thing that you write).
The title should contain three elements:
1. the name of the organism studied;
2. the particular aspect or system studied;
3. the variable(s) manipulated.
Do not be afraid to be grammatically creative. Here are some variations on a theme, all suitable as titles:
THE EFFECT OF TEMPERATURE ON GERMINATION OF ZEA MAYS
DOES TEMPERATURE AFFECT GERMINATION OF ZEA MAYS?
TEMPERATURE AND ZEA MAYS GERMINATION: IMPLICATIONS FOR AGRICULTURE
Sometimes it is possible to include the principal result or conclusion in the title:
HIGH TEMPERATURES REDUCE GERMINATION OF ZEA MAYS
Note for the BSCI 1510L class: to make your paper look more like a real paper, you can list all of the other group members as co-authors. However, if you do that, you should list you name first so that we know that you wrote it.
3.2.7 Literature Cited
Please refer to section 2.1 of this guide.
- << Previous: 3.1 Specific details regarding scientific writing
- Next: 4 Summary of the Writing Guide and Further Information >>
- Last Updated: Jun 21, 2024 9:40 AM
- URL: https://researchguides.library.vanderbilt.edu/bsci1510L

An official website of the United States government
The .gov means it’s official. Federal government websites often end in .gov or .mil. Before sharing sensitive information, make sure you’re on a federal government site.
The site is secure. The https:// ensures that you are connecting to the official website and that any information you provide is encrypted and transmitted securely.
- Publications
- Account settings
Preview improvements coming to the PMC website in October 2024. Learn More or Try it out now .
- Advanced Search
- Journal List
- J Athl Train
- v.45(1); Jan-Feb 2010
Study/Experimental/Research Design: Much More Than Statistics
Kenneth l. knight.
Brigham Young University, Provo, UT
The purpose of study, experimental, or research design in scientific manuscripts has changed significantly over the years. It has evolved from an explanation of the design of the experiment (ie, data gathering or acquisition) to an explanation of the statistical analysis. This practice makes “Methods” sections hard to read and understand.
To clarify the difference between study design and statistical analysis, to show the advantages of a properly written study design on article comprehension, and to encourage authors to correctly describe study designs.
Description:
The role of study design is explored from the introduction of the concept by Fisher through modern-day scientists and the AMA Manual of Style . At one time, when experiments were simpler, the study design and statistical design were identical or very similar. With the complex research that is common today, which often includes manipulating variables to create new variables and the multiple (and different) analyses of a single data set, data collection is very different than statistical design. Thus, both a study design and a statistical design are necessary.
Advantages:
Scientific manuscripts will be much easier to read and comprehend. A proper experimental design serves as a road map to the study methods, helping readers to understand more clearly how the data were obtained and, therefore, assisting them in properly analyzing the results.
Study, experimental, or research design is the backbone of good research. It directs the experiment by orchestrating data collection, defines the statistical analysis of the resultant data, and guides the interpretation of the results. When properly described in the written report of the experiment, it serves as a road map to readers, 1 helping them negotiate the “Methods” section, and, thus, it improves the clarity of communication between authors and readers.
A growing trend is to equate study design with only the statistical analysis of the data. The design statement typically is placed at the end of the “Methods” section as a subsection called “Experimental Design” or as part of a subsection called “Data Analysis.” This placement, however, equates experimental design and statistical analysis, minimizing the effect of experimental design on the planning and reporting of an experiment. This linkage is inappropriate, because some of the elements of the study design that should be described at the beginning of the “Methods” section are instead placed in the “Statistical Analysis” section or, worse, are absent from the manuscript entirely.
Have you ever interrupted your reading of the “Methods” to sketch out the variables in the margins of the paper as you attempt to understand how they all fit together? Or have you jumped back and forth from the early paragraphs of the “Methods” section to the “Statistics” section to try to understand which variables were collected and when? These efforts would be unnecessary if a road map at the beginning of the “Methods” section outlined how the independent variables were related, which dependent variables were measured, and when they were measured. When they were measured is especially important if the variables used in the statistical analysis were a subset of the measured variables or were computed from measured variables (such as change scores).
The purpose of this Communications article is to clarify the purpose and placement of study design elements in an experimental manuscript. Adopting these ideas may improve your science and surely will enhance the communication of that science. These ideas will make experimental manuscripts easier to read and understand and, therefore, will allow them to become part of readers' clinical decision making.
WHAT IS A STUDY (OR EXPERIMENTAL OR RESEARCH) DESIGN?
The terms study design, experimental design, and research design are often thought to be synonymous and are sometimes used interchangeably in a single paper. Avoid doing so. Use the term that is preferred by the style manual of the journal for which you are writing. Study design is the preferred term in the AMA Manual of Style , 2 so I will use it here.
A study design is the architecture of an experimental study 3 and a description of how the study was conducted, 4 including all elements of how the data were obtained. 5 The study design should be the first subsection of the “Methods” section in an experimental manuscript (see the Table ). “Statistical Design” or, preferably, “Statistical Analysis” or “Data Analysis” should be the last subsection of the “Methods” section.
Table. Elements of a “Methods” Section

The “Study Design” subsection describes how the variables and participants interacted. It begins with a general statement of how the study was conducted (eg, crossover trials, parallel, or observational study). 2 The second element, which usually begins with the second sentence, details the number of independent variables or factors, the levels of each variable, and their names. A shorthand way of doing so is with a statement such as “A 2 × 4 × 8 factorial guided data collection.” This tells us that there were 3 independent variables (factors), with 2 levels of the first factor, 4 levels of the second factor, and 8 levels of the third factor. Following is a sentence that names the levels of each factor: for example, “The independent variables were sex (male or female), training program (eg, walking, running, weight lifting, or plyometrics), and time (2, 4, 6, 8, 10, 15, 20, or 30 weeks).” Such an approach clearly outlines for readers how the various procedures fit into the overall structure and, therefore, enhances their understanding of how the data were collected. Thus, the design statement is a road map of the methods.
The dependent (or measurement or outcome) variables are then named. Details of how they were measured are not given at this point in the manuscript but are explained later in the “Instruments” and “Procedures” subsections.
Next is a paragraph detailing who the participants were and how they were selected, placed into groups, and assigned to a particular treatment order, if the experiment was a repeated-measures design. And although not a part of the design per se, a statement about obtaining written informed consent from participants and institutional review board approval is usually included in this subsection.
The nuts and bolts of the “Methods” section follow, including such things as equipment, materials, protocols, etc. These are beyond the scope of this commentary, however, and so will not be discussed.
The last part of the “Methods” section and last part of the “Study Design” section is the “Data Analysis” subsection. It begins with an explanation of any data manipulation, such as how data were combined or how new variables (eg, ratios or differences between collected variables) were calculated. Next, readers are told of the statistical measures used to analyze the data, such as a mixed 2 × 4 × 8 analysis of variance (ANOVA) with 2 between-groups factors (sex and training program) and 1 within-groups factor (time of measurement). Researchers should state and reference the statistical package and procedure(s) within the package used to compute the statistics. (Various statistical packages perform analyses slightly differently, so it is important to know the package and specific procedure used.) This detail allows readers to judge the appropriateness of the statistical measures and the conclusions drawn from the data.
STATISTICAL DESIGN VERSUS STATISTICAL ANALYSIS
Avoid using the term statistical design . Statistical methods are only part of the overall design. The term gives too much emphasis to the statistics, which are important, but only one of many tools used in interpreting data and only part of the study design:
The most important issues in biostatistics are not expressed with statistical procedures. The issues are inherently scientific, rather than purely statistical, and relate to the architectural design of the research, not the numbers with which the data are cited and interpreted. 6
Stated another way, “The justification for the analysis lies not in the data collected but in the manner in which the data were collected.” 3 “Without the solid foundation of a good design, the edifice of statistical analysis is unsafe.” 7 (pp4–5)
The intertwining of study design and statistical analysis may have been caused (unintentionally) by R.A. Fisher, “… a genius who almost single-handedly created the foundations for modern statistical science.” 8 Most research did not involve statistics until Fisher invented the concepts and procedures of ANOVA (in 1921) 9 , 10 and experimental design (in 1935). 11 His books became standard references for scientists in many disciplines. As a result, many ANOVA books were titled Experimental Design (see, for example, Edwards 12 ), and ANOVA courses taught in psychology and education departments included the words experimental design in their course titles.
Before the widespread use of computers to analyze data, designs were much simpler, and often there was little difference between study design and statistical analysis. So combining the 2 elements did not cause serious problems. This is no longer true, however, for 3 reasons: (1) Research studies are becoming more complex, with multiple independent and dependent variables. The procedures sections of these complex studies can be difficult to understand if your only reference point is the statistical analysis and design. (2) Dependent variables are frequently measured at different times. (3) How the data were collected is often not directly correlated with the statistical design.
For example, assume the goal is to determine the strength gain in novice and experienced athletes as a result of 3 strength training programs. Rate of change in strength is not a measurable variable; rather, it is calculated from strength measurements taken at various time intervals during the training. So the study design would be a 2 × 2 × 3 factorial with independent variables of time (pretest or posttest), experience (novice or advanced), and training (isokinetic, isotonic, or isometric) and a dependent variable of strength. The statistical design , however, would be a 2 × 3 factorial with independent variables of experience (novice or advanced) and training (isokinetic, isotonic, or isometric) and a dependent variable of strength gain. Note that data were collected according to a 3-factor design but were analyzed according to a 2-factor design and that the dependent variables were different. So a single design statement, usually a statistical design statement, would not communicate which data were collected or how. Readers would be left to figure out on their own how the data were collected.
MULTIVARIATE RESEARCH AND THE NEED FOR STUDY DESIGNS
With the advent of electronic data gathering and computerized data handling and analysis, research projects have increased in complexity. Many projects involve multiple dependent variables measured at different times, and, therefore, multiple design statements may be needed for both data collection and statistical analysis. Consider, for example, a study of the effects of heat and cold on neural inhibition. The variables of H max and M max are measured 3 times each: before, immediately after, and 30 minutes after a 20-minute treatment with heat or cold. Muscle temperature might be measured each minute before, during, and after the treatment. Although the minute-by-minute data are important for graphing temperature fluctuations during the procedure, only 3 temperatures (time 0, time 20, and time 50) are used for statistical analysis. A single dependent variable H max :M max ratio is computed to illustrate neural inhibition. Again, a single statistical design statement would tell little about how the data were obtained. And in this example, separate design statements would be needed for temperature measurement and H max :M max measurements.
As stated earlier, drawing conclusions from the data depends more on how the data were measured than on how they were analyzed. 3 , 6 , 7 , 13 So a single study design statement (or multiple such statements) at the beginning of the “Methods” section acts as a road map to the study and, thus, increases scientists' and readers' comprehension of how the experiment was conducted (ie, how the data were collected). Appropriate study design statements also increase the accuracy of conclusions drawn from the study.
CONCLUSIONS
The goal of scientific writing, or any writing, for that matter, is to communicate information. Including 2 design statements or subsections in scientific papers—one to explain how the data were collected and another to explain how they were statistically analyzed—will improve the clarity of communication and bring praise from readers. To summarize:
- Purge from your thoughts and vocabulary the idea that experimental design and statistical design are synonymous.
- Study or experimental design plays a much broader role than simply defining and directing the statistical analysis of an experiment.
- A properly written study design serves as a road map to the “Methods” section of an experiment and, therefore, improves communication with the reader.
- Study design should include a description of the type of design used, each factor (and each level) involved in the experiment, and the time at which each measurement was made.
- Clarify when the variables involved in data collection and data analysis are different, such as when data analysis involves only a subset of a collected variable or a resultant variable from the mathematical manipulation of 2 or more collected variables.
Acknowledgments
Thanks to Thomas A. Cappaert, PhD, ATC, CSCS, CSE, for suggesting the link between R.A. Fisher and the melding of the concepts of research design and statistics.
Have a language expert improve your writing
Run a free plagiarism check in 10 minutes, generate accurate citations for free.
- Knowledge Base
- Dissertation
- How to Write a Results Section | Tips & Examples
How to Write a Results Section | Tips & Examples
Published on August 30, 2022 by Tegan George . Revised on July 18, 2023.
A results section is where you report the main findings of the data collection and analysis you conducted for your thesis or dissertation . You should report all relevant results concisely and objectively, in a logical order. Don’t include subjective interpretations of why you found these results or what they mean—any evaluation should be saved for the discussion section .
Instantly correct all language mistakes in your text
Upload your document to correct all your mistakes in minutes

Table of contents
How to write a results section, reporting quantitative research results, reporting qualitative research results, results vs. discussion vs. conclusion, checklist: research results, other interesting articles, frequently asked questions about results sections.
When conducting research, it’s important to report the results of your study prior to discussing your interpretations of it. This gives your reader a clear idea of exactly what you found and keeps the data itself separate from your subjective analysis.
Here are a few best practices:
- Your results should always be written in the past tense.
- While the length of this section depends on how much data you collected and analyzed, it should be written as concisely as possible.
- Only include results that are directly relevant to answering your research questions . Avoid speculative or interpretative words like “appears” or “implies.”
- If you have other results you’d like to include, consider adding them to an appendix or footnotes.
- Always start out with your broadest results first, and then flow into your more granular (but still relevant) ones. Think of it like a shoe store: first discuss the shoes as a whole, then the sneakers, boots, sandals, etc.
Receive feedback on language, structure, and formatting
Professional editors proofread and edit your paper by focusing on:
- Academic style
- Vague sentences
- Style consistency
See an example

If you conducted quantitative research , you’ll likely be working with the results of some sort of statistical analysis .
Your results section should report the results of any statistical tests you used to compare groups or assess relationships between variables . It should also state whether or not each hypothesis was supported.
The most logical way to structure quantitative results is to frame them around your research questions or hypotheses. For each question or hypothesis, share:
- A reminder of the type of analysis you used (e.g., a two-sample t test or simple linear regression ). A more detailed description of your analysis should go in your methodology section.
- A concise summary of each relevant result, both positive and negative. This can include any relevant descriptive statistics (e.g., means and standard deviations ) as well as inferential statistics (e.g., t scores, degrees of freedom , and p values ). Remember, these numbers are often placed in parentheses.
- A brief statement of how each result relates to the question, or whether the hypothesis was supported. You can briefly mention any results that didn’t fit with your expectations and assumptions, but save any speculation on their meaning or consequences for your discussion and conclusion.
A note on tables and figures
In quantitative research, it’s often helpful to include visual elements such as graphs, charts, and tables , but only if they are directly relevant to your results. Give these elements clear, descriptive titles and labels so that your reader can easily understand what is being shown. If you want to include any other visual elements that are more tangential in nature, consider adding a figure and table list .
As a rule of thumb:
- Tables are used to communicate exact values, giving a concise overview of various results
- Graphs and charts are used to visualize trends and relationships, giving an at-a-glance illustration of key findings
Don’t forget to also mention any tables and figures you used within the text of your results section. Summarize or elaborate on specific aspects you think your reader should know about rather than merely restating the same numbers already shown.
A two-sample t test was used to test the hypothesis that higher social distance from environmental problems would reduce the intent to donate to environmental organizations, with donation intention (recorded as a score from 1 to 10) as the outcome variable and social distance (categorized as either a low or high level of social distance) as the predictor variable.Social distance was found to be positively correlated with donation intention, t (98) = 12.19, p < .001, with the donation intention of the high social distance group 0.28 points higher, on average, than the low social distance group (see figure 1). This contradicts the initial hypothesis that social distance would decrease donation intention, and in fact suggests a small effect in the opposite direction.

Figure 1: Intention to donate to environmental organizations based on social distance from impact of environmental damage.
In qualitative research , your results might not all be directly related to specific hypotheses. In this case, you can structure your results section around key themes or topics that emerged from your analysis of the data.
For each theme, start with general observations about what the data showed. You can mention:
- Recurring points of agreement or disagreement
- Patterns and trends
- Particularly significant snippets from individual responses
Next, clarify and support these points with direct quotations. Be sure to report any relevant demographic information about participants. Further information (such as full transcripts , if appropriate) can be included in an appendix .
When asked about video games as a form of art, the respondents tended to believe that video games themselves are not an art form, but agreed that creativity is involved in their production. The criteria used to identify artistic video games included design, story, music, and creative teams.One respondent (male, 24) noted a difference in creativity between popular video game genres:
“I think that in role-playing games, there’s more attention to character design, to world design, because the whole story is important and more attention is paid to certain game elements […] so that perhaps you do need bigger teams of creative experts than in an average shooter or something.”
Responses suggest that video game consumers consider some types of games to have more artistic potential than others.
Your results section should objectively report your findings, presenting only brief observations in relation to each question, hypothesis, or theme.
It should not speculate about the meaning of the results or attempt to answer your main research question . Detailed interpretation of your results is more suitable for your discussion section , while synthesis of your results into an overall answer to your main research question is best left for your conclusion .
Prevent plagiarism. Run a free check.
I have completed my data collection and analyzed the results.
I have included all results that are relevant to my research questions.
I have concisely and objectively reported each result, including relevant descriptive statistics and inferential statistics .
I have stated whether each hypothesis was supported or refuted.
I have used tables and figures to illustrate my results where appropriate.
All tables and figures are correctly labelled and referred to in the text.
There is no subjective interpretation or speculation on the meaning of the results.
You've finished writing up your results! Use the other checklists to further improve your thesis.
If you want to know more about AI for academic writing, AI tools, or research bias, make sure to check out some of our other articles with explanations and examples or go directly to our tools!
Research bias
- Survivorship bias
- Self-serving bias
- Availability heuristic
- Halo effect
- Hindsight bias
- Deep learning
- Generative AI
- Machine learning
- Reinforcement learning
- Supervised vs. unsupervised learning
(AI) Tools
- Grammar Checker
- Paraphrasing Tool
- Text Summarizer
- AI Detector
- Plagiarism Checker
- Citation Generator
The results chapter of a thesis or dissertation presents your research results concisely and objectively.
In quantitative research , for each question or hypothesis , state:
- The type of analysis used
- Relevant results in the form of descriptive and inferential statistics
- Whether or not the alternative hypothesis was supported
In qualitative research , for each question or theme, describe:
- Recurring patterns
- Significant or representative individual responses
- Relevant quotations from the data
Don’t interpret or speculate in the results chapter.
Results are usually written in the past tense , because they are describing the outcome of completed actions.
The results chapter or section simply and objectively reports what you found, without speculating on why you found these results. The discussion interprets the meaning of the results, puts them in context, and explains why they matter.
In qualitative research , results and discussion are sometimes combined. But in quantitative research , it’s considered important to separate the objective results from your interpretation of them.
Cite this Scribbr article
If you want to cite this source, you can copy and paste the citation or click the “Cite this Scribbr article” button to automatically add the citation to our free Citation Generator.
George, T. (2023, July 18). How to Write a Results Section | Tips & Examples. Scribbr. Retrieved July 10, 2024, from https://www.scribbr.com/dissertation/results/
Is this article helpful?

Tegan George
Other students also liked, what is a research methodology | steps & tips, how to write a discussion section | tips & examples, how to write a thesis or dissertation conclusion, "i thought ai proofreading was useless but..".
I've been using Scribbr for years now and I know it's a service that won't disappoint. It does a good job spotting mistakes”
Purdue Online Writing Lab Purdue OWL® College of Liberal Arts
APA Sample Paper: Experimental Psychology

Welcome to the Purdue OWL
This page is brought to you by the OWL at Purdue University. When printing this page, you must include the entire legal notice.
Copyright ©1995-2018 by The Writing Lab & The OWL at Purdue and Purdue University. All rights reserved. This material may not be published, reproduced, broadcast, rewritten, or redistributed without permission. Use of this site constitutes acceptance of our terms and conditions of fair use.
Beyond the War: Public Service and the Transmission of Gender Norms
This paper combines personnel records of the U.S. federal government with census data to study how shocks to the gender composition of a large organization can persistently shift gender norms. Exploiting city-by-department variation in the sudden expansion of female clerical employment driven by World War I, we find that daughters of civil servants exposed to female co-workers are more likely to work later in life, command higher income, and have fewer children. These intergenerational effects increase with the size of the city-level exposure to female government workers and are driven by daughters in their teenage years at the time of exposure. We also show that cities exposed to a larger increase in female federal workers saw persistently higher female labor force participation in the public sector, as well as modest contemporaneous increases in private sector labor force participation suggestive of spill-overs. Collectively, the results are consistent with both the vertical and horizontal transmission of gender norms and highlight how increasing gender representation within the public sector can have broader labor market implications.
We thank seminar participants at the Chicago Economic History workshop, Duke, UBC, Simon Fraser, Nottingham, LSE, and Vanderbilt for their helpful suggestions. The views expressed herein are those of the authors and do not necessarily reflect the views of the National Bureau of Economic Research.
MARC RIS BibTeΧ
Download Citation Data
Working Groups
Conferences, more from nber.
In addition to working papers , the NBER disseminates affiliates’ latest findings through a range of free periodicals — the NBER Reporter , the NBER Digest , the Bulletin on Retirement and Disability , the Bulletin on Health , and the Bulletin on Entrepreneurship — as well as online conference reports , video lectures , and interviews .

Information
- Author Services
Initiatives
You are accessing a machine-readable page. In order to be human-readable, please install an RSS reader.
All articles published by MDPI are made immediately available worldwide under an open access license. No special permission is required to reuse all or part of the article published by MDPI, including figures and tables. For articles published under an open access Creative Common CC BY license, any part of the article may be reused without permission provided that the original article is clearly cited. For more information, please refer to https://www.mdpi.com/openaccess .
Feature papers represent the most advanced research with significant potential for high impact in the field. A Feature Paper should be a substantial original Article that involves several techniques or approaches, provides an outlook for future research directions and describes possible research applications.
Feature papers are submitted upon individual invitation or recommendation by the scientific editors and must receive positive feedback from the reviewers.
Editor’s Choice articles are based on recommendations by the scientific editors of MDPI journals from around the world. Editors select a small number of articles recently published in the journal that they believe will be particularly interesting to readers, or important in the respective research area. The aim is to provide a snapshot of some of the most exciting work published in the various research areas of the journal.
Original Submission Date Received: .
- Active Journals
- Find a Journal
- Proceedings Series
- For Authors
- For Reviewers
- For Editors
- For Librarians
- For Publishers
- For Societies
- For Conference Organizers
- Open Access Policy
- Institutional Open Access Program
- Special Issues Guidelines
- Editorial Process
- Research and Publication Ethics
- Article Processing Charges
- Testimonials
- Preprints.org
- SciProfiles
- Encyclopedia
Article Menu

- Subscribe SciFeed
- Recommended Articles
- Author Biographies
- Google Scholar
- on Google Scholar
- Table of Contents
Find support for a specific problem in the support section of our website.
Please let us know what you think of our products and services.
Visit our dedicated information section to learn more about MDPI.
JSmol Viewer
Analysis and experimental study on the stability of large-span caverns’ surrounding rock based on the progressive collapse mechanism, 1. introduction, 2. basic theory, 2.1. upper limit theorem, 2.2. hoek–brown nonlinear failure criterion, 2.3. calculation of energy consumption based on the upper limit method, 3. analysis of the collapse mechanism of the surrounding rock of large-span caverns, 3.1. establishment of a computational model, 3.2. solution to the collapse curve of rock surrounding a large-span cavern vault, 4. calculation of the progressive collapse process of the surrounding rock of a large-span cavern, 4.1. establishment of the progressive collapse model, 4.2. analytical solution of the progressive collapse curve of a large-span cavern’s surrounding rock, 5. model test of the progressive collapse of the surrounding rock of a large-span cavern, 5.1. selection of similar scale, 5.2. identification of similar materials, 5.3. test conditions, 5.4. test steps for the progressive collapse model of large-span caverns, 5.5. results and analysis of a 60 m large-span cavern model test, 5.6. comparative analysis of theoretical calculation and experimental results, 6. influence of cavern span on stability of surrounding rock, 6.1. model test of 30 m-span cavern, 6.2. model test of 40 m-span cavern, 6.3. model test of 50 m-span cavern, 7. conclusions, author contributions, institutional review board statement, informed consent statement, data availability statement, conflicts of interest.
- He, M.; Jing, H.; Sun, X. Soft Rock Engineering Mechanics ; Science Press: Beijing, China, 2002. [ Google Scholar ]
- Cai, M.; He, M.; Liu, D. Rock Mechanics and Engineering ; Science Press: Beijing, China, 2013. [ Google Scholar ]
- Fraldi, M.; Guarracino, F. Limit analysis of collapse mechanisms in cavities and tunnels according to the Hoek-Brown failure criterion. Int. J. Rock Mech. Min. Sci. 2009 , 46 , 665–673. [ Google Scholar ] [ CrossRef ]
- Fraldi, M.; Guarracino, F. Analytical solutions for collapse mechanisms in tunnels with arbitrary cross sections. Int. J. Solids Struct. 2010 , 47 , 216–223. [ Google Scholar ] [ CrossRef ]
- Fraldi, M.; Guarracino, F. Evaluation of impending collapse in circular tunnels by analytical and numerical approaches. Tunn. Undergr. Space Technol. 2011 , 26 , 507–516. [ Google Scholar ] [ CrossRef ]
- Yang, X.L.; Huang, F. Collapse mechanism of shallow tunnel based on nonlinear Hoek–Brown failure criterion. Tunn. Undergr. Space Technol. 2011 , 26 , 686–691. [ Google Scholar ] [ CrossRef ]
- Yang, X.L.; Yan, R.M. Collapse mechanism for deep tunnel subjected to seepage force in layered soils. Geomech. Eng. 2015 , 8 , 741–756. [ Google Scholar ] [ CrossRef ]
- Yang, X.L.; Xu, J.S.; Li, Y.X.; Yan, R.M. Collapse mechanism of tunnel roof considering joined influences of nonlinearity and non-associated flow rule. Geomech. Eng. 2016 , 10 , 21–35. [ Google Scholar ] [ CrossRef ]
- Yang, X.L.; Zhou, T.; Li, W.T. Reliability analysis of tunnel roof in layered Hoek-Brown rock masses. Comput. Geotech. 2018 , 104 , 302–309. [ Google Scholar ] [ CrossRef ]
- Yu, L.; Lü, C.; Wang, M. Three-dimensional upper bound limit analysis of deep soil tunnels based on nonlinear Mohr-Coulomb criterion. Chin. J. Geotech. Eng. 2019 , 41 , 1023–1030. [ Google Scholar ]
- Sun, C.; Lan, S.; Tao, Q.; Guan, X.; Han, X. Upper bound analysis of three-dimensional progressive collapse mechanism of deep tunnel roof with weak surrounding rock. Rock Soil Mech. 2023 , 44 , 2471–2484. [ Google Scholar ]
- Skrzypkowski, K.; Korzeniowski, W.; Zagórski, K.; Zagórska, A. Adjustment of the Yielding System of Mechanical Rock Bolts for Room and Pillar Mining Method in Stratified Rock Mass. Energies 2020 , 13 , 2082. [ Google Scholar ] [ CrossRef ]
- Korzeniowski, W.; Poborska-Młynarska, K.; Skrzypkowski, K. The Idea of the Recovery of Municipal Solid Waste Incineration (MSWI) Residues in Klodawa Salt Mine Sa by Filling the Excavations With Self-Solidifying Mixtures. Arch. Min. Sci. 2018 , 63 , 553–565. [ Google Scholar ]
- Wang, C. Study on the Progressive Failure Mechanism of the Surrounding Rock of Tunnel Constructed in Soft Rock. Ph.D. Dissertation, Tongji University, Shanghai, China, 2007. [ Google Scholar ]
- Zhu, H.; Huang, F.; Xu, Q. Model test and numerical simulation for progressive failure of weak and fractured tunnel surrounding rock under different overburden depths. Chin. J. Rock Mech. Eng. 2010 , 29 , 1113–1122. [ Google Scholar ]
- Xu, Q.; Ding, W.; Zhu, H.; Tang, Z.; Li, Y. Study on progressive unloading failure characteristics of superlarge tunnel in soft and weak rock mass. China Civ. Eng. J. 2017 , 50 , 104–114. [ Google Scholar ]
- Wei, X.; Duan, Y.; Qiao, N.; Feng, J. Causes and countermeasures of accidents related to underground construction in China. J. Tsinghua Univ. (Sci. Technol.) 2019 , 59 , 314–325. [ Google Scholar ]
- Chen, W.F. Limit Analysis and Soil Plasticity ; Elsevier: Amsterdam, The Netherlands, 1975; pp. 85–96. [ Google Scholar ]
- Hoek, E.; Brown, E.T. Practical estimate the rock mass strength. Int. J. Rock Mech. Min. Sci. 1997 , 34 , 1165–1186. [ Google Scholar ] [ CrossRef ]
- Hoek, E.; Carranza-Torres, C.; Corkum, B. Hoek-Brown Failure Criterion ; University of Toronto Press: Toronto, ON, Canada, 2002; pp. 267–273. [ Google Scholar ]
Click here to enlarge figure
| CAVERN Span (cm) | Number of Collapses | Half Width of Falling Body (cm) | Collapse Height (cm) |
|---|---|---|---|
| 30 | 0 | 0 | 0 |
| 40 | 1 | 15 | 10.9 |
| 50 | 2 | 25 | 29.9 |
| 60 | 3 | 30 | 45.1 |
| The statements, opinions and data contained in all publications are solely those of the individual author(s) and contributor(s) and not of MDPI and/or the editor(s). MDPI and/or the editor(s) disclaim responsibility for any injury to people or property resulting from any ideas, methods, instructions or products referred to in the content. |
Share and Cite
Chen, H.; Fan, J.; Xu, J. Analysis and Experimental Study on the Stability of Large-Span Caverns’ Surrounding Rock Based on the Progressive Collapse Mechanism. Appl. Sci. 2024 , 14 , 5929. https://doi.org/10.3390/app14135929
Chen H, Fan J, Xu J. Analysis and Experimental Study on the Stability of Large-Span Caverns’ Surrounding Rock Based on the Progressive Collapse Mechanism. Applied Sciences . 2024; 14(13):5929. https://doi.org/10.3390/app14135929
Chen, Huanxia, Junqi Fan, and Jingmao Xu. 2024. "Analysis and Experimental Study on the Stability of Large-Span Caverns’ Surrounding Rock Based on the Progressive Collapse Mechanism" Applied Sciences 14, no. 13: 5929. https://doi.org/10.3390/app14135929
Article Metrics
Article access statistics, further information, mdpi initiatives, follow mdpi.
Subscribe to receive issue release notifications and newsletters from MDPI journals
An official website of the United States Government
- Kreyòl ayisyen
- Search Toggle search Search Include Historical Content - Any - No Include Historical Content - Any - No Search
- Menu Toggle menu
- INFORMATION FOR…
- Individuals
- Business & Self Employed
- Charities and Nonprofits
- International Taxpayers
- Federal State and Local Governments
- Indian Tribal Governments
- Tax Exempt Bonds
- FILING FOR INDIVIDUALS
- How to File
- When to File
- Where to File
- Update Your Information
- Get Your Tax Record
- Apply for an Employer ID Number (EIN)
- Check Your Amended Return Status
- Get an Identity Protection PIN (IP PIN)
- File Your Taxes for Free
- Bank Account (Direct Pay)
- Payment Plan (Installment Agreement)
- Electronic Federal Tax Payment System (EFTPS)
- Your Online Account
- Tax Withholding Estimator
- Estimated Taxes
- Where's My Refund
- What to Expect
- Direct Deposit
- Reduced Refunds
- Amend Return
Credits & Deductions
- INFORMATION FOR...
- Businesses & Self-Employed
- Earned Income Credit (EITC)
- Child Tax Credit
- Clean Energy and Vehicle Credits
- Standard Deduction
- Retirement Plans
Forms & Instructions
- POPULAR FORMS & INSTRUCTIONS
- Form 1040 Instructions
- Form 4506-T
- POPULAR FOR TAX PROS
- Form 1040-X
- Circular 230
Audit techniques guide: Credit for Increasing Research Activities (i.e. Research Tax Credit) IRC § 41* - Qualified research activities
More in file.
- Business tax account
- Small business and self-employed
- Large business
- Corporations
- Partnerships
- Charities and nonprofits
- International taxpayers
- Governmental liaisons
- Federal, state and local governments
- Indian tribal governments
- Tax exempt bonds
Publication date: June 2005
* Unless otherwise indicated, all section references are to the Internal Revenue Code of 1986, as amended, and the treasury regulations.
Note: This guide is current through the publication date. Since changes may have occurred after the publication date that would affect the accuracy of this document, no guarantees are made concerning the technical accuracy after the publication date.
Chapter 4 | Table of contents | Chapter 6
5. Qualified research activities
A. in general.
In order for an activity to qualify for the research credit, the taxpayer must show that it meets all the requirements as described in section 41(d). Under section 41(d), the term "qualified research" means research:
- With respect to which expenditures may be treated as expenses under section 174, (also known as the section 174 test);
- Which is undertaken for the purpose of discovering information which is technological in nature, (also known as the discovering technological information test);
- The application of which is intended to be useful in the development of a new or improved business component of the taxpayer (also known as the business component test); and
- Substantially all of the activities of which constitutes elements of a process of experimentation for a qualified purpose (also known as the process of experimentation test).
To be considered “qualified research”, the taxpayer must be able to establish that the research activity being performed meets ALL four of the above tests. 11 These tests must be applied separately to each business component of the taxpayer. Activities listed in section 41(d)(4) are not qualified research. Infra.
(1). The Section 174 test
In order to meet the section 174 test, the expenditure must (1) be incurred in connection with the taxpayer’s trade or business, and (2) represent a research and development cost in the experimental or laboratory sense.
Expenditures represent research and development costs in the experimental or laboratory sense if they are for activities intended to discover information that would eliminate uncertainty concerning the development or improvement of a product. Uncertainty exists if the information available to the taxpayer does not establish the capability or method for developing or improving the product or the appropriate design of the product.
Whether expenditures qualify as research or experimental expenditures depends on the nature of the activity to which the expenditures relate, not the nature of the product or improvement being developed or the level of technological advancement the product or improvement represents.
Section 174 treatment is allowed only to the extent that the amount is reasonable under the circumstances. Expenditures for land and depreciable property are not allowed under section 174, although in certain cases, depreciation may be treated as a section 174 expense. (Depreciation is not a QRE under section 41). Exploration expenditures do not qualify as section 174 expenses. Furthermore, the provisions of section 174 are not applicable to any expenditure paid or incurred for the purpose of ascertaining the existence, location, extent, or quality of any deposit of ore, oil, gas, or other mineral. Refer to the regulations under section 174 for further explanation on specific expense disallowances.
Treasury Regulation section 1.174-2(a)(3) disallows section 174 treatment for certain activities, including:
- The ordinary testing or inspection of materials or products for quality control;
- Efficiency surveys;
- Management studies;
- Consumer surveys;
- Advertising or promotions;
- The acquisition of another’s patent, model, production or process; or
- Research in connection with literary, historical, or similar projects.
Since section 41 is more restrictive than section 174, expenses allowable under section 174 will still have to meet the other requirements of section 41(b) and (d) to be a QRE. For example, patent procurement expenses generally qualify under section 174 but would not qualify under section 41.
(2). The discovering technological information test
Final regulations, issued in January 2004 (TD 9104), 12 mirror the 2001 proposed regulations with respect to the discovering technological information test. There is no “discovery” requirement under section 41 separate and apart from that already required under Treasury Regulation section 1.174-2(a)(1) (i.e., was the research undertaken to eliminate uncertainty concerning the development or improvement of a business component). The final regulations, like the proposed regulations, abandon the requirement that the research activities be undertaken to obtain knowledge that exceeds, expands or refines the common knowledge of skilled professionals in a particular field of science or engineering.
Research is undertaken for the purpose of discovering information if it is intended to eliminate uncertainty concerning the development or improvement of a business component. Uncertainty exists if the information available to the taxpayer does not establish the capability or method for developing or improving the business component, or the appropriate design of the business component.
In order to satisfy the technological in nature requirement for qualified research, the process of experimentation used to discover information must fundamentally rely on principles of the physical or biological sciences, engineering, or computer science. A taxpayer may employ existing technologies and may rely on existing principles of the physical or biological sciences, engineering, or computer science to satisfy this requirement.
The final regulations state that the issuance of a patent by the Patent and Trademark Office under 35 USC sections 51 is conclusive evidence that a taxpayer has discovered information that is technological in nature that is intended to eliminate uncertainty concerning the development or improvement of a business component. This is known as the “patent safe-harbor”. Be aware that the issuance of a patent is not conclusive evidence of qualified research, as the taxpayer still has to meet all the other activity requirements of section 41(d). Examiners should note that the securing of a patent usually occurs sometime after the actual research year(s).
(3). The business component test
The taxpayer must intend to apply the information being discovered to develop a new or improved business component of the taxpayer. A business component is any product, process, computer software, technique, formula, or invention, which is to be held for sale, lease, license, or used in a trade or business of the taxpayer. Often times, taxpayers group all research in one broad category and do not identify the specific business component to which the business relates. A taxpayer must be able to tie the research it is claiming for the credit to the relevant business component. The ‘substantially all’ test is applied at the business component level.
(4). The process of experimentation test
The final research credit regulations provide rules on the “process of experimentation test”, which requires that qualified research be research “substantially all of the activities of which constitute elements of a process of experimentation”.
The final regulations clarify the requirement that a process of experimentation is a process designed to evaluate one or more alternatives to achieve a result where the capability or the method of achieving that result, or the appropriate design of that result, is uncertain as of the beginning of the taxpayer’s research activities. Examiners are encouraged to read the preamble to these regulations to get a better understanding of the changes made. A taxpayer may undertake a process of experimentation if there is no uncertainty concerning the taxpayer's capability or method of achieving the desired result, so long as the appropriate design of the desired result is uncertain as of the beginning of the taxpayer's research activities. Uncertainty exists if the information available to the taxpayer does not establish the capability or method for developing or improving the business component, or the appropriate design of the business component.
The final regulations articulate the core elements of a process of experimentation. In addition to requiring that the research be undertaken for the purpose of discovering information that is technological in nature, the taxpayer must:
- Identify the uncertainty regarding the development or improvement of a business component that is the object of the taxpayer’s research activities;
- Identify one or more alternatives intended to eliminate that uncertainty; and
- Identify and conduct a process of evaluating the alternatives.
The key difference regarding “uncertainty” in sections 41 and 174 is that, under section 41, uncertainly must relate to a qualified purpose, and must be resolved through a 3-element process of experimentation, fundamentally relying on the principles of the hard sciences, engineering, or computer science. The regulations clarify that merely demonstrating that uncertainty has been eliminated is insufficient to satisfy the process of experimentation test. Focus upon developing facts necessary to determine whether the taxpayer’s activities meet these requirements and the core elements.
The preamble to the final regulations states that because of the clarifications made, the readily discernible and applicable provision in the 2001 proposed regulations is no longer necessary, because those activities do not constitute a process of experimentation under the final regulations. Accordingly, examiners who properly applied the “readily discernible and applicable” rule as a basis for disallowing the research credit have made proper adjustments. In pending and future examinations, however, the readily discernible and applicable standard should not be applied to a taxpayer’s activities.
In order for activities to constitute qualified research under section 41(d)(1), 80 percent or more of taxpayer’s research activities, measured on a cost or other consistently applied reasonable basis (and without regard to Treasury Regulation section 1.41-2(d)(2)), must constitute elements of a process of experimentation for a qualified purpose. The regulations provide that, if this substantially all requirement is met, then the balance of the research activities may qualify, if the remaining balance meets the requirements of section 41(d)(1)(A) (with respect to which expenditures may be treated as expenses under section 174), and if they are not excluded activities under section 41(d)(4) (such as research after commercial production, adaptation or duplication of an existing business component, etc.).
Although the final regulations are effective for taxable years ending after December 31, 2003, the Service will not challenge return positions that are consistent with the final regulations. As these final regulations merely clarify the proposed regulations upon which taxpayers are already relying, the Service’s administrative approach will follow these final rules for all open years.
The process of experimentation must be conducted for a “qualified purpose”, i.e., it must relate to a new or improved function, performance, reliability, or quality of the business component. The process of experimentation is not for a qualified purpose if it relates to style, taste, cosmetic, or seasonal design factors. I.R.C. § 41(d)(3)(B). Accordingly, be alert to claimed QREs for research related to non-functional aspects of the business component.
b. Shrink back
The requirements of section 41(d) are to be applied first at the level of the discrete business component, i.e., the product, process, computer software, technique, formula, or invention to be held for sale, lease, or license, or used by the taxpayer in its trade or business.
If the requirements for credit eligibility are met at that first level, then some, or all, of the taxpayer's research activities are eligible for the credit. If all aspects of such requirements are not met at that level, the test applies at the most significant subset of elements of the product, process, computer software, technique, formula, or invention to be held for sale, lease, or license. This “shrinking back” is to continue until either a subset of elements of the business component that satisfies the requirements is reached, or the most basic element of the business component is reached and such element fails to satisfy the test.
The burden is on the taxpayer to establish that all of the section 41(d)(1) requirements have been met. The examiner should issue an IDR requesting a list of each qualifying project or activity, along with a complete description of that activity or project as a starting point in the evaluation, including the business component to which each research activity relates. As with the evaluation of wages, interviews should be considered to supplement and corroborate information obtained from the review of existing records.
c. Exclusions
There are certain research activities that are specifically excluded from qualified research under section 41(d)(4). It is critical to look at the underlying facts to see if the exclusions apply. Taxpayer labels are not controlling. The following activities are not qualified research:
1. Exclusion for research after commercial production
Section 41(d) (4) states that qualified research does not include any research conducted after the beginning of commercial production. A business component is considered ready for commercial production when it is developed to the point where it is ready for use or meets the basic functional and economic requirements of the taxpayer. In some cases, there may be “product release” documents where all responsible managers sign off that the new product and or new production method is now released for production, which may be helpful in the application of this exclusion.
The following activities are deemed to occur after the commencement of commercial production:
- Preproduction planning for a finished business component,
- Tooling up for production,
- Trial production runs,
- Troubleshooting involving detecting faults in production equipment or processes,
- Accumulating data relating to production processes, and
- Debugging flaws in a business component.
This per se list includes “debugging” activities, but not “correction of flaws”. Treasury Regulation section 1.41 4(c)(10), Examples 1 and 2, illustrate the application of the exclusion for research after commercial production.
2. Exclusion for adaptation
This exclusion applies if the taxpayer's activities relate to adapting an existing business component to a particular customer's requirement or need. This exclusion does not apply merely because a business component is intended for a specific customer. A contractor’s adaptation of an existing business component to a taxpayer’s particular requirement or need is not qualified research.
Treasury Regulation section 1.41 4(c)(10), Examples 3 7, illustrates the application of the adaptation exclusion.
3. Exclusion for duplication
This exclusion applies if the taxpayer reproduced an existing business component, in whole or in part, from a physical examination of the business component, plans, blueprints, detailed specifications, or publicly available information with respect to such component. This exclusion does not apply merely because the taxpayer evaluates another's business component in the course of developing its own business component.
Treasury Regulation section 1.41 4(c)(10), Example 8, illustrates the application of the duplication exclusion.
4. Exclusion for surveys, studies, research relating to management functions
The following activities are excluded under this provision:
- Management functions or techniques, including such items as preparation of financial data and analysis, development of employee training programs and management organization plans, and management based changes in production processes (such as rearranging work stations on an assembly line);
- Market research, testing, or development (including advertising or promotions);
- Routine data collections; or
- Routine or ordinary testing or inspections for quality control.
Treasury Regulation section 41 4(c)(10), Example 9, illustrates the application of this exclusion.
Note that it is the activity which governs, not the intended end result. For example, the development of a new production process, which met all the tests for qualified research, would not be excluded simply because the activity was preceded by a management efficiency survey.
5. Exclusion for internal-use software
This exclusion is beyond the scope of this ATG.
6. Exclusion for foreign research
Qualified research does not include any research conducted outside the United States, Puerto Rico, or any possession of the United States. 13 This exclusion applies to in-house, as well as contract research. The foreign research disallowance applies even if the research is done by American researchers, or performed for an American taxpayer.
7. Exclusion for research in the social sciences, etc.
Qualified research does not include research in the social sciences (including economics, business management, and behavioral sciences, arts, or humanities).
Treasury Regulation section 1.41 4(c)(10), Example 10, illustrates the application of this exclusion. Note that the process, not the end result, governs. The development of new formulation of artists’ paint would not be excluded simply because it benefited the arts, while research into Van Gogh’s life would be excluded under this rule.
8. Exclusion for funded research
The exclusion for "funded research" under section 41(d)(4)(H) provides that the credit shall not be available for qualified research to the extent funded by a contract, grant, or otherwise by another person (or governmental entity).
All agreements (not only research contracts) entered into between the taxpayer performing the research and other persons are to be considered in determining the extent to which the research is funded. As a result, the examiner should request a complete copy of all contracts (including modifications), agreements, letters of understanding or similar documents where funding is an issue. These contracts and similar documents will need to be reviewed to determine whether, and to what, extent the research is to be considered funded. A “fixed-price” contract, where the customer agrees to pay a set price for a deliverable, and a “cost-plus” contract, where the customer agrees to pay the actual costs incurred by the contractor in acquiring/constructing the deliverable plus an additional amount for profit, are examples of the different contracts you may encounter. Counsel can be helpful in securing and interpreting these agreements. In the case of documents that are “classified” by a government agency, contact the Classified Contract Technical Advisor or a Research Credit Technical Advisor for further assistance.
In order to determine if the contractor’s research expenditures are “funded”, you must resolve the following issues:
- Is payment for the contractor’s research activities “contingent upon the success of the research” under Treasury Regulation section 1.41-4A(d)(1)?
- Does the contractor retain “substantial rights” in the results of the research activities within the meaning of Treasury Regulation section 1.41-4A(d)(2)?
If the answer to either question is no, then the research is treated as funded. Amounts payable under any agreements that are contingent on the success of the research (thus considered to be paid for the product or result of the research) are treated as funded research. If a contractor retains substantial rights in the results of the research, and if payment to him is contingent on the success of the research, then the contract is not funded and the contractor is eligible to claim the credit.
Note that, if the contractor performing research for another person does not retain substantial rights in the research, and if the research payments are contingent on the contractor’s success, neither the contractor nor the person paying for the research is eligible to claim the credit.
If a taxpayer performing qualified research for another person retains substantial rights in the research under the agreement providing for the research, the research is funded to the extent of the payments (and fair market value of any property) to which the taxpayer becomes entitled by performing the research. A taxpayer does not retain substantial rights in the research if the taxpayer must pay for the right to use the results of the research.
Frequently, taxpayers make some sort of funding allocation between “qualified research” and “non-qualified research” expenditures incurred in certain types of contracts, e.g., cost-share or cost overrun situations. In so doing, taxpayers often overlook the “pro rata allocation” requirements of Treasury Regulation section 1.41-4A(d)(3)(ii).
The general rule is that funding is to be allocated 100 percent to otherwise qualified research expenses (as provided by Treasury Regulation section 1.41-4A(d)(3)(i)) unless the taxpayer can meet the pro rata allocation requirements of Treasury Regulation section 1.41-4A(d)(3)(ii).
Pursuant to Treasury Regulation section 1.41-4A(d)(3)(ii), the taxpayer may allocate funding pro rata to nonqualified, and otherwise qualified research expenses, rather than allocating it 100 percent to otherwise qualified research expenses, if the taxpayer can establish to the satisfaction of the Service:
- the total amount of research expenses,
- that the total amount of research expenses exceed the funding, and
- that the otherwise qualified research expenses (that is, the expenses that would be qualified research expenses if there were no funding) exceed 65 percent of the funding.
In no event, however, shall less than 65 percent of the funding be applied against the otherwise qualified research expenses. Material adjustments may be warranted if the specific requirements of Treasury Regulation section 1.41-4A(d)(3)(ii) have not been met.
Funding is determinable only in the subsequent taxable year. Treasury Regulation section 1.41-4A(d)(5) states that if, at the time the taxpayer files its return for a taxable year, it is impossible to determine to what extent particular research performed by the taxpayer during the year may be funded, then the taxpayer shall treat the research as completely funded for purposes of completing that return. When the amount of funding is finally determined, the taxpayer should amend the return and any interim returns to reflect the proper amount of funding.
11 In the case of certain software developed for internal use, taxpayers must meet the requirements of an additional three-part “high threshold of innovation” test. See Prop. Treas. Reg. § 1.41-4(c)(6)(vi). See also the ANPRM relating to the section 41(d)(4)(E) internal use software exclusion.
12 Final Regulations for the Definition of Qualified Research under section 41(d) (doc, 90kb), also in HTML (htm, 137kb) and Adobe (pdf, 65kb), T.D. 9104.
13 Section 41(d)(4)(F) was modified by P.L. 106-170 section 502(c)(1) which added the Commonwealth of Puerto Rico and any possession of the United States for amounts paid or incurred after June 30, 1999. Prior to amendment, section 41(d)(4)(F) applied only to the United States.
Chapter 4 | Table of Contents | Chapter 6
Experimental validation of an analytical transient model for saturated boosting gain in DC–DC converters with variable duty cycle
- Open access
- Published: 09 July 2024
- Volume 6 , article number 375 , ( 2024 )
Cite this article
You have full access to this open access article

- Golina Samir Adly 1 ,
- Wagdy R. Anis 1 ,
- Simon Ezzat 1 &
- Sameh O. Abdullatif 2
This paper presents an innovative approach to characterize the boosting gain saturation phenomenon in DC–DC converters with variable duty cycles, a crucial component in energy management applications such as renewable energy systems and IoT devices. While existing literature predominantly relies on steady-state models to explain boosting gain behaviour, this study reveals discrepancies between theoretical predictions and experimental observations, particularly at high duty cycles. The research introduces an analytical model to accurately capture the boosting gain dynamics of a boost chopper converter, addressing the limitations of traditional steady-state analyses. Through experimental validation and numerical simulations using CAD tools, a significant boosting gain saturation of approximately 2.2 is empirically observed, highlighting the necessity for a transient model approach. By providing a comprehensive understanding of the boosting ratio constraints in practical boost converters, this work contributes to advancing the analytical modelling techniques in the field. The mathematical model’s validation through rigorous experimental measurements and simulation analyses underscores its reliability and applicability in real-world scenarios. The structured organization of the paper elucidates the development and verification process, culminating in insightful conclusions that underscore the significance of transient modelling in enhancing the performance and efficiency of DC–DC converters.
Article Highlights
Novel transient model enhances DC–DC converter performance.
Boosting gain saturation validated through experiments.
Insights on boosting ratio constraints for practical applications
Avoid common mistakes on your manuscript.
1 Introduction
Generally, utilizing a DC–DC converter linking the generating source with the load in renewable energy systems is a must [ 1 , 2 , 3 ]. The DC–DC converter not only matches the operating point of the input to ensure maximum power delivery [ 4 ], but also immune the load from any expected DC fluctuations observed in the renewable energy source under various environmental changes [ 5 ]. Due to the variation in the harvester power, DC–DC converters can buck or boost or buck-boost the voltage based on the utilized topology [ 6 , 7 ]. Moreover, DC–DC converters were traditionally integrated using inductor-based filters. However, for the sake of CMOS-based converters, inductor-less converters glow up using different architectures, such as switching capacitors [ 8 ]. In the photovoltaic industry, boost converters are widely used, either to step up the voltage to match the utility grid specifications [ 9 ] or compensate for voltage drop due to partial shading [ 10 , 11 ]. In a steady-state analysis, the output voltage can be linked to the input voltage through a basic equation given by [ 12 ]:
where \({V}_{o}\) is the output DC voltage from the converter, \({V}_{g}\) is the generator input voltage, and \(d\) is the duty cycle. The frequently used steady-state analysis results in Eq. ( 1 ) showed that the output voltage is independent of the switching frequency. Additionally, for boost converters, the output voltage can record a boost factor of 10 for a duty cycle of 90%. The fabricated DC–DC converters reported have a totally different behavior in terms of switching frequency dependence or boosting limitations [ 13 ].
Transient analysis for the boost converter topologies is required to investigate the influence of the switching frequency and the limitation associated with the boosting ratio [ 14 ]. Various attempts have been conducted in the literature toward such transient analysis [ 12 , 14 , 15 , 16 , 17 , 18 ]. In [ 18 ], a mathematical method is presented for describing the behavior of the buck-boost DC–DC converter in continuous conduction mode (CCM). The study’s main concern was the effect of the converter components on the transient response of the buck-boost DC–DC converter [ 18 ]. Another attempt in [ 15 ] demonstrated an optimized DC–DC converter component selection model considering the circuit dynamics. Recently, transient analytical analysis for the DC–DC converter has been presented in [ 14 ]. The work developed an analytical method for modeling a DC–DC converter’s inductor currents and capacitor voltages (ICCV) [ 14 ]. Although the work in [ 14 ] introduces the transient theoretical analysis for a DC–DC converter, the ultra-high duty cycle’s impact need to be better demonstrated. Accordingly, a literature gap is a theoretical study of the DC–DC boost converters under transient conditions.
In recent research, the work in [ 19 , 20 , 21 , 22 ] introduced a sophisticated composite nonlinear controller tailored for stabilizing a constant power load (CPL) connected to a DC–DC boost converter (DBC) within DC microgrid setups. Challenges posed by significant variations in load and input voltages pose obstacles to the controller’s efficacy. Consequently, enhancements are made to the dynamical model to encompass constrained external uncertainties [ 19 , 22 ]. Subsequently, an attempt in [ 19 ] with hybrid controller is devised, amalgamating elements of a nonlinear backstepping controller with a sliding mode controller. The global stability of the proposed system in [ 19 ] was rigorously scrutinized through the lens of control Lyapunov function theory, ensuring robustness and reliability in operation. Comprehensive simulation studies conducted in MATLAB/Simulink, coupled with experimental validations on an in-house hardware platform, corroborate the effectiveness of the composite controller even under scenarios characterized by substantial variations and disturbances were demonstrated in [ 1 , 5 , 7 , 8 , 19 , 20 , 21 , 22 ].
This study introduces a pioneering endeavor to meticulously elucidate the fundamental topology of a DC–DC boost converter through analytical means. The primary aim is to delve deeper into the inherent limitations of boosting ratio within practical boost converters, a complexity that eludes conventional steady-state analyses. The validation of our novel mathematical model is meticulously conducted through a comprehensive amalgamation of CAD simulations and empirical measurements. The manuscript unfolds in a meticulously structured manner, comprising four distinct sections that build upon each other seamlessly. The subsequent section meticulously delineates the schematic representation of the DC–DC converter, accentuating the conventional steady-state paradigm. Section three unveils the intricacies of the analytical model, providing a robust framework for understanding the boosting ratio dynamics. The ensuing section meticulously chronicles the rigorous experimental and simulation validation processes, shedding light on the model’s efficacy and accuracy. Ultimately, the conclusive section encapsulates the key findings and implications, culminating in a profound synthesis of the study’s contributions and future research directions.
2 Boost chopper converter
The boost chopper converter is considered one of the foundational architectures for boost DC–DC converters in the literature [ 23 ], see schematic in Fig. 1 . In such a schematic, a MOSFET acting as a switch is the main distinguishing element through a pulse width modulated (PWM) signal fed to the gate terminal. In the on-state, see Fig. 1 b, the generator is directly connected to the inductor, where the inductor is in the charging phase, see Fig. 2 a. Alternatively, the off-state of the switch, demonstrated in Fig. 1 c, shows a discharging inductor in the RC circuit elements (cf. Fig. 2 a) while the generator is still supplying the circuit.

a basic boost chopper converter topology, b circuit schematic under the on-phase of the MOSFET acting as a switch, and b circuit schematic under the off-phase of the MOSFET acting as a switch

a the driving PWM signal is feeding the gate terminal of a MOSFET acting as a switch, the current passing through the inductor is, the current passing through the MOSFET \({i}_{s}\) , and the current passing through the diode \({i}_{D}\) , b the voltage drop across the inductor \({V}_{L}\) , and c the current passing through the capacitor \({i}_{c}\) is in the boost chopper converter during both on-phase (red), and off-phase (blue) switching, assuming steady state analysis
Applying state analysis for the circuit shown in Fig. 1 a results in a varying inductor voltage as plotted in Fig. 2 b, and current passing in the capacitor as demonstrated in Fig. 2 c. Considering zero average voltage drop on the inductor under a steady state, the relation between the output voltage and the generated input voltage can be expressed as in Eq. ( 1 ). Although this transfer function can reflect the role of the duty cycle in tuning the boosting gain factor, it fails to represent the variation in the output voltage in terms of the switching frequency as a function of the PWM signal clocking. Additionally, the steady-state model, given in Eq. ( 1 ), reflects an unlimited gain factor proportional to the increase in the duty cycle, which is physically unacceptable. Consequently, the following section presents a detailed analytical transient model to describe the transfer function for the boost chopper converter, showing the theoretical gain factor limitations.
3 Analytical transient model
This section presents a detailed analytical transient model for the boost chopper DC–DC converter. The analysis is divided into two parts: on-phase and off-phase for the MOSFET acting as a switch.
Part (a): when the MOSFET is in the on-state (period: \({T}_{ON}=dT\) , see Fig. 1 b)
where \({V}_{g}\) is the generated voltage, \(L\) is the inductance, and \({i}_{L}\) is the current passes through the inductor. Integrating both sides give:
where \({k}_{1}\) is an integration constant. Considering zero initial condition for both time and current, then \({k}_{1}\) is zero, leading to
Part (b): when the MOSFET is in the off-state (period: \({T}_{Off}=(1-\text{d})T\) , see Fig. 1 c)
where \({V}_{o}\) is the output voltage. Alternatively, the output voltage \({V}_{o}\) can be represented as:
where \(C\) is the capacitance, it is the current passing through the capacitor, \(R\) is the resistance, and \({i}_{o}\) is the output current flowing in the resistance. Substituting with ( 6 ) in ( 5 ), we get
Rearranging Eq. ( 5 ) so that:
Differentiating both sides while assuming a pure steady-state input voltage, we get:
Substituting from ( 9 ) to ( 7 ), we reach:
Rearranging Eq. ( 10 ) as a second-order differential equation in the form of:
Solving ( 13 ) by considering \(it\) as the summation of a complementary solution and particular residual solution given by:
where \({i}^{\prime}\) represents the complementary solution and \({i}^{{\prime}{\prime}}\) for the residual solution. The complementary solution is given by re-substituting the \({i}{\prime}\) as:
So ( 11 ) takes the form of a quadratic equation:
The above quadratic equation showed roots given by:
where \({K}_{1}\) and \({K}_{2}\) represent the roots of the quadratic equation given in ( 14 ). Consequently, the complementary and particular residual solutions for the second order differential equation in ( 11 ) can have the form of:
where \({A}_{1}\) and \({A}_{2}\) are differential equation arbitrary constants. The given solution can have one of the following three alternatives:
IF \(\frac{4{R}^{2}C}{L}<1\) , then \({K}_{1}\) and \({K}_{2}\) are real.
IF \(\frac{4{R}^{2}C}{L}>1\) , then \({K}_{1}\) and \({K}_{2}\) are imaginary.
IF \(\frac{4{R}^{2}C}{L}=1\) then \({K}_{1}\) = \({K}_{1}\) = \(K=\frac{-1}{2RC}\) are imaginary. This led to a solution given:
The arbitrary constants \({A}_{1}\) , and \({A}_{2}\) can be calculated using the initial conditions. The first condition is that the incremental increase in the conductor current \({i}_{L}\) during the charging phase should equal the incremental decrease during the discharging phase. While the MOSFET is turned on, the voltage drop across the inductor is given as follows:
Accordingly, the incremental change in the inductor current during charging can be written as:
Alternatively, the drop of \({i}_{L}\) during the discharging state, using Eq. ( 20 )
Equating ( 23 ) and ( 24 ), we get:
Knowing that \({\text{T}}_{\text{ON}}=\text{dT}\) , \({\text{T}}_{\text{OFF}}=\left(1-d\right)\) o, and the switching frequency \(F=\frac{1}{T}\) then
Another condition is the voltage drop across the capacitor, which should show the exact incremental change in the switch in the on and off phases. Accordingly, both Eqs. ( 27 ) and ( 28 ) represent the incremental increase and decrease in the capacitor voltage drop, respectively:
The current flowing in the capacitor can be represented as a part of a nodal analysis by:
While considering the off-state, the output voltage drop is given by:
Herein, the output current can be given as:
Resulting with capacitor flowing current as:
Substituting in ( 28 ), we get:
Equalizing ( 27 ) and ( 33 ) and solving ( 26 ) to get the two arbitrary constants, then a final form for the inductor current can be driven as:
4 Results and discussion
In the previous section, we demonstrated a detailed analytical model for the boost chopper converter. Herein, we utilized the Multisim simulation tool to validate the analytical model. The same circuit as in Fig. 1 a is simulated, see Fig. 3 , while considering both steady-state DC analysis and transient analysis. As illustrated previously, the current study focuses on the impact of the duty cycle on the boosting gain. Therefore, we simulated the given schematic under varying duty cycle with constant switching frequency. The duty cycle variation was addressed in Fig. 4 , with a constant switching frequency of 5 kHz. During both iterations, the boosting gain given as \(\frac{{V}_{o max}}{{V}_{g}}\) is traced.

Simulated schematic for the boost chopper converter

Transient analysis for the boost chopper converter under varying duty cycles. a 20%, b 40%, c 60%, and d 80%, with a constant switching frequency of 5 kHz
Experientially, the circuit in Fig. 5 a is integrated and characterized. It is observed that the component values in Fig. 5 do not typically match the simulated circuit in Fig. 3 . This is attributed to the component availability in the market. However, such mismatching does not influence the validation process, as the boosting gain is a normalized parameter intendant on the circuit component values. The prototype implemented is displayed in Fig. 5 b, with some demonstrations for the input and output signals as displayed on the oscilloscope in Fig. 5 c–e. The experimental validation was conducted in the same procedure as the simulation work. The switching frequency during the duty cycle variation was set to 4 kHz. Although the primitive trials were conducted on a relatively low switching frequency, the prototype in Fig. 5 b was furtherly tested on a relatively higher frequency between 50 kHz to 1 MHz. This range allows for efficient power conversion while balancing factors such as component size, efficiency, and electromagnetic interference considerations. Herein, we utilize Hameg HMF2550 Arbitrary Function Generator to sweep the input frequency, connected to a digital oscilloscope (Oscilloscope HAMEG HMO3522), see Fig. 5 c–e.

a Schematic for the experimentally integrated boost chopper converter, b Discrete electronics prototype for the experimentally integrated boost chopper converter, c the output on oscilloscope showing high ripples due to absence of output capacitor, d Output on oscilloscope showing the output ripples with the falling edge of the PWM signal, and e Input and output voltages on the oscilloscope
For data interpretation, a critical parameter affecting the boosting gain is the duty cycle. Based on the theoretical steady-state analysis, the duty cycle should significantly influence the boosting gain, reaching up to 10 times amplification at a duty cycle of 90%, see Table 1 . However, experimentally, the boosting gain shows saturation behavior above 50% duty cycle, cf. Figure 6 and Table 1 . This can be physically interpreted using the schematic in Fig. 1 c during the turn-off state of the MOSFET. The voltage is nearly doubled herein due to the generated source series connected to the charged inductor. Accordingly, the saturated boosting gain should be clipped by nearly two, as observed in the experimental results in Fig. 6 and Table 1 . Theoretically, the steady-state model does not show such saturation behavior. Alternatively, the transient simulation model using Multisim could demonstrate the limited boosting gain at high-duty cycles. Fortunately, the analytical model described in Sect. 3 illustrated highly agreed results with the transient simulations.

the impact of the duty cycle on the boosting gain using analytical, simulation, and experimental data at a switching frequency of 4 kHz. The traditional model repre4sent the model in Eq. ( 1 )
Results show expected deflection in the experimental data against the simulated and analytically calculated data. We attribute this to a range of experimental parasitic effects including but not limited to; the output resistance associated with the MOSFET in the saturation region, the parasitic resistance included in the inductors as well as the input DC source, and the capacitive coupling effects during switching process as all these uncertainties are not included in the simulation and analytical models. On the other hand, an acceptable consistency between the simulation results and analytically calculated data is demonstrated in Table 1 . This validates that the analytical model given in section three can describe the impact of duty cycle on the boosting gain, showing a saturated behavior, where the steady state model fails. Generally, the reported data in this study validate the utility of the proposed analytical model in describing the actual behavior of boost DC–DC converters. The model can be extended to include more schematics, where we consider such extension as a part of future work.
5 Conclusion
In conclusion, the current steady demonstrated an analytical model capable of deterring the transient boosting gain for a boost chopper converter. While the developed analytical model may appear intricate at first glance, we posit that such complexity is necessary to establish a robust foundation. Once derived, this analytical framework can serve as a valuable resource for the research community, sparing them the arduous task of re-derivation and allowing for direct utilization of the final analytical form. The impact of duty cycle variation was studied, showing the theoretical saturation limit of the gain under a relatively high duty cycle. The model fills in the gaps missing by the steady-state model toward perfect matching with experimental data reported in this study. A nearly double boosting gain was observed as a saturation level regardless of the increase in the duty cycle. The current analytical model may be a seed for a generic transient analytical model for DC–DC converters.
Data availability
The data that support the findings of this study are available from the corresponding author upon reasonable request.
Code availability
Not applicable for that section.
Abbreviations
: Differential equation arbitrary constant (A)
: Dummy variable (1)
: The capacitance (F)
: Duty cycle (1)
: Switching frequency (Hz.)
: The current passing through the capacitor (A)
: The current passing through the inductor (A)
: The output current flowing in the resistance (A)
: The complementary solution (A)
: The particular residual solution (A)
: A dummy mathematical term to represent \(\frac{d{i}_{L}}{dt}\) (1)
: The first root of the quadratic equation is given in (14) (1)
: The Second root of the quadratic equation given in (14) (1)
: A dummy integration constant (1)
: The inductance (H)
: The generator input voltage (V)
: The output DC voltage from the converter (V)
: The resistance (Ω)
: PWM signal period (Sec.)
: The on-state period = \(dT\) (Sec.)
: The off-state period = \((1-d)T\) (Sec.)
Raghavendra KVG, et al. A comprehensive review of DC–DC converter topologies and modulation strategies with recent advances in solar photovoltaic systems. Electronics. 2019;9(1):31.
Article Google Scholar
Hassan NM, Abdellatif SO. Assessing centralized and decentralized EV charging schemes using PV-grid connected system, case study in Egypt. In: Hassan NM, editor. 2021 International conference on microelectronics (ICM). New Cairo City: IEEE; 2021. p. 232–5. https://doi.org/10.1109/ICM52667.2021.9664915 .
Chapter Google Scholar
Sanad MF, Shalan AE, Abdellatif SO, Serea ESA, Adly MS, Ahsan M. Thermoelectric energy harvesters: a review of recent developments in materials and devices for different potential applications. Top Curr Chem. 2020;378(6):1–43.
Google Scholar
Adly GS, Anis WR, Riad PHS, Samaan MSF, Saadany ER, Abdellatif SO. Techno-economic feasibility study on a PV system for peach crop irrigation in Egypt. In: Adly GS, editor. 2022 International seminar on intelligent technology and its applications (ISITIA). Surabaya: IEEE; 2022. p. 455–9. https://doi.org/10.1109/ISITIA56226.2022.9855273 .
Srinivasan M, Kwasinski A. Control analysis of parallel DC–DC converters in a DC microgrid with constant power loads. Int J Electr Power Energy Syst. 2020;122: 106207.
Azizi M, Husev O, Vinnikov D. Single-stage buck-boost inverters: a state-of-the-art survey. Energies. 2022;15(5):1622.
Makar MN, Abdellatif SO. Assessing the trade-off in the evaluating parameters of various buck DC–DC converter topologies. In: Makar MN, editor. 2022 International seminar on intelligent technology and its applications (ISITIA). Surabaya: IEEE; 2022. p. 440–3. https://doi.org/10.1109/ISITIA56226.2022.9855210 .
Xia Z, Stauth JT. A cascaded hybrid switched-capacitor DC–DC converter capable of fast self startup for USB power delivery. IEEE J Solid State Circ. 2022;57(6):1854–64.
Lee H-S, Yun J-J. High-efficiency bidirectional buck–boost converter for photovoltaic and energy storage systems in a smart grid. IEEE Trans Power Electron. 2018;34(5):4316–28.
Farh HM, Othman MF, Eltamaly AM, Al-Saud M. Maximum power extraction from a partially shaded PV system using an interleaved boost converter. Energies. 2018;11(10):2543.
Farh HM, Eltamaly AM, Al-Saud MS. Interleaved boost converter for global maximum power extraction from the photovoltaic system under partial shading. IET Renew Power Gener. 2019;13(8):1232–8.
Azer P, Emadi A. Generalized state space average model for multi-phase interleaved buck, boost and buck-boost DC–DC converters: transient, steady-state and switching dynamics. IEEE Access. 2020;8:77735–45. https://doi.org/10.1109/ACCESS.2020.2987277 .
Rastmanesh M. A synchronized boost converter for low power photo voltaic harvesting with practical design considerations. In: Rastmanesh M, editor. 2022 12th International conference on power, energy and electrical engineering (CPEEE). Shiga: IEEE; 2022. p. 108–12.
Marey A, Bhaskar MS, Almakhles D, Mostafa H. Analytical solution for transient reactive elements for DC–DC converter circuits. Electronics. 2022;11(19):3121.
Hinov N, Hranov T. Model-based optimisation of a buck-boost DC–DC converter. In: Hinov N, editor. 2020 21st International symposium on electrical apparatus and technologies (SIELA). Bourgas: IEEE; 2020. p. 1–5. https://doi.org/10.1109/SIELA49118.2020.9167056 .
Celikovic J, Cavallini P, Abedinpour S, Maksimovic D. Minimum-deviation transient response in non-inverting buck-boost DC–DC converters. In: Celikovic J, editor. 2020 IEEE 21st workshop on control and modeling for power electronics (COMPEL). Aalborg: IEEE; 2020. p. 1–8. https://doi.org/10.1109/COMPEL49091.2020.9265704 .
Bhattacharjee A, Kandpal K. A low power, charge-sensitive preamplifier integrated with a silicon nanowire biosensor. In: Bhattacharjee A, editor. 2021 IEEE Latin America electron devices conference (LAEDC). Mexico: IEEE; 2021. p. 1–4.
Bahravar S, Mahery HM, Babaei E, Sabahi M. Mathematical modeling and transient analysis of dc–dc buck-boost converter in CCM. In: Bahravar S, editor. 2012 IEEE 5th India international conference on power electronics (IICPE). Delhi: IEEE; 2012. p. 1–6.
Ghosh SK, Roy TK, Alam Z, Saha S, Alzahrani A. Transient stability enhancement of DC–DC boost converters feeding constant power loads in DC microgrid applications via composite nonlinear control techniques. IEEE Access. 2023. https://doi.org/10.1109/ACCESS.2023.3291772 .
Venugopal R, et al. Review on unidirectional non-isolated high gain DC–DC converters for EV sustainable DC fast charging applications. IEEE Access. 2023;11:78299–338.
Langarica-Cordoba D, Martinez-Rodriguez PR, Diaz-Saldierna LH, Leyva-Ramos J, Reyes-Cruz D, Iturriaga-Medina S. Passivity-based control for a DC/DC high-gain transformerless boost converter. Asian J Control. 2023;25(1):26–39.
Molina-Santana E, Gonzalez-Montañez F, Liceaga-Castro JU, Jimenez-Mondragon VM, Siller-Alcala I. Modeling and control of a DC–DC buck-boost converter with non-linear power inductor operating in saturation region considering electrical losses. Mathematics. 2023;11(22):4617.
Devarapalli D, Mehbodniya A, Reddy NM, Saravanan S, Sudha GJ. High step-up voltage gain boost chopper-fed DC–DC converter for medium voltage applications. In: Devarapalli D, editor. 2022 4th International conference on smart systems and inventive technology (ICSSIT). Tirunelveli: IEEE; 2022. p. 792–8.
Download references
The authors would like to acknowledge the support and contribution of the STDF in this work. As part of the STDF Project ID#33502.
Author information
Authors and affiliations.
Electronics and Communication Department, Faculty of Engineering, Ain Shams University, Cairo, Egypt
Golina Samir Adly, Wagdy R. Anis & Simon Ezzat
FabLab in the Centre for Emerging Learning Technologies (CELT), Electrical Engineering Department, Faculty of Engineering, The British University in Egypt (BUE), El-Sherouk, Cairo, 11837, Egypt
Sameh O. Abdullatif
You can also search for this author in PubMed Google Scholar
Contributions
Golina Samir Adly, Wagdy R. Anis, Simon Ezzat, and Sameh O. Abdullatif contributed equally to this work.
Corresponding author
Correspondence to Sameh O. Abdullatif .
Ethics declarations
Ethics approval and consent to participate.
Not applicable for that section. All authors confirm their participation in this paper.
Consent for publication
All authors accept the publication rules applied by the journal.
Competing interests
No conflict of interest exists in the submission of this manuscript, and all authors approve the manuscript for publication. I would like to declare on behalf of my co-authors that the work described was original research that has not been published previously and is not under consideration for publication elsewhere, in whole or in part. All the authors listed have approved the manuscript that is enclosed.
Additional information
Publisher's note.
Springer Nature remains neutral with regard to jurisdictional claims in published maps and institutional affiliations.
Rights and permissions
Open Access This article is licensed under a Creative Commons Attribution 4.0 International License, which permits use, sharing, adaptation, distribution and reproduction in any medium or format, as long as you give appropriate credit to the original author(s) and the source, provide a link to the Creative Commons licence, and indicate if changes were made. The images or other third party material in this article are included in the article's Creative Commons licence, unless indicated otherwise in a credit line to the material. If material is not included in the article's Creative Commons licence and your intended use is not permitted by statutory regulation or exceeds the permitted use, you will need to obtain permission directly from the copyright holder. To view a copy of this licence, visit http://creativecommons.org/licenses/by/4.0/ .
Reprints and permissions
About this article
Adly, G.S., Anis, W.R., Ezzat, S. et al. Experimental validation of an analytical transient model for saturated boosting gain in DC–DC converters with variable duty cycle. Discov Appl Sci 6 , 375 (2024). https://doi.org/10.1007/s42452-024-05997-w
Download citation
Received : 14 April 2024
Accepted : 27 May 2024
Published : 09 July 2024
DOI : https://doi.org/10.1007/s42452-024-05997-w
Share this article
Anyone you share the following link with will be able to read this content:
Sorry, a shareable link is not currently available for this article.
Provided by the Springer Nature SharedIt content-sharing initiative
- Boost chopper converter
- Analytical model
- Experimental validation
- CAD simulation
- Boosting gain
Advertisement
- Find a journal
- Publish with us
- Track your research
NTRS - NASA Technical Reports Server
Filter results, collections, top results, subject category, distribution.
Help | Advanced Search
Computer Science > Computation and Language
Title: scaling synthetic data creation with 1,000,000,000 personas.
Abstract: We propose a novel persona-driven data synthesis methodology that leverages various perspectives within a large language model (LLM) to create diverse synthetic data. To fully exploit this methodology at scale, we introduce Persona Hub -- a collection of 1 billion diverse personas automatically curated from web data. These 1 billion personas (~13% of the world's total population), acting as distributed carriers of world knowledge, can tap into almost every perspective encapsulated within the LLM, thereby facilitating the creation of diverse synthetic data at scale for various scenarios. By showcasing Persona Hub's use cases in synthesizing high-quality mathematical and logical reasoning problems, instructions (i.e., user prompts), knowledge-rich texts, game NPCs and tools (functions) at scale, we demonstrate persona-driven data synthesis is versatile, scalable, flexible, and easy to use, potentially driving a paradigm shift in synthetic data creation and applications in practice, which may have a profound impact on LLM research and development.
| Comments: | Work in progress |
| Subjects: | Computation and Language (cs.CL); Machine Learning (cs.LG) |
| Cite as: | [cs.CL] |
| (or [cs.CL] for this version) | |
| Focus to learn more arXiv-issued DOI via DataCite |
Submission history
Access paper:.
- HTML (experimental)
- Other Formats
References & Citations
- Google Scholar
- Semantic Scholar
BibTeX formatted citation
Bibliographic and Citation Tools
Code, data and media associated with this article, recommenders and search tools.
- Institution
arXivLabs: experimental projects with community collaborators
arXivLabs is a framework that allows collaborators to develop and share new arXiv features directly on our website.
Both individuals and organizations that work with arXivLabs have embraced and accepted our values of openness, community, excellence, and user data privacy. arXiv is committed to these values and only works with partners that adhere to them.
Have an idea for a project that will add value for arXiv's community? Learn more about arXivLabs .
COMMENTS
A typical research paper contains a Title Page, Abstract, Introduction, Methods, Results, Discussion, and References section. Some also contain a Table and Figures section and Appendix section.
The results section is where you present the results of your research-both narrated for the readers in plain English and accompanied by statistics. Note : Depending on the requirements or the projected length of your paper, sometimes the results are combined with the discussion section.
Experimental design is the process of planning an experiment to test a hypothesis. The choices you make affect the validity of your results.
Explore the art of crafting outstanding experimental research papers with this comprehensive guide. Learn the essential structure, from title to appendices, and gain practical tips for seamless writing.
Experimental Section. The Experimental Section should be a concise step-by-step summary of what was done during the experiment (the actual procedure) followed by a summary of the physical properties you recorded (melting point, etc) and spectral data (IR, NMR, etc). In general the experimental section should give all the information necessary ...
The methods section of a research paper provides the information by which a study's validity is judged. Therefore, it requires a clear and precise description of how an experiment was done, and the rationale for why specific experimental procedures were chosen.
Experimental reports follow a general to specific to general pattern. Your report will start off broadly in your introduction and discussion of the literature; the report narrows as it leads up to your specific hypotheses, methods, and results. Your discussion transitions from talking about your specific results to more general ramifications, future work, and trends relating to your research.
Experimental sections are, therefore, key to the longevity and continued impact of your research. So, how does one approach writing this critical section? Since your research is novel and original, you, the authors of the manuscript, are the only ones in the world who, at present, know how to carry out your experiments.
How to write a clear and informative experimental section for your research paper? This article provides some useful guidelines and tips to help you achieve this goal and ensure the longevity of your research . Learn from the best practices and examples of ACS publications.
The art and practice of academic neurosurgery are mastered by defining and learning the pertinent basic principles and skills. This article aims to present general guidelines to one of the many roles of a neurosurgeon: Writing an experimental research paper. Every...
A complete research paper in APA style that is reporting on experimental research will typically contain a Title page, Abstract, Introduction, Methods, Results, Discussion, and References sections. 1 Many will also contain Figures and Tables and some will have an Appendix or Appendices. These sections are detailed as follows (for a more in ...
Abstract. Experimental research serves as a fundamental scientific method aimed at unraveling cause-and-effect relationships between variables across various disciplines. This paper delineates the ...
Possibly the easiest section of the whole manuscript to write—write down what you did, how much you used, and how long you left it to stir, then hey presto! You have your experimental section. Easy though it may be to write, there are still things you can do to make your experimental section an easy read. Don't forget, this is the evidence for all of your ideas presented in the paper and ...
Methods section is a crucial part of a manuscript and emphasizes the reliability and validity of a research study. And knowing how to write the methods section of a research paper is the first step in mastering scientific writing. Read this article to understand the importance, purpose, and the best way to write the methods section of a research paper.
The methods section of a research paper provides the information by which a study's validity is judged. Therefore, it requires a clear and precise description of how an experiment was done, and the rationale for why specific experimental procedures were chosen. The methods section should describe wh …
The discussion section contains the results and outcomes of a study. An effective discussion informs readers what can be learned from your experiment and provides context for the results.
The introduction section of a paper provides the background information necessary to understand why the described experiment was conducted. The introduction should describe previous research on the topic that has led to the unanswered questions being addressed by the experiment and should cite important previous papers that form the background for the experiment. The introduction should also ...
Study, experimental, or research design is the backbone of good research. It directs the experiment by orchestrating data collection, defines the statistical analysis of the resultant data, and guides the interpretation of the results. When properly described in the written report of the experiment, it serves as a road map to readers, 1 helping them negotiate the "Methods" section, and ...
The main purpose of a lab report is to demonstrate your understanding of the scientific method by performing and evaluating a hands-on lab experiment. This type of assignment is usually shorter than a research paper.
Sample One-Experiment Paper (continued) emotional detection than young adults, or older adults could show a greater facilitation than. young adults only for the detection of positive information. The results lent some support to the. first two alternatives, but no evidence was found to support the third alternative.
In the results section, concisely present the main findings and observe how they relate to your research questions or hypotheses.
Writing the Experimental Report: Methods, Results, and Discussion. Tables, Appendices, Footnotes and Endnotes. References and Sources for More Information. APA Sample Paper: Experimental Psychology. Style Guide Overview MLA Guide APA Guide Chicago Guide OWL Exercises. Purdue OWL. Subject-Specific Writing.
The results section of a research paper tells the reader what you found, while the discussion section tells the reader what your findings mean. The results section should present the facts in an academic and unbiased manner, avoiding any attempt at analyzing or interpreting the data. Think of the results section as setting the stage for the ...
This paper combines personnel records of the U.S. federal government with census data to study how shocks to the gender composition of a large organization can persistently shift gender norms. Exploiting city-by-department variation in the sudden expansion of female clerical employment driven by ...
A Feature Paper should be a substantial original Article that involves several techniques or approaches, provides an outlook for future research directions and describes possible research applications. Feature papers are submitted upon individual invitation or recommendation by the scientific editors and must receive positive feedback from the ...
Feature papers represent the most advanced research with significant potential for high impact in the field. A Feature Paper should be a substantial original Article that involves several techniques or approaches, provides an outlook for future research directions and describes possible research applications.
Activities listed in section 41(d)(4) are not qualified research. Infra. (1). The Section 174 test. In order to meet the section 174 test, the expenditure must (1) be incurred in connection with the taxpayer's trade or business, and (2) represent a research and development cost in the experimental or laboratory sense.
The ensuing section meticulously chronicles the rigorous experimental and simulation validation processes, shedding light on the model's efficacy and accuracy. Ultimately, the conclusive section encapsulates the key findings and implications, culminating in a profound synthesis of the study's contributions and future research directions.
1 Conference Paper . 1 Contractor Report (CR) center. 18 CDMS . 1 GRC . 1 JSC . 1 KSC . subject Category. 3 General . 2 Administration And Management . 2 Astronomy . 2 Mathematics . 1 Aeronautics (General) keyword. 1 Air Sparge . 1 BLE . 1 BOUNDARY LAYER - EFFECT OF PRESSURE GRADIENT . 1 BOUNDARY LAYER - NOZZLES .
View a PDF of the paper titled Scaling Synthetic Data Creation with 1,000,000,000 Personas, by Xin Chan and 4 other authors ... which may have a profound impact on LLM research and development. ... arXivLabs: experimental projects with community collaborators.