- Privacy Policy
Home » Quantitative Research – Methods, Types and Analysis

Quantitative Research – Methods, Types and Analysis
Table of Contents

Quantitative Research
Quantitative research is a type of research that collects and analyzes numerical data to test hypotheses and answer research questions . This research typically involves a large sample size and uses statistical analysis to make inferences about a population based on the data collected. It often involves the use of surveys, experiments, or other structured data collection methods to gather quantitative data.
Quantitative Research Methods

Quantitative Research Methods are as follows:
Descriptive Research Design
Descriptive research design is used to describe the characteristics of a population or phenomenon being studied. This research method is used to answer the questions of what, where, when, and how. Descriptive research designs use a variety of methods such as observation, case studies, and surveys to collect data. The data is then analyzed using statistical tools to identify patterns and relationships.
Correlational Research Design
Correlational research design is used to investigate the relationship between two or more variables. Researchers use correlational research to determine whether a relationship exists between variables and to what extent they are related. This research method involves collecting data from a sample and analyzing it using statistical tools such as correlation coefficients.
Quasi-experimental Research Design
Quasi-experimental research design is used to investigate cause-and-effect relationships between variables. This research method is similar to experimental research design, but it lacks full control over the independent variable. Researchers use quasi-experimental research designs when it is not feasible or ethical to manipulate the independent variable.
Experimental Research Design
Experimental research design is used to investigate cause-and-effect relationships between variables. This research method involves manipulating the independent variable and observing the effects on the dependent variable. Researchers use experimental research designs to test hypotheses and establish cause-and-effect relationships.
Survey Research
Survey research involves collecting data from a sample of individuals using a standardized questionnaire. This research method is used to gather information on attitudes, beliefs, and behaviors of individuals. Researchers use survey research to collect data quickly and efficiently from a large sample size. Survey research can be conducted through various methods such as online, phone, mail, or in-person interviews.
Quantitative Research Analysis Methods
Here are some commonly used quantitative research analysis methods:
Statistical Analysis
Statistical analysis is the most common quantitative research analysis method. It involves using statistical tools and techniques to analyze the numerical data collected during the research process. Statistical analysis can be used to identify patterns, trends, and relationships between variables, and to test hypotheses and theories.
Regression Analysis
Regression analysis is a statistical technique used to analyze the relationship between one dependent variable and one or more independent variables. Researchers use regression analysis to identify and quantify the impact of independent variables on the dependent variable.
Factor Analysis
Factor analysis is a statistical technique used to identify underlying factors that explain the correlations among a set of variables. Researchers use factor analysis to reduce a large number of variables to a smaller set of factors that capture the most important information.
Structural Equation Modeling
Structural equation modeling is a statistical technique used to test complex relationships between variables. It involves specifying a model that includes both observed and unobserved variables, and then using statistical methods to test the fit of the model to the data.
Time Series Analysis
Time series analysis is a statistical technique used to analyze data that is collected over time. It involves identifying patterns and trends in the data, as well as any seasonal or cyclical variations.
Multilevel Modeling
Multilevel modeling is a statistical technique used to analyze data that is nested within multiple levels. For example, researchers might use multilevel modeling to analyze data that is collected from individuals who are nested within groups, such as students nested within schools.
Applications of Quantitative Research
Quantitative research has many applications across a wide range of fields. Here are some common examples:
- Market Research : Quantitative research is used extensively in market research to understand consumer behavior, preferences, and trends. Researchers use surveys, experiments, and other quantitative methods to collect data that can inform marketing strategies, product development, and pricing decisions.
- Health Research: Quantitative research is used in health research to study the effectiveness of medical treatments, identify risk factors for diseases, and track health outcomes over time. Researchers use statistical methods to analyze data from clinical trials, surveys, and other sources to inform medical practice and policy.
- Social Science Research: Quantitative research is used in social science research to study human behavior, attitudes, and social structures. Researchers use surveys, experiments, and other quantitative methods to collect data that can inform social policies, educational programs, and community interventions.
- Education Research: Quantitative research is used in education research to study the effectiveness of teaching methods, assess student learning outcomes, and identify factors that influence student success. Researchers use experimental and quasi-experimental designs, as well as surveys and other quantitative methods, to collect and analyze data.
- Environmental Research: Quantitative research is used in environmental research to study the impact of human activities on the environment, assess the effectiveness of conservation strategies, and identify ways to reduce environmental risks. Researchers use statistical methods to analyze data from field studies, experiments, and other sources.
Characteristics of Quantitative Research
Here are some key characteristics of quantitative research:
- Numerical data : Quantitative research involves collecting numerical data through standardized methods such as surveys, experiments, and observational studies. This data is analyzed using statistical methods to identify patterns and relationships.
- Large sample size: Quantitative research often involves collecting data from a large sample of individuals or groups in order to increase the reliability and generalizability of the findings.
- Objective approach: Quantitative research aims to be objective and impartial in its approach, focusing on the collection and analysis of data rather than personal beliefs, opinions, or experiences.
- Control over variables: Quantitative research often involves manipulating variables to test hypotheses and establish cause-and-effect relationships. Researchers aim to control for extraneous variables that may impact the results.
- Replicable : Quantitative research aims to be replicable, meaning that other researchers should be able to conduct similar studies and obtain similar results using the same methods.
- Statistical analysis: Quantitative research involves using statistical tools and techniques to analyze the numerical data collected during the research process. Statistical analysis allows researchers to identify patterns, trends, and relationships between variables, and to test hypotheses and theories.
- Generalizability: Quantitative research aims to produce findings that can be generalized to larger populations beyond the specific sample studied. This is achieved through the use of random sampling methods and statistical inference.
Examples of Quantitative Research
Here are some examples of quantitative research in different fields:
- Market Research: A company conducts a survey of 1000 consumers to determine their brand awareness and preferences. The data is analyzed using statistical methods to identify trends and patterns that can inform marketing strategies.
- Health Research : A researcher conducts a randomized controlled trial to test the effectiveness of a new drug for treating a particular medical condition. The study involves collecting data from a large sample of patients and analyzing the results using statistical methods.
- Social Science Research : A sociologist conducts a survey of 500 people to study attitudes toward immigration in a particular country. The data is analyzed using statistical methods to identify factors that influence these attitudes.
- Education Research: A researcher conducts an experiment to compare the effectiveness of two different teaching methods for improving student learning outcomes. The study involves randomly assigning students to different groups and collecting data on their performance on standardized tests.
- Environmental Research : A team of researchers conduct a study to investigate the impact of climate change on the distribution and abundance of a particular species of plant or animal. The study involves collecting data on environmental factors and population sizes over time and analyzing the results using statistical methods.
- Psychology : A researcher conducts a survey of 500 college students to investigate the relationship between social media use and mental health. The data is analyzed using statistical methods to identify correlations and potential causal relationships.
- Political Science: A team of researchers conducts a study to investigate voter behavior during an election. They use survey methods to collect data on voting patterns, demographics, and political attitudes, and analyze the results using statistical methods.
How to Conduct Quantitative Research
Here is a general overview of how to conduct quantitative research:
- Develop a research question: The first step in conducting quantitative research is to develop a clear and specific research question. This question should be based on a gap in existing knowledge, and should be answerable using quantitative methods.
- Develop a research design: Once you have a research question, you will need to develop a research design. This involves deciding on the appropriate methods to collect data, such as surveys, experiments, or observational studies. You will also need to determine the appropriate sample size, data collection instruments, and data analysis techniques.
- Collect data: The next step is to collect data. This may involve administering surveys or questionnaires, conducting experiments, or gathering data from existing sources. It is important to use standardized methods to ensure that the data is reliable and valid.
- Analyze data : Once the data has been collected, it is time to analyze it. This involves using statistical methods to identify patterns, trends, and relationships between variables. Common statistical techniques include correlation analysis, regression analysis, and hypothesis testing.
- Interpret results: After analyzing the data, you will need to interpret the results. This involves identifying the key findings, determining their significance, and drawing conclusions based on the data.
- Communicate findings: Finally, you will need to communicate your findings. This may involve writing a research report, presenting at a conference, or publishing in a peer-reviewed journal. It is important to clearly communicate the research question, methods, results, and conclusions to ensure that others can understand and replicate your research.
When to use Quantitative Research
Here are some situations when quantitative research can be appropriate:
- To test a hypothesis: Quantitative research is often used to test a hypothesis or a theory. It involves collecting numerical data and using statistical analysis to determine if the data supports or refutes the hypothesis.
- To generalize findings: If you want to generalize the findings of your study to a larger population, quantitative research can be useful. This is because it allows you to collect numerical data from a representative sample of the population and use statistical analysis to make inferences about the population as a whole.
- To measure relationships between variables: If you want to measure the relationship between two or more variables, such as the relationship between age and income, or between education level and job satisfaction, quantitative research can be useful. It allows you to collect numerical data on both variables and use statistical analysis to determine the strength and direction of the relationship.
- To identify patterns or trends: Quantitative research can be useful for identifying patterns or trends in data. For example, you can use quantitative research to identify trends in consumer behavior or to identify patterns in stock market data.
- To quantify attitudes or opinions : If you want to measure attitudes or opinions on a particular topic, quantitative research can be useful. It allows you to collect numerical data using surveys or questionnaires and analyze the data using statistical methods to determine the prevalence of certain attitudes or opinions.
Purpose of Quantitative Research
The purpose of quantitative research is to systematically investigate and measure the relationships between variables or phenomena using numerical data and statistical analysis. The main objectives of quantitative research include:
- Description : To provide a detailed and accurate description of a particular phenomenon or population.
- Explanation : To explain the reasons for the occurrence of a particular phenomenon, such as identifying the factors that influence a behavior or attitude.
- Prediction : To predict future trends or behaviors based on past patterns and relationships between variables.
- Control : To identify the best strategies for controlling or influencing a particular outcome or behavior.
Quantitative research is used in many different fields, including social sciences, business, engineering, and health sciences. It can be used to investigate a wide range of phenomena, from human behavior and attitudes to physical and biological processes. The purpose of quantitative research is to provide reliable and valid data that can be used to inform decision-making and improve understanding of the world around us.
Advantages of Quantitative Research
There are several advantages of quantitative research, including:
- Objectivity : Quantitative research is based on objective data and statistical analysis, which reduces the potential for bias or subjectivity in the research process.
- Reproducibility : Because quantitative research involves standardized methods and measurements, it is more likely to be reproducible and reliable.
- Generalizability : Quantitative research allows for generalizations to be made about a population based on a representative sample, which can inform decision-making and policy development.
- Precision : Quantitative research allows for precise measurement and analysis of data, which can provide a more accurate understanding of phenomena and relationships between variables.
- Efficiency : Quantitative research can be conducted relatively quickly and efficiently, especially when compared to qualitative research, which may involve lengthy data collection and analysis.
- Large sample sizes : Quantitative research can accommodate large sample sizes, which can increase the representativeness and generalizability of the results.
Limitations of Quantitative Research
There are several limitations of quantitative research, including:
- Limited understanding of context: Quantitative research typically focuses on numerical data and statistical analysis, which may not provide a comprehensive understanding of the context or underlying factors that influence a phenomenon.
- Simplification of complex phenomena: Quantitative research often involves simplifying complex phenomena into measurable variables, which may not capture the full complexity of the phenomenon being studied.
- Potential for researcher bias: Although quantitative research aims to be objective, there is still the potential for researcher bias in areas such as sampling, data collection, and data analysis.
- Limited ability to explore new ideas: Quantitative research is often based on pre-determined research questions and hypotheses, which may limit the ability to explore new ideas or unexpected findings.
- Limited ability to capture subjective experiences : Quantitative research is typically focused on objective data and may not capture the subjective experiences of individuals or groups being studied.
- Ethical concerns : Quantitative research may raise ethical concerns, such as invasion of privacy or the potential for harm to participants.
About the author

Muhammad Hassan
Researcher, Academic Writer, Web developer
You may also like

Transformative Design – Methods, Types, Guide

Questionnaire – Definition, Types, and Examples

Applied Research – Types, Methods and Examples

Exploratory Research – Types, Methods and...

Qualitative Research Methods

One-to-One Interview – Methods and Guide
Educational resources and simple solutions for your research journey

What is Quantitative Research? Definition, Methods, Types, and Examples

If you’re wondering what is quantitative research and whether this methodology works for your research study, you’re not alone. If you want a simple quantitative research definition , then it’s enough to say that this is a method undertaken by researchers based on their study requirements. However, to select the most appropriate research for their study type, researchers should know all the methods available.
Selecting the right research method depends on a few important criteria, such as the research question, study type, time, costs, data availability, and availability of respondents. There are two main types of research methods— quantitative research and qualitative research. The purpose of quantitative research is to validate or test a theory or hypothesis and that of qualitative research is to understand a subject or event or identify reasons for observed patterns.
Quantitative research methods are used to observe events that affect a particular group of individuals, which is the sample population. In this type of research, diverse numerical data are collected through various methods and then statistically analyzed to aggregate the data, compare them, or show relationships among the data. Quantitative research methods broadly include questionnaires, structured observations, and experiments.
Here are two quantitative research examples:
- Satisfaction surveys sent out by a company regarding their revamped customer service initiatives. Customers are asked to rate their experience on a rating scale of 1 (poor) to 5 (excellent).
- A school has introduced a new after-school program for children, and a few months after commencement, the school sends out feedback questionnaires to the parents of the enrolled children. Such questionnaires usually include close-ended questions that require either definite answers or a Yes/No option. This helps in a quick, overall assessment of the program’s outreach and success.

Table of Contents
What is quantitative research ? 1,2

The steps shown in the figure can be grouped into the following broad steps:
- Theory : Define the problem area or area of interest and create a research question.
- Hypothesis : Develop a hypothesis based on the research question. This hypothesis will be tested in the remaining steps.
- Research design : In this step, the most appropriate quantitative research design will be selected, including deciding on the sample size, selecting respondents, identifying research sites, if any, etc.
- Data collection : This process could be extensive based on your research objective and sample size.
- Data analysis : Statistical analysis is used to analyze the data collected. The results from the analysis help in either supporting or rejecting your hypothesis.
- Present results : Based on the data analysis, conclusions are drawn, and results are presented as accurately as possible.
Quantitative research characteristics 4
- Large sample size : This ensures reliability because this sample represents the target population or market. Due to the large sample size, the outcomes can be generalized to the entire population as well, making this one of the important characteristics of quantitative research .
- Structured data and measurable variables: The data are numeric and can be analyzed easily. Quantitative research involves the use of measurable variables such as age, salary range, highest education, etc.
- Easy-to-use data collection methods : The methods include experiments, controlled observations, and questionnaires and surveys with a rating scale or close-ended questions, which require simple and to-the-point answers; are not bound by geographical regions; and are easy to administer.
- Data analysis : Structured and accurate statistical analysis methods using software applications such as Excel, SPSS, R. The analysis is fast, accurate, and less effort intensive.
- Reliable : The respondents answer close-ended questions, their responses are direct without ambiguity and yield numeric outcomes, which are therefore highly reliable.
- Reusable outcomes : This is one of the key characteristics – outcomes of one research can be used and replicated in other research as well and is not exclusive to only one study.
Quantitative research methods 5
Quantitative research methods are classified into two types—primary and secondary.
Primary quantitative research method:
In this type of quantitative research , data are directly collected by the researchers using the following methods.
– Survey research : Surveys are the easiest and most commonly used quantitative research method . They are of two types— cross-sectional and longitudinal.
->Cross-sectional surveys are specifically conducted on a target population for a specified period, that is, these surveys have a specific starting and ending time and researchers study the events during this period to arrive at conclusions. The main purpose of these surveys is to describe and assess the characteristics of a population. There is one independent variable in this study, which is a common factor applicable to all participants in the population, for example, living in a specific city, diagnosed with a specific disease, of a certain age group, etc. An example of a cross-sectional survey is a study to understand why individuals residing in houses built before 1979 in the US are more susceptible to lead contamination.
->Longitudinal surveys are conducted at different time durations. These surveys involve observing the interactions among different variables in the target population, exposing them to various causal factors, and understanding their effects across a longer period. These studies are helpful to analyze a problem in the long term. An example of a longitudinal study is the study of the relationship between smoking and lung cancer over a long period.
– Descriptive research : Explains the current status of an identified and measurable variable. Unlike other types of quantitative research , a hypothesis is not needed at the beginning of the study and can be developed even after data collection. This type of quantitative research describes the characteristics of a problem and answers the what, when, where of a problem. However, it doesn’t answer the why of the problem and doesn’t explore cause-and-effect relationships between variables. Data from this research could be used as preliminary data for another study. Example: A researcher undertakes a study to examine the growth strategy of a company. This sample data can be used by other companies to determine their own growth strategy.

– Correlational research : This quantitative research method is used to establish a relationship between two variables using statistical analysis and analyze how one affects the other. The research is non-experimental because the researcher doesn’t control or manipulate any of the variables. At least two separate sample groups are needed for this research. Example: Researchers studying a correlation between regular exercise and diabetes.
– Causal-comparative research : This type of quantitative research examines the cause-effect relationships in retrospect between a dependent and independent variable and determines the causes of the already existing differences between groups of people. This is not a true experiment because it doesn’t assign participants to groups randomly. Example: To study the wage differences between men and women in the same role. For this, already existing wage information is analyzed to understand the relationship.
– Experimental research : This quantitative research method uses true experiments or scientific methods for determining a cause-effect relation between variables. It involves testing a hypothesis through experiments, in which one or more independent variables are manipulated and then their effect on dependent variables are studied. Example: A researcher studies the importance of a drug in treating a disease by administering the drug in few patients and not administering in a few.
The following data collection methods are commonly used in primary quantitative research :
- Sampling : The most common type is probability sampling, in which a sample is chosen from a larger population using some form of random selection, that is, every member of the population has an equal chance of being selected. The different types of probability sampling are—simple random, systematic, stratified, and cluster sampling.
- Interviews : These are commonly telephonic or face-to-face.
- Observations : Structured observations are most commonly used in quantitative research . In this method, researchers make observations about specific behaviors of individuals in a structured setting.
- Document review : Reviewing existing research or documents to collect evidence for supporting the quantitative research .
- Surveys and questionnaires : Surveys can be administered both online and offline depending on the requirement and sample size.
The data collected can be analyzed in several ways in quantitative research , as listed below:
- Cross-tabulation —Uses a tabular format to draw inferences among collected data
- MaxDiff analysis —Gauges the preferences of the respondents
- TURF analysis —Total Unduplicated Reach and Frequency Analysis; helps in determining the market strategy for a business
- Gap analysis —Identify gaps in attaining the desired results
- SWOT analysis —Helps identify strengths, weaknesses, opportunities, and threats of a product, service, or organization
- Text analysis —Used for interpreting unstructured data
Secondary quantitative research methods :
This method involves conducting research using already existing or secondary data. This method is less effort intensive and requires lesser time. However, researchers should verify the authenticity and recency of the sources being used and ensure their accuracy.
The main sources of secondary data are:
- The Internet
- Government and non-government sources
- Public libraries
- Educational institutions
- Commercial information sources such as newspapers, journals, radio, TV

When to use quantitative research 6
Here are some simple ways to decide when to use quantitative research . Use quantitative research to:
- recommend a final course of action
- find whether a consensus exists regarding a particular subject
- generalize results to a larger population
- determine a cause-and-effect relationship between variables
- describe characteristics of specific groups of people
- test hypotheses and examine specific relationships
- identify and establish size of market segments
A research case study to understand when to use quantitative research 7
Context: A study was undertaken to evaluate a major innovation in a hospital’s design, in terms of workforce implications and impact on patient and staff experiences of all single-room hospital accommodations. The researchers undertook a mixed methods approach to answer their research questions. Here, we focus on the quantitative research aspect.
Research questions : What are the advantages and disadvantages for the staff as a result of the hospital’s move to the new design with all single-room accommodations? Did the move affect staff experience and well-being and improve their ability to deliver high-quality care?
Method: The researchers obtained quantitative data from three sources:
- Staff activity (task time distribution): Each staff member was shadowed by a researcher who observed each task undertaken by the staff, and logged the time spent on each activity.
- Staff travel distances : The staff were requested to wear pedometers, which recorded the distances covered.
- Staff experience surveys : Staff were surveyed before and after the move to the new hospital design.
Results of quantitative research : The following observations were made based on quantitative data analysis:
- The move to the new design did not result in a significant change in the proportion of time spent on different activities.
- Staff activity events observed per session were higher after the move, and direct care and professional communication events per hour decreased significantly, suggesting fewer interruptions and less fragmented care.
- A significant increase in medication tasks among the recorded events suggests that medication administration was integrated into patient care activities.
- Travel distances increased for all staff, with highest increases for staff in the older people’s ward and surgical wards.
- Ratings for staff toilet facilities, locker facilities, and space at staff bases were higher but those for social interaction and natural light were lower.
Advantages of quantitative research 1,2
When choosing the right research methodology, also consider the advantages of quantitative research and how it can impact your study.
- Quantitative research methods are more scientific and rational. They use quantifiable data leading to objectivity in the results and avoid any chances of ambiguity.
- This type of research uses numeric data so analysis is relatively easier .
- In most cases, a hypothesis is already developed and quantitative research helps in testing and validatin g these constructed theories based on which researchers can make an informed decision about accepting or rejecting their theory.
- The use of statistical analysis software ensures quick analysis of large volumes of data and is less effort intensive.
- Higher levels of control can be applied to the research so the chances of bias can be reduced.
- Quantitative research is based on measured value s, facts, and verifiable information so it can be easily checked or replicated by other researchers leading to continuity in scientific research.
Disadvantages of quantitative research 1,2
Quantitative research may also be limiting; take a look at the disadvantages of quantitative research.
- Experiments are conducted in controlled settings instead of natural settings and it is possible for researchers to either intentionally or unintentionally manipulate the experiment settings to suit the results they desire.
- Participants must necessarily give objective answers (either one- or two-word, or yes or no answers) and the reasons for their selection or the context are not considered.
- Inadequate knowledge of statistical analysis methods may affect the results and their interpretation.
- Although statistical analysis indicates the trends or patterns among variables, the reasons for these observed patterns cannot be interpreted and the research may not give a complete picture.
- Large sample sizes are needed for more accurate and generalizable analysis .
- Quantitative research cannot be used to address complex issues.

Frequently asked questions on quantitative research
Q: What is the difference between quantitative research and qualitative research? 1
A: The following table lists the key differences between quantitative research and qualitative research, some of which may have been mentioned earlier in the article.
| Purpose and design | ||
| Research question | ||
| Sample size | Large | Small |
| Data | ||
| Data collection method | Experiments, controlled observations, questionnaires and surveys with a rating scale or close-ended questions. The methods can be experimental, quasi-experimental, descriptive, or correlational. | Semi-structured interviews/surveys with open-ended questions, document study/literature reviews, focus groups, case study research, ethnography |
| Data analysis |
Q: What is the difference between reliability and validity? 8,9
A: The term reliability refers to the consistency of a research study. For instance, if a food-measuring weighing scale gives different readings every time the same quantity of food is measured then that weighing scale is not reliable. If the findings in a research study are consistent every time a measurement is made, then the study is considered reliable. However, it is usually unlikely to obtain the exact same results every time because some contributing variables may change. In such cases, a correlation coefficient is used to assess the degree of reliability. A strong positive correlation between the results indicates reliability.
Validity can be defined as the degree to which a tool actually measures what it claims to measure. It helps confirm the credibility of your research and suggests that the results may be generalizable. In other words, it measures the accuracy of the research.
The following table gives the key differences between reliability and validity.
| Importance | Refers to the consistency of a measure | Refers to the accuracy of a measure |
| Ease of achieving | Easier, yields results faster | Involves more analysis, more difficult to achieve |
| Assessment method | By examining the consistency of outcomes over time, between various observers, and within the test | By comparing the accuracy of the results with accepted theories and other measurements of the same idea |
| Relationship | Unreliable measurements typically cannot be valid | Valid measurements are also reliable |
| Types | Test-retest reliability, internal consistency, inter-rater reliability | Content validity, criterion validity, face validity, construct validity |
Q: What is mixed methods research? 10

A: A mixed methods approach combines the characteristics of both quantitative research and qualitative research in the same study. This method allows researchers to validate their findings, verify if the results observed using both methods are complementary, and explain any unexpected results obtained from one method by using the other method. A mixed methods research design is useful in case of research questions that cannot be answered by either quantitative research or qualitative research alone. However, this method could be more effort- and cost-intensive because of the requirement of more resources. The figure 3 shows some basic mixed methods research designs that could be used.
Thus, quantitative research is the appropriate method for testing your hypotheses and can be used either alone or in combination with qualitative research per your study requirements. We hope this article has provided an insight into the various facets of quantitative research , including its different characteristics, advantages, and disadvantages, and a few tips to quickly understand when to use this research method.
References
- Qualitative vs quantitative research: Differences, examples, & methods. Simply Psychology. Accessed Feb 28, 2023. https://simplypsychology.org/qualitative-quantitative.html#Quantitative-Research
- Your ultimate guide to quantitative research. Qualtrics. Accessed February 28, 2023. https://www.qualtrics.com/uk/experience-management/research/quantitative-research/
- The steps of quantitative research. Revise Sociology. Accessed March 1, 2023. https://revisesociology.com/2017/11/26/the-steps-of-quantitative-research/
- What are the characteristics of quantitative research? Marketing91. Accessed March 1, 2023. https://www.marketing91.com/characteristics-of-quantitative-research/
- Quantitative research: Types, characteristics, methods, & examples. ProProfs Survey Maker. Accessed February 28, 2023. https://www.proprofssurvey.com/blog/quantitative-research/#Characteristics_of_Quantitative_Research
- Qualitative research isn’t as scientific as quantitative methods. Kmusial blog. Accessed March 5, 2023. https://kmusial.wordpress.com/2011/11/25/qualitative-research-isnt-as-scientific-as-quantitative-methods/
- Maben J, Griffiths P, Penfold C, et al. Evaluating a major innovation in hospital design: workforce implications and impact on patient and staff experiences of all single room hospital accommodation. Southampton (UK): NIHR Journals Library; 2015 Feb. (Health Services and Delivery Research, No. 3.3.) Chapter 5, Case study quantitative data findings. Accessed March 6, 2023. https://www.ncbi.nlm.nih.gov/books/NBK274429/
- McLeod, S. A. (2007). What is reliability? Simply Psychology. www.simplypsychology.org/reliability.html
- Reliability vs validity: Differences & examples. Accessed March 5, 2023. https://statisticsbyjim.com/basics/reliability-vs-validity/
- Mixed methods research. Community Engagement Program. Harvard Catalyst. Accessed February 28, 2023. https://catalyst.harvard.edu/community-engagement/mmr
Editage All Access is a subscription-based platform that unifies the best AI tools and services designed to speed up, simplify, and streamline every step of a researcher’s journey. The Editage All Access Pack is a one-of-a-kind subscription that unlocks full access to an AI writing assistant, literature recommender, journal finder, scientific illustration tool, and exclusive discounts on professional publication services from Editage.
Based on 22+ years of experience in academia, Editage All Access empowers researchers to put their best research forward and move closer to success. Explore our top AI Tools pack, AI Tools + Publication Services pack, or Build Your Own Plan. Find everything a researcher needs to succeed, all in one place – Get All Access now starting at just $14 a month !
Related Posts

How to Make a Graphical Abstract for Your Research Paper (with Examples)

Leveraging AI in Research: Kick-Start Your Academic Year with Editage All Access
Research Methodologies
Quantitative research methodologies.
- Qualitative Research Methodologies
- Systematic Reviews
- Finding Articles by Methodology
- Design Your Research Project
Library Help
What is quantitative research.
Quantitative methodologies use statistics to analyze numerical data gathered by researchers to answer their research questions. Quantitative methods can be used to answer questions such as:
- What are the relationships between two or more variables?
- What factors are at play in an environment that might affect the behavior or development of the organisms in that environment?
Quantitative methods can also be used to test hypotheses by conducting quasi-experimental studies or designing experiments.
Independent and Dependent Variables
In quantitative research, a variable is something (an intervention technique, a pharmaceutical, a temperature, etc.) that changes. There are two kinds of variables: independent variables and dependent variables . In the simplest terms, the independent variable is whatever the researchers are using to attempt to make a change in their dependent variable.
| Independent Variable(s) | Dependent Variable |
|---|---|
| A new cancer-treating drug being tested in different dosage strengths | The number of detectable cancer cells in a patient or cell sample |
| Different genres of music* | Plant growth within a specific time frame |
* This is a real, repeatable experiment you can try on your plants.
Correlational
Researchers will compare two sets of numbers to try and identify a relationship (if any) between two things.
- Köse S., & Murat, M. (2021). Examination of the relationship between smartphone addiction and cyberchondria in adolescents. Archives of Psychiatric Nursing, 35(6): 563-570.
- Pilger et al. (2021). Spiritual well-being, religious/spiritual coping and quality of life among the elderly undergoing hemodialysis: a correlational study. Journal of Religion, Spirituality & Aging, 33(1): 2-15.
Descriptive
Researchers will attempt to quantify a variety of factors at play as they study a particular type of phenomenon or action. For example, researchers might use a descriptive methodology to understand the effects of climate change on the life cycle of a plant or animal.
- Lakshmi, E. (2021). Food consumption pattern and body mass index of adolescents: A descriptive study. International Journal of Nutrition, Pharmacology, Neurological Diseases, 11(4), 293–297.
- Lin, J., Singh, S., Sha, L., Tan, W., Lang, D., Gašević, D., & Chen, G. (2022). Is it a good move? Mining effective tutoring strategies from human–human tutorial dialogues. Future Generation Computer Systems, 127, 194–207.
Experimental
To understand the effects of a variable, researchers will design an experiment where they can control as many factors as possible. This can involve creating control and experimental groups. The experimental group will be exposed to the variable to study its effects. The control group provides data about what happens when the variable is absent. For example, in a study about online teaching, the control group might receive traditional face-to-face instruction while the experimental group would receive their instruction virtually.
- Jinzhang Jia, Yinuo Chen, Guangbo Che, Jinchao Zhu, Fengxiao Wang, & Peng Jia. (2021). Experimental study on the explosion characteristics of hydrogen-methane premixed gas in complex pipe networks. Scientific Reports, 11(1), 1–11.
- Sasaki, R. et al. (2021). Effects of cryotherapy applied at different temperatures on inflammatory pain during the acute phase of arthritis in rats. Physical Therapy, 101(2), 1–9.
Quasi-Experimental/Quasi-Comparative
Researchers will attempt to determine what (if any) effect a variable can have. These studies may have multiple independent variables (causes) and multiple dependent variables (effects), but this can complicate researchers' efforts to find out if A can cause B or if X, Y, and Z are also playing a role.
- Jafari, A., Alami, A., Charoghchian, E., Delshad Noghabi, A., & Nejatian, M. (2021). The impact of effective communication skills training on the status of marital burnout among married women. BMC Women’s Health, 21(1), 1-10.
- Phillips, S. W., Kim, D.-Y., Sobol, J. J., & Gayadeen, S. M. (2021). Total recall?: A quasi-experimental study of officer’s recollection in shoot - don’t shoot simulators. Police Practice and Research, 22(3), 1229–1240.
Surveys can be considered a quantitative methodology if the researchers require their respondents to choose from pre-determined responses.
- Harries et al. (2021). Effects of the COVID-19 pandemic on medical students: A multicenter quantitative study. BMC Medical Education, 21(14), 1-8.
- Call : 801.863.8840
- Text : 801.290.8123
- In-Person Help
- Email a Librarian
- Make an Appointment
- << Previous: Home
- Next: Qualitative Research Methodologies >>
- Last Updated: Jun 20, 2024 3:16 PM
- URL: https://uvu.libguides.com/methods
Service update: Some parts of the Library’s website will be down for maintenance on July 7.
Secondary menu
- Log in to your Library account
- Hours and Maps
- Connect from Off Campus
- UC Berkeley Home
Search form
Research methods--quantitative, qualitative, and more: overview.
- Quantitative Research
- Qualitative Research
- Data Science Methods (Machine Learning, AI, Big Data)
- Text Mining and Computational Text Analysis
- Evidence Synthesis/Systematic Reviews
- Get Data, Get Help!
About Research Methods
This guide provides an overview of research methods, how to choose and use them, and supports and resources at UC Berkeley.
As Patten and Newhart note in the book Understanding Research Methods , "Research methods are the building blocks of the scientific enterprise. They are the "how" for building systematic knowledge. The accumulation of knowledge through research is by its nature a collective endeavor. Each well-designed study provides evidence that may support, amend, refute, or deepen the understanding of existing knowledge...Decisions are important throughout the practice of research and are designed to help researchers collect evidence that includes the full spectrum of the phenomenon under study, to maintain logical rules, and to mitigate or account for possible sources of bias. In many ways, learning research methods is learning how to see and make these decisions."
The choice of methods varies by discipline, by the kind of phenomenon being studied and the data being used to study it, by the technology available, and more. This guide is an introduction, but if you don't see what you need here, always contact your subject librarian, and/or take a look to see if there's a library research guide that will answer your question.
Suggestions for changes and additions to this guide are welcome!
START HERE: SAGE Research Methods
Without question, the most comprehensive resource available from the library is SAGE Research Methods. HERE IS THE ONLINE GUIDE to this one-stop shopping collection, and some helpful links are below:
- SAGE Research Methods
- Little Green Books (Quantitative Methods)
- Little Blue Books (Qualitative Methods)
- Dictionaries and Encyclopedias
- Case studies of real research projects
- Sample datasets for hands-on practice
- Streaming video--see methods come to life
- Methodspace- -a community for researchers
- SAGE Research Methods Course Mapping
Library Data Services at UC Berkeley
Library Data Services Program and Digital Scholarship Services
The LDSP offers a variety of services and tools ! From this link, check out pages for each of the following topics: discovering data, managing data, collecting data, GIS data, text data mining, publishing data, digital scholarship, open science, and the Research Data Management Program.
Be sure also to check out the visual guide to where to seek assistance on campus with any research question you may have!
Library GIS Services
Other Data Services at Berkeley
D-Lab Supports Berkeley faculty, staff, and graduate students with research in data intensive social science, including a wide range of training and workshop offerings Dryad Dryad is a simple self-service tool for researchers to use in publishing their datasets. It provides tools for the effective publication of and access to research data. Geospatial Innovation Facility (GIF) Provides leadership and training across a broad array of integrated mapping technologies on campu Research Data Management A UC Berkeley guide and consulting service for research data management issues
General Research Methods Resources
Here are some general resources for assistance:
- Assistance from ICPSR (must create an account to access): Getting Help with Data , and Resources for Students
- Wiley Stats Ref for background information on statistics topics
- Survey Documentation and Analysis (SDA) . Program for easy web-based analysis of survey data.
Consultants
- D-Lab/Data Science Discovery Consultants Request help with your research project from peer consultants.
- Research data (RDM) consulting Meet with RDM consultants before designing the data security, storage, and sharing aspects of your qualitative project.
- Statistics Department Consulting Services A service in which advanced graduate students, under faculty supervision, are available to consult during specified hours in the Fall and Spring semesters.
Related Resourcex
- IRB / CPHS Qualitative research projects with human subjects often require that you go through an ethics review.
- OURS (Office of Undergraduate Research and Scholarships) OURS supports undergraduates who want to embark on research projects and assistantships. In particular, check out their "Getting Started in Research" workshops
- Sponsored Projects Sponsored projects works with researchers applying for major external grants.
- Next: Quantitative Research >>
- Last Updated: Apr 25, 2024 11:09 AM
- URL: https://guides.lib.berkeley.edu/researchmethods
Research Methods and Design
- Action Research
- Case Study Design
- Literature Review
- Quantitative Research Methods
- Qualitative Research Methods
- Mixed Methods Study
- Indigenous Research and Ethics This link opens in a new window
- Identifying Empirical Research Articles This link opens in a new window
- Research Ethics and Quality
- Data Literacy
- Get Help with Writing Assignments
Quantitative research methods
a method of research that relies on measuring variables using a numerical system, analyzing these measurements using any of a variety of statistical models, and reporting relationships and associations among the studied variables. For example, these variables may be test scores or measurements of reaction time. The goal of gathering this quantitative data is to understand, describe, and predict the nature of a phenomenon, particularly through the development of models and theories. Quantitative research techniques include experiments and surveys.
SAGE Research Methods Videos
What are the strengths of quantitative research.
Professor Norma T. Mertz briefly discusses qualitative research and how it has changed since she entered the field. She emphasizes the importance of defining a research question before choosing a theoretical approach to research.
This is just one segment in a series about quantitative methods. You can find additional videos in our SAGE database, Research Methods:
Videos covering research methods and statistics
Further Reading

- << Previous: Literature Review
- Next: Qualitative Research Methods >>
- Last Updated: May 7, 2024 9:51 AM
CityU Home - CityU Catalog

Have a language expert improve your writing
Run a free plagiarism check in 10 minutes, automatically generate references for free.
- Knowledge Base
- Methodology
- What Is Quantitative Research? | Definition & Methods
What Is Quantitative Research? | Definition & Methods
Published on 4 April 2022 by Pritha Bhandari . Revised on 10 October 2022.
Quantitative research is the process of collecting and analysing numerical data. It can be used to find patterns and averages, make predictions, test causal relationships, and generalise results to wider populations.
Quantitative research is the opposite of qualitative research , which involves collecting and analysing non-numerical data (e.g. text, video, or audio).
Quantitative research is widely used in the natural and social sciences: biology, chemistry, psychology, economics, sociology, marketing, etc.
- What is the demographic makeup of Singapore in 2020?
- How has the average temperature changed globally over the last century?
- Does environmental pollution affect the prevalence of honey bees?
- Does working from home increase productivity for people with long commutes?
Table of contents
Quantitative research methods, quantitative data analysis, advantages of quantitative research, disadvantages of quantitative research, frequently asked questions about quantitative research.
You can use quantitative research methods for descriptive, correlational or experimental research.
- In descriptive research , you simply seek an overall summary of your study variables.
- In correlational research , you investigate relationships between your study variables.
- In experimental research , you systematically examine whether there is a cause-and-effect relationship between variables.
Correlational and experimental research can both be used to formally test hypotheses , or predictions, using statistics. The results may be generalised to broader populations based on the sampling method used.
To collect quantitative data, you will often need to use operational definitions that translate abstract concepts (e.g., mood) into observable and quantifiable measures (e.g., self-ratings of feelings and energy levels).
| Research method | How to use | Example |
|---|---|---|
| Control or manipulate an to measure its effect on a dependent variable. | To test whether an intervention can reduce procrastination in college students, you give equal-sized groups either a procrastination intervention or a comparable task. You compare self-ratings of procrastination behaviors between the groups after the intervention. | |
| Ask questions of a group of people in-person, over-the-phone or online. | You distribute with rating scales to first-year international college students to investigate their experiences of culture shock. | |
| (Systematic) observation | Identify a behavior or occurrence of interest and monitor it in its natural setting. | To study college classroom participation, you sit in on classes to observe them, counting and recording the prevalence of active and passive behaviors by students from different backgrounds. |
| Secondary research | Collect data that has been gathered for other purposes e.g., national surveys or historical records. | To assess whether attitudes towards climate change have changed since the 1980s, you collect relevant questionnaire data from widely available . |
Prevent plagiarism, run a free check.
Once data is collected, you may need to process it before it can be analysed. For example, survey and test data may need to be transformed from words to numbers. Then, you can use statistical analysis to answer your research questions .
Descriptive statistics will give you a summary of your data and include measures of averages and variability. You can also use graphs, scatter plots and frequency tables to visualise your data and check for any trends or outliers.
Using inferential statistics , you can make predictions or generalisations based on your data. You can test your hypothesis or use your sample data to estimate the population parameter .
You can also assess the reliability and validity of your data collection methods to indicate how consistently and accurately your methods actually measured what you wanted them to.
Quantitative research is often used to standardise data collection and generalise findings . Strengths of this approach include:
- Replication
Repeating the study is possible because of standardised data collection protocols and tangible definitions of abstract concepts.
- Direct comparisons of results
The study can be reproduced in other cultural settings, times or with different groups of participants. Results can be compared statistically.
- Large samples
Data from large samples can be processed and analysed using reliable and consistent procedures through quantitative data analysis.
- Hypothesis testing
Using formalised and established hypothesis testing procedures means that you have to carefully consider and report your research variables, predictions, data collection and testing methods before coming to a conclusion.
Despite the benefits of quantitative research, it is sometimes inadequate in explaining complex research topics. Its limitations include:
- Superficiality
Using precise and restrictive operational definitions may inadequately represent complex concepts. For example, the concept of mood may be represented with just a number in quantitative research, but explained with elaboration in qualitative research.
- Narrow focus
Predetermined variables and measurement procedures can mean that you ignore other relevant observations.
- Structural bias
Despite standardised procedures, structural biases can still affect quantitative research. Missing data , imprecise measurements or inappropriate sampling methods are biases that can lead to the wrong conclusions.
- Lack of context
Quantitative research often uses unnatural settings like laboratories or fails to consider historical and cultural contexts that may affect data collection and results.
Quantitative research deals with numbers and statistics, while qualitative research deals with words and meanings.
Quantitative methods allow you to test a hypothesis by systematically collecting and analysing data, while qualitative methods allow you to explore ideas and experiences in depth.
In mixed methods research , you use both qualitative and quantitative data collection and analysis methods to answer your research question .
Data collection is the systematic process by which observations or measurements are gathered in research. It is used in many different contexts by academics, governments, businesses, and other organisations.
Operationalisation means turning abstract conceptual ideas into measurable observations.
For example, the concept of social anxiety isn’t directly observable, but it can be operationally defined in terms of self-rating scores, behavioural avoidance of crowded places, or physical anxiety symptoms in social situations.
Before collecting data , it’s important to consider how you will operationalise the variables that you want to measure.
Reliability and validity are both about how well a method measures something:
- Reliability refers to the consistency of a measure (whether the results can be reproduced under the same conditions).
- Validity refers to the accuracy of a measure (whether the results really do represent what they are supposed to measure).
If you are doing experimental research , you also have to consider the internal and external validity of your experiment.
Hypothesis testing is a formal procedure for investigating our ideas about the world using statistics. It is used by scientists to test specific predictions, called hypotheses , by calculating how likely it is that a pattern or relationship between variables could have arisen by chance.
Cite this Scribbr article
If you want to cite this source, you can copy and paste the citation or click the ‘Cite this Scribbr article’ button to automatically add the citation to our free Reference Generator.
Bhandari, P. (2022, October 10). What Is Quantitative Research? | Definition & Methods. Scribbr. Retrieved 8 July 2024, from https://www.scribbr.co.uk/research-methods/introduction-to-quantitative-research/
Is this article helpful?

Pritha Bhandari
Quantitative Methods
- Living reference work entry
- First Online: 11 June 2021
- Cite this living reference work entry

- Juwel Rana 2 , 3 , 4 ,
- Patricia Luna Gutierrez 5 &
- John C. Oldroyd 6
502 Accesses
Quantitative analysis ; Quantitative research methods ; Study design
Quantitative method is the collection and analysis of numerical data to answer scientific research questions. Quantitative method is used to summarize, average, find patterns, make predictions, and test causal associations as well as generalizing results to wider populations. It allows us to quantify effect sizes, determine the strength of associations, rank priorities, and weigh the strength of evidence of effectiveness.
Introduction
This entry aims to introduce the most common ways to use numbers and statistics to describe variables, establish relationships among variables, and build numerical understanding of a topic. In general, the quantitative research process uses a deductive approach (Neuman 2014 ; Leavy 2017 ), extrapolating from a particular case to the general situation (Babones 2016 ).
In practical ways, quantitative methods are an approach to studying a research topic. In research, the...
This is a preview of subscription content, log in via an institution to check access.
Access this chapter
Institutional subscriptions
Babones S (2016) Interpretive quantitative methods for the social sciences. Sociology. https://doi.org/10.1177/0038038515583637
Balnaves M, Caputi P (2001) Introduction to quantitative research methods: an investigative approach. Sage, London
Book Google Scholar
Brenner PS (2020) Understanding survey methodology: sociological theory and applications. Springer, Boston
Google Scholar
Creswell JW (2014) Research design: qualitative, quantitative, and mixed methods approaches. Sage, London
Leavy P (2017) Research design. The Gilford Press, New York
Mertens W, Pugliese A, Recker J (2018) Quantitative data analysis, research methods: information, systems, and contexts: second edition. https://doi.org/10.1016/B978-0-08-102220-7.00018-2
Neuman LW (2014) Social research methods: qualitative and quantitative approaches. Pearson Education Limited, Edinburgh
Treiman DJ (2009) Quantitative data analysis: doing social research to test ideas. Jossey-Bass, San Francisco
Download references
Author information
Authors and affiliations.
Department of Public Health, School of Health and Life Sciences, North South University, Dhaka, Bangladesh
Department of Biostatistics and Epidemiology, School of Health and Health Sciences, University of Massachusetts Amherst, MA, USA
Department of Research and Innovation, South Asia Institute for Social Transformation (SAIST), Dhaka, Bangladesh
Independent Researcher, Masatepe, Nicaragua
Patricia Luna Gutierrez
School of Behavioral and Health Sciences, Australian Catholic University, Fitzroy, VIC, Australia
John C. Oldroyd
You can also search for this author in PubMed Google Scholar
Corresponding author
Correspondence to Juwel Rana .
Editor information
Editors and affiliations.
Florida Atlantic University, Boca Raton, FL, USA
Ali Farazmand
Rights and permissions
Reprints and permissions
Copyright information
© 2021 Springer Nature Switzerland AG
About this entry
Cite this entry.
Rana, J., Gutierrez, P.L., Oldroyd, J.C. (2021). Quantitative Methods. In: Farazmand, A. (eds) Global Encyclopedia of Public Administration, Public Policy, and Governance. Springer, Cham. https://doi.org/10.1007/978-3-319-31816-5_460-1
Download citation
DOI : https://doi.org/10.1007/978-3-319-31816-5_460-1
Received : 31 January 2021
Accepted : 14 February 2021
Published : 11 June 2021
Publisher Name : Springer, Cham
Print ISBN : 978-3-319-31816-5
Online ISBN : 978-3-319-31816-5
eBook Packages : Springer Reference Economics and Finance Reference Module Humanities and Social Sciences Reference Module Business, Economics and Social Sciences
- Publish with us
Policies and ethics
- Find a journal
- Track your research
Qualitative vs Quantitative Research Methods & Data Analysis
Saul Mcleod, PhD
Editor-in-Chief for Simply Psychology
BSc (Hons) Psychology, MRes, PhD, University of Manchester
Saul Mcleod, PhD., is a qualified psychology teacher with over 18 years of experience in further and higher education. He has been published in peer-reviewed journals, including the Journal of Clinical Psychology.
Learn about our Editorial Process
Olivia Guy-Evans, MSc
Associate Editor for Simply Psychology
BSc (Hons) Psychology, MSc Psychology of Education
Olivia Guy-Evans is a writer and associate editor for Simply Psychology. She has previously worked in healthcare and educational sectors.
On This Page:
What is the difference between quantitative and qualitative?
The main difference between quantitative and qualitative research is the type of data they collect and analyze.
Quantitative research collects numerical data and analyzes it using statistical methods. The aim is to produce objective, empirical data that can be measured and expressed in numerical terms. Quantitative research is often used to test hypotheses, identify patterns, and make predictions.
Qualitative research , on the other hand, collects non-numerical data such as words, images, and sounds. The focus is on exploring subjective experiences, opinions, and attitudes, often through observation and interviews.
Qualitative research aims to produce rich and detailed descriptions of the phenomenon being studied, and to uncover new insights and meanings.
Quantitative data is information about quantities, and therefore numbers, and qualitative data is descriptive, and regards phenomenon which can be observed but not measured, such as language.
What Is Qualitative Research?
Qualitative research is the process of collecting, analyzing, and interpreting non-numerical data, such as language. Qualitative research can be used to understand how an individual subjectively perceives and gives meaning to their social reality.
Qualitative data is non-numerical data, such as text, video, photographs, or audio recordings. This type of data can be collected using diary accounts or in-depth interviews and analyzed using grounded theory or thematic analysis.
Qualitative research is multimethod in focus, involving an interpretive, naturalistic approach to its subject matter. This means that qualitative researchers study things in their natural settings, attempting to make sense of, or interpret, phenomena in terms of the meanings people bring to them. Denzin and Lincoln (1994, p. 2)
Interest in qualitative data came about as the result of the dissatisfaction of some psychologists (e.g., Carl Rogers) with the scientific study of psychologists such as behaviorists (e.g., Skinner ).
Since psychologists study people, the traditional approach to science is not seen as an appropriate way of carrying out research since it fails to capture the totality of human experience and the essence of being human. Exploring participants’ experiences is known as a phenomenological approach (re: Humanism ).
Qualitative research is primarily concerned with meaning, subjectivity, and lived experience. The goal is to understand the quality and texture of people’s experiences, how they make sense of them, and the implications for their lives.
Qualitative research aims to understand the social reality of individuals, groups, and cultures as nearly as possible as participants feel or live it. Thus, people and groups are studied in their natural setting.
Some examples of qualitative research questions are provided, such as what an experience feels like, how people talk about something, how they make sense of an experience, and how events unfold for people.
Research following a qualitative approach is exploratory and seeks to explain ‘how’ and ‘why’ a particular phenomenon, or behavior, operates as it does in a particular context. It can be used to generate hypotheses and theories from the data.
Qualitative Methods
There are different types of qualitative research methods, including diary accounts, in-depth interviews , documents, focus groups , case study research , and ethnography.
The results of qualitative methods provide a deep understanding of how people perceive their social realities and in consequence, how they act within the social world.
The researcher has several methods for collecting empirical materials, ranging from the interview to direct observation, to the analysis of artifacts, documents, and cultural records, to the use of visual materials or personal experience. Denzin and Lincoln (1994, p. 14)
Here are some examples of qualitative data:
Interview transcripts : Verbatim records of what participants said during an interview or focus group. They allow researchers to identify common themes and patterns, and draw conclusions based on the data. Interview transcripts can also be useful in providing direct quotes and examples to support research findings.
Observations : The researcher typically takes detailed notes on what they observe, including any contextual information, nonverbal cues, or other relevant details. The resulting observational data can be analyzed to gain insights into social phenomena, such as human behavior, social interactions, and cultural practices.
Unstructured interviews : generate qualitative data through the use of open questions. This allows the respondent to talk in some depth, choosing their own words. This helps the researcher develop a real sense of a person’s understanding of a situation.
Diaries or journals : Written accounts of personal experiences or reflections.
Notice that qualitative data could be much more than just words or text. Photographs, videos, sound recordings, and so on, can be considered qualitative data. Visual data can be used to understand behaviors, environments, and social interactions.
Qualitative Data Analysis
Qualitative research is endlessly creative and interpretive. The researcher does not just leave the field with mountains of empirical data and then easily write up his or her findings.
Qualitative interpretations are constructed, and various techniques can be used to make sense of the data, such as content analysis, grounded theory (Glaser & Strauss, 1967), thematic analysis (Braun & Clarke, 2006), or discourse analysis .
For example, thematic analysis is a qualitative approach that involves identifying implicit or explicit ideas within the data. Themes will often emerge once the data has been coded .

Key Features
- Events can be understood adequately only if they are seen in context. Therefore, a qualitative researcher immerses her/himself in the field, in natural surroundings. The contexts of inquiry are not contrived; they are natural. Nothing is predefined or taken for granted.
- Qualitative researchers want those who are studied to speak for themselves, to provide their perspectives in words and other actions. Therefore, qualitative research is an interactive process in which the persons studied teach the researcher about their lives.
- The qualitative researcher is an integral part of the data; without the active participation of the researcher, no data exists.
- The study’s design evolves during the research and can be adjusted or changed as it progresses. For the qualitative researcher, there is no single reality. It is subjective and exists only in reference to the observer.
- The theory is data-driven and emerges as part of the research process, evolving from the data as they are collected.
Limitations of Qualitative Research
- Because of the time and costs involved, qualitative designs do not generally draw samples from large-scale data sets.
- The problem of adequate validity or reliability is a major criticism. Because of the subjective nature of qualitative data and its origin in single contexts, it is difficult to apply conventional standards of reliability and validity. For example, because of the central role played by the researcher in the generation of data, it is not possible to replicate qualitative studies.
- Also, contexts, situations, events, conditions, and interactions cannot be replicated to any extent, nor can generalizations be made to a wider context than the one studied with confidence.
- The time required for data collection, analysis, and interpretation is lengthy. Analysis of qualitative data is difficult, and expert knowledge of an area is necessary to interpret qualitative data. Great care must be taken when doing so, for example, looking for mental illness symptoms.
Advantages of Qualitative Research
- Because of close researcher involvement, the researcher gains an insider’s view of the field. This allows the researcher to find issues that are often missed (such as subtleties and complexities) by the scientific, more positivistic inquiries.
- Qualitative descriptions can be important in suggesting possible relationships, causes, effects, and dynamic processes.
- Qualitative analysis allows for ambiguities/contradictions in the data, which reflect social reality (Denscombe, 2010).
- Qualitative research uses a descriptive, narrative style; this research might be of particular benefit to the practitioner as she or he could turn to qualitative reports to examine forms of knowledge that might otherwise be unavailable, thereby gaining new insight.
What Is Quantitative Research?
Quantitative research involves the process of objectively collecting and analyzing numerical data to describe, predict, or control variables of interest.
The goals of quantitative research are to test causal relationships between variables , make predictions, and generalize results to wider populations.
Quantitative researchers aim to establish general laws of behavior and phenomenon across different settings/contexts. Research is used to test a theory and ultimately support or reject it.
Quantitative Methods
Experiments typically yield quantitative data, as they are concerned with measuring things. However, other research methods, such as controlled observations and questionnaires , can produce both quantitative information.
For example, a rating scale or closed questions on a questionnaire would generate quantitative data as these produce either numerical data or data that can be put into categories (e.g., “yes,” “no” answers).
Experimental methods limit how research participants react to and express appropriate social behavior.
Findings are, therefore, likely to be context-bound and simply a reflection of the assumptions that the researcher brings to the investigation.
There are numerous examples of quantitative data in psychological research, including mental health. Here are a few examples:
Another example is the Experience in Close Relationships Scale (ECR), a self-report questionnaire widely used to assess adult attachment styles .
The ECR provides quantitative data that can be used to assess attachment styles and predict relationship outcomes.
Neuroimaging data : Neuroimaging techniques, such as MRI and fMRI, provide quantitative data on brain structure and function.
This data can be analyzed to identify brain regions involved in specific mental processes or disorders.
For example, the Beck Depression Inventory (BDI) is a clinician-administered questionnaire widely used to assess the severity of depressive symptoms in individuals.
The BDI consists of 21 questions, each scored on a scale of 0 to 3, with higher scores indicating more severe depressive symptoms.
Quantitative Data Analysis
Statistics help us turn quantitative data into useful information to help with decision-making. We can use statistics to summarize our data, describing patterns, relationships, and connections. Statistics can be descriptive or inferential.
Descriptive statistics help us to summarize our data. In contrast, inferential statistics are used to identify statistically significant differences between groups of data (such as intervention and control groups in a randomized control study).
- Quantitative researchers try to control extraneous variables by conducting their studies in the lab.
- The research aims for objectivity (i.e., without bias) and is separated from the data.
- The design of the study is determined before it begins.
- For the quantitative researcher, the reality is objective, exists separately from the researcher, and can be seen by anyone.
- Research is used to test a theory and ultimately support or reject it.
Limitations of Quantitative Research
- Context: Quantitative experiments do not take place in natural settings. In addition, they do not allow participants to explain their choices or the meaning of the questions they may have for those participants (Carr, 1994).
- Researcher expertise: Poor knowledge of the application of statistical analysis may negatively affect analysis and subsequent interpretation (Black, 1999).
- Variability of data quantity: Large sample sizes are needed for more accurate analysis. Small-scale quantitative studies may be less reliable because of the low quantity of data (Denscombe, 2010). This also affects the ability to generalize study findings to wider populations.
- Confirmation bias: The researcher might miss observing phenomena because of focus on theory or hypothesis testing rather than on the theory of hypothesis generation.
Advantages of Quantitative Research
- Scientific objectivity: Quantitative data can be interpreted with statistical analysis, and since statistics are based on the principles of mathematics, the quantitative approach is viewed as scientifically objective and rational (Carr, 1994; Denscombe, 2010).
- Useful for testing and validating already constructed theories.
- Rapid analysis: Sophisticated software removes much of the need for prolonged data analysis, especially with large volumes of data involved (Antonius, 2003).
- Replication: Quantitative data is based on measured values and can be checked by others because numerical data is less open to ambiguities of interpretation.
- Hypotheses can also be tested because of statistical analysis (Antonius, 2003).
Antonius, R. (2003). Interpreting quantitative data with SPSS . Sage.
Black, T. R. (1999). Doing quantitative research in the social sciences: An integrated approach to research design, measurement and statistics . Sage.
Braun, V. & Clarke, V. (2006). Using thematic analysis in psychology . Qualitative Research in Psychology , 3, 77–101.
Carr, L. T. (1994). The strengths and weaknesses of quantitative and qualitative research : what method for nursing? Journal of advanced nursing, 20(4) , 716-721.
Denscombe, M. (2010). The Good Research Guide: for small-scale social research. McGraw Hill.
Denzin, N., & Lincoln. Y. (1994). Handbook of Qualitative Research. Thousand Oaks, CA, US: Sage Publications Inc.
Glaser, B. G., Strauss, A. L., & Strutzel, E. (1968). The discovery of grounded theory; strategies for qualitative research. Nursing research, 17(4) , 364.
Minichiello, V. (1990). In-Depth Interviewing: Researching People. Longman Cheshire.
Punch, K. (1998). Introduction to Social Research: Quantitative and Qualitative Approaches. London: Sage
Further Information
- Mixed methods research
- Designing qualitative research
- Methods of data collection and analysis
- Introduction to quantitative and qualitative research
- Checklists for improving rigour in qualitative research: a case of the tail wagging the dog?
- Qualitative research in health care: Analysing qualitative data
- Qualitative data analysis: the framework approach
- Using the framework method for the analysis of
- Qualitative data in multi-disciplinary health research
- Content Analysis
- Grounded Theory
- Thematic Analysis
Have a language expert improve your writing
Run a free plagiarism check in 10 minutes, generate accurate citations for free.
- Knowledge Base
Methodology
- Qualitative vs. Quantitative Research | Differences, Examples & Methods
Qualitative vs. Quantitative Research | Differences, Examples & Methods
Published on April 12, 2019 by Raimo Streefkerk . Revised on June 22, 2023.
When collecting and analyzing data, quantitative research deals with numbers and statistics, while qualitative research deals with words and meanings. Both are important for gaining different kinds of knowledge.
Common quantitative methods include experiments, observations recorded as numbers, and surveys with closed-ended questions.
Quantitative research is at risk for research biases including information bias , omitted variable bias , sampling bias , or selection bias . Qualitative research Qualitative research is expressed in words . It is used to understand concepts, thoughts or experiences. This type of research enables you to gather in-depth insights on topics that are not well understood.
Common qualitative methods include interviews with open-ended questions, observations described in words, and literature reviews that explore concepts and theories.
Table of contents
The differences between quantitative and qualitative research, data collection methods, when to use qualitative vs. quantitative research, how to analyze qualitative and quantitative data, other interesting articles, frequently asked questions about qualitative and quantitative research.
Quantitative and qualitative research use different research methods to collect and analyze data, and they allow you to answer different kinds of research questions.

Quantitative and qualitative data can be collected using various methods. It is important to use a data collection method that will help answer your research question(s).
Many data collection methods can be either qualitative or quantitative. For example, in surveys, observational studies or case studies , your data can be represented as numbers (e.g., using rating scales or counting frequencies) or as words (e.g., with open-ended questions or descriptions of what you observe).
However, some methods are more commonly used in one type or the other.
Quantitative data collection methods
- Surveys : List of closed or multiple choice questions that is distributed to a sample (online, in person, or over the phone).
- Experiments : Situation in which different types of variables are controlled and manipulated to establish cause-and-effect relationships.
- Observations : Observing subjects in a natural environment where variables can’t be controlled.
Qualitative data collection methods
- Interviews : Asking open-ended questions verbally to respondents.
- Focus groups : Discussion among a group of people about a topic to gather opinions that can be used for further research.
- Ethnography : Participating in a community or organization for an extended period of time to closely observe culture and behavior.
- Literature review : Survey of published works by other authors.
A rule of thumb for deciding whether to use qualitative or quantitative data is:
- Use quantitative research if you want to confirm or test something (a theory or hypothesis )
- Use qualitative research if you want to understand something (concepts, thoughts, experiences)
For most research topics you can choose a qualitative, quantitative or mixed methods approach . Which type you choose depends on, among other things, whether you’re taking an inductive vs. deductive research approach ; your research question(s) ; whether you’re doing experimental , correlational , or descriptive research ; and practical considerations such as time, money, availability of data, and access to respondents.
Quantitative research approach
You survey 300 students at your university and ask them questions such as: “on a scale from 1-5, how satisfied are your with your professors?”
You can perform statistical analysis on the data and draw conclusions such as: “on average students rated their professors 4.4”.
Qualitative research approach
You conduct in-depth interviews with 15 students and ask them open-ended questions such as: “How satisfied are you with your studies?”, “What is the most positive aspect of your study program?” and “What can be done to improve the study program?”
Based on the answers you get you can ask follow-up questions to clarify things. You transcribe all interviews using transcription software and try to find commonalities and patterns.
Mixed methods approach
You conduct interviews to find out how satisfied students are with their studies. Through open-ended questions you learn things you never thought about before and gain new insights. Later, you use a survey to test these insights on a larger scale.
It’s also possible to start with a survey to find out the overall trends, followed by interviews to better understand the reasons behind the trends.
Qualitative or quantitative data by itself can’t prove or demonstrate anything, but has to be analyzed to show its meaning in relation to the research questions. The method of analysis differs for each type of data.
Analyzing quantitative data
Quantitative data is based on numbers. Simple math or more advanced statistical analysis is used to discover commonalities or patterns in the data. The results are often reported in graphs and tables.
Applications such as Excel, SPSS, or R can be used to calculate things like:
- Average scores ( means )
- The number of times a particular answer was given
- The correlation or causation between two or more variables
- The reliability and validity of the results
Analyzing qualitative data
Qualitative data is more difficult to analyze than quantitative data. It consists of text, images or videos instead of numbers.
Some common approaches to analyzing qualitative data include:
- Qualitative content analysis : Tracking the occurrence, position and meaning of words or phrases
- Thematic analysis : Closely examining the data to identify the main themes and patterns
- Discourse analysis : Studying how communication works in social contexts
If you want to know more about statistics , methodology , or research bias , make sure to check out some of our other articles with explanations and examples.
- Chi square goodness of fit test
- Degrees of freedom
- Null hypothesis
- Discourse analysis
- Control groups
- Mixed methods research
- Non-probability sampling
- Quantitative research
- Inclusion and exclusion criteria
Research bias
- Rosenthal effect
- Implicit bias
- Cognitive bias
- Selection bias
- Negativity bias
- Status quo bias
Quantitative research deals with numbers and statistics, while qualitative research deals with words and meanings.
Quantitative methods allow you to systematically measure variables and test hypotheses . Qualitative methods allow you to explore concepts and experiences in more detail.
In mixed methods research , you use both qualitative and quantitative data collection and analysis methods to answer your research question .
The research methods you use depend on the type of data you need to answer your research question .
- If you want to measure something or test a hypothesis , use quantitative methods . If you want to explore ideas, thoughts and meanings, use qualitative methods .
- If you want to analyze a large amount of readily-available data, use secondary data. If you want data specific to your purposes with control over how it is generated, collect primary data.
- If you want to establish cause-and-effect relationships between variables , use experimental methods. If you want to understand the characteristics of a research subject, use descriptive methods.
Data collection is the systematic process by which observations or measurements are gathered in research. It is used in many different contexts by academics, governments, businesses, and other organizations.
There are various approaches to qualitative data analysis , but they all share five steps in common:
- Prepare and organize your data.
- Review and explore your data.
- Develop a data coding system.
- Assign codes to the data.
- Identify recurring themes.
The specifics of each step depend on the focus of the analysis. Some common approaches include textual analysis , thematic analysis , and discourse analysis .
A research project is an academic, scientific, or professional undertaking to answer a research question . Research projects can take many forms, such as qualitative or quantitative , descriptive , longitudinal , experimental , or correlational . What kind of research approach you choose will depend on your topic.
Cite this Scribbr article
If you want to cite this source, you can copy and paste the citation or click the “Cite this Scribbr article” button to automatically add the citation to our free Citation Generator.
Streefkerk, R. (2023, June 22). Qualitative vs. Quantitative Research | Differences, Examples & Methods. Scribbr. Retrieved July 9, 2024, from https://www.scribbr.com/methodology/qualitative-quantitative-research/
Is this article helpful?

Raimo Streefkerk
Other students also liked, what is quantitative research | definition, uses & methods, what is qualitative research | methods & examples, mixed methods research | definition, guide & examples, get unlimited documents corrected.
✔ Free APA citation check included ✔ Unlimited document corrections ✔ Specialized in correcting academic texts
- Chapter Four: Quantitative Methods (Part 1)
Once you have chosen a topic to investigate, you need to decide which type of method is best to study it. This is one of the most important choices you will make on your research journey. Understanding the value of each of the methods described in this textbook to answer different questions allows you to be able to plan your own studies with more confidence, critique the studies others have done, and provide advice to your colleagues and friends on what type of research they should do to answer questions they have. After briefly reviewing quantitative research assumptions, this chapter is organized in three parts or sections. These parts can also be used as a checklist when working through the steps of your study. Specifically, part 1 focuses on planning a quantitative study (collecting data), part two explains the steps involved in doing a quantitative study, and part three discusses how to make sense of your results (organizing and analyzing data).
- Chapter One: Introduction
- Chapter Two: Understanding the distinctions among research methods
- Chapter Three: Ethical research, writing, and creative work
- Chapter Four: Quantitative Methods (Part 2 - Doing Your Study)
- Chapter Four: Quantitative Methods (Part 3 - Making Sense of Your Study)
- Chapter Five: Qualitative Methods (Part 1)
- Chapter Five: Qualitative Data (Part 2)
- Chapter Six: Critical / Rhetorical Methods (Part 1)
- Chapter Six: Critical / Rhetorical Methods (Part 2)
- Chapter Seven: Presenting Your Results
Quantitative Worldview Assumptions: A Review
In chapter 2, you were introduced to the unique assumptions quantitative research holds about knowledge and how it is created, or what the authors referred to in chapter one as "epistemology." Understanding these assumptions can help you better determine whether you need to use quantitative methods for a particular research study in which you are interested.
Quantitative researchers believe there is an objective reality, which can be measured. "Objective" here means that the researcher is not relying on their own perceptions of an event. S/he is attempting to gather "facts" which may be separate from people's feeling or perceptions about the facts. These facts are often conceptualized as "causes" and "effects." When you ask research questions or pose hypotheses with words in them such as "cause," "effect," "difference between," and "predicts," you are operating under assumptions consistent with quantitative methods. The overall goal of quantitative research is to develop generalizations that enable the researcher to better predict, explain, and understand some phenomenon.
Because of trying to prove cause-effect relationships that can be generalized to the population at large, the research process and related procedures are very important for quantitative methods. Research should be consistently and objectively conducted, without bias or error, in order to be considered to be valid (accurate) and reliable (consistent). Perhaps this emphasis on accurate and standardized methods is because the roots of quantitative research are in the natural and physical sciences, both of which have at their base the need to prove hypotheses and theories in order to better understand the world in which we live. When a person goes to a doctor and is prescribed some medicine to treat an illness, that person is glad such research has been done to know what the effects of taking this medicine is on others' bodies, so s/he can trust the doctor's judgment and take the medicines.
As covered in chapters 1 and 2, the questions you are asking should lead you to a certain research method choice. Students sometimes want to avoid doing quantitative research because of fear of math/statistics, but if their questions call for that type of research, they should forge ahead and use it anyway. If a student really wants to understand what the causes or effects are for a particular phenomenon, they need to do quantitative research. If a student is interested in what sorts of things might predict a person's behavior, they need to do quantitative research. If they want to confirm the finding of another researcher, most likely they will need to do quantitative research. If a student wishes to generalize beyond their participant sample to a larger population, they need to be conducting quantitative research.
So, ultimately, your choice of methods really depends on what your research goal is. What do you really want to find out? Do you want to compare two or more groups, look for relationships between certain variables, predict how someone will act or react, or confirm some findings from another study? If so, you want to use quantitative methods.
A topic such as self-esteem can be studied in many ways. Listed below are some example RQs about self-esteem. Which of the following research questions should be answered with quantitative methods?
- Is there a difference between men's and women's level of self- esteem?
- How do college-aged women describe their ups and downs with self-esteem?
- How has "self-esteem" been constructed in popular self-help books over time?
- Is there a relationship between self-esteem levels and communication apprehension?
What are the advantages of approaching a topic like self-esteem using quantitative methods? What are the disadvantages?
For more information, see the following website: Analyse This!!! Learning to analyse quantitative data
Answers: 1 & 4
Quantitative Methods Part One: Planning Your Study
Planning your study is one of the most important steps in the research process when doing quantitative research. As seen in the diagram below, it involves choosing a topic, writing research questions/hypotheses, and designing your study. Each of these topics will be covered in detail in this section of the chapter.
Topic Choice
Decide on topic.
How do you go about choosing a topic for a research project? One of the best ways to do this is to research something about which you would like to know more. Your communication professors will probably also want you to select something that is related to communication and things you are learning about in other communication classes.
When the authors of this textbook select research topics to study, they choose things that pique their interest for a variety of reasons, sometimes personal and sometimes because they see a need for more research in a particular area. For example, April Chatham-Carpenter studies adoption return trips to China because she has two adopted daughters from China and because there is very little research on this topic for Chinese adoptees and their families; she studied home vs. public schooling because her sister home schools, and at the time she started the study very few researchers had considered the social network implications for home schoolers (cf. http://www.uni.edu/chatham/homeschool.html ).
When you are asked in this class and other classes to select a topic to research, think about topics that you have wondered about, that affect you personally, or that know have gaps in the research. Then start writing down questions you would like to know about this topic. These questions will help you decide whether the goal of your study is to understand something better, explain causes and effects of something, gather the perspectives of others on a topic, or look at how language constructs a certain view of reality.
Review Previous Research
In quantitative research, you do not rely on your conclusions to emerge from the data you collect. Rather, you start out looking for certain things based on what the past research has found. This is consistent with what was called in chapter 2 as a deductive approach (Keyton, 2011), which also leads a quantitative researcher to develop a research question or research problem from reviewing a body of literature, with the previous research framing the study that is being done. So, reviewing previous research done on your topic is an important part of the planning of your study. As seen in chapter 3 and the Appendix, to do an adequate literature review, you need to identify portions of your topic that could have been researched in the past. To do that, you select key terms of concepts related to your topic.
Some people use concept maps to help them identify useful search terms for a literature review. For example, see the following website: Concept Mapping: How to Start Your Term Paper Research .
Narrow Topic to Researchable Area
Once you have selected your topic area and reviewed relevant literature related to your topic, you need to narrow your topic to something that can be researched practically and that will take the research on this topic further. You don't want your research topic to be so broad or large that you are unable to research it. Plus, you want to explain some phenomenon better than has been done before, adding to the literature and theory on a topic. You may want to test out what someone else has found, replicating their study, and therefore building to the body of knowledge already created.
To see how a literature review can be helpful in narrowing your topic, see the following sources. Narrowing or Broadening Your Research Topic and How to Conduct a Literature Review in Social Science
Research Questions & Hypotheses
Write Your Research Questions (RQs) and/or Hypotheses (Hs)
Once you have narrowed your topic based on what you learned from doing your review of literature, you need to formalize your topic area into one or more research questions or hypotheses. If the area you are researching is a relatively new area, and no existing literature or theory can lead you to predict what you might find, then you should write a research question. Take a topic related to social media, for example, which is a relatively new area of study. You might write a research question that asks:
"Is there a difference between how 1st year and 4th year college students use Facebook to communicate with their friends?"
If, however, you are testing out something you think you might find based on the findings of a large amount of previous literature or a well-developed theory, you can write a hypothesis. Researchers often distinguish between null and alternative hypotheses. The alternative hypothesis is what you are trying to test or prove is true, while the null hypothesis assumes that the alternative hypothesis is not true. For example, if the use of Facebook had been studied a great deal, and there were theories that had been developed on the use of it, then you might develop an alternative hypothesis, such as: "First-year students spend more time on using Facebook to communicate with their friends than fourth-year students do." Your null hypothesis, on the other hand, would be: "First-year students do not spend any more time using Facebook to communication with their friends than fourth-year students do." Researchers, however, only state the alternative hypothesis in their studies, and actually call it "hypothesis" rather than "alternative hypothesis."
Process of Writing a Research Question/Hypothesis.
Once you have decided to write a research question (RQ) or hypothesis (H) for your topic, you should go through the following steps to create your RQ or H.
Name the concepts from your overall research topic that you are interested in studying.
RQs and Hs have variables, or concepts that you are interested in studying. Variables can take on different values. For example, in the RQ above, there are at least two variables – year in college and use of Facebook (FB) to communicate. Both of them have a variety of levels within them.
When you look at the concepts you identified, are there any concepts which seem to be related to each other? For example, in our RQ, we are interested in knowing if there is a difference between first-year students and fourth-year students in their use of FB, meaning that we believe there is some connection between our two variables.
- Decide what type of a relationship you would like to study between the variables. Do you think one causes the other? Does a difference in one create a difference in the other? As the value of one changes, does the value of the other change?
Identify which one of these concepts is the independent (or predictor) variable, or the concept that is perceived to be the cause of change in the other variable? Which one is the dependent (criterion) variable, or the one that is affected by changes in the independent variable? In the above example RQ, year in school is the independent variable, and amount of time spent on Facebook communicating with friends is the dependent variable. The amount of time spent on Facebook depends on a person's year in school.
If you're still confused about independent and dependent variables, check out the following site: Independent & Dependent Variables .
Express the relationship between the concepts as a single sentence – in either a hypothesis or a research question.
For example, "is there a difference between international and American students on their perceptions of the basic communication course," where cultural background and perceptions of the course are your two variables. Cultural background would be the independent variable, and perceptions of the course would be your dependent variable. More examples of RQs and Hs are provided in the next section.
APPLICATION: Try the above steps with your topic now. Check with your instructor to see if s/he would like you to send your topic and RQ/H to him/her via e-mail.
Types of Research Questions/Hypotheses
Once you have written your RQ/H, you need to determine what type of research question or hypothesis it is. This will help you later decide what types of statistics you will need to run to answer your question or test your hypothesis. There are three possible types of questions you might ask, and two possible types of hypotheses. The first type of question cannot be written as a hypothesis, but the second and third types can.
Descriptive Question.
The first type of question is a descriptive question. If you have only one variable or concept you are studying, OR if you are not interested in how the variables you are studying are connected or related to each other, then your question is most likely a descriptive question.
This type of question is the closest to looking like a qualitative question, and often starts with a "what" or "how" or "why" or "to what extent" type of wording. What makes it different from a qualitative research question is that the question will be answered using numbers rather than qualitative analysis. Some examples of a descriptive question, using the topic of social media, include the following.
"To what extent are college-aged students using Facebook to communicate with their friends?"
"Why do college-aged students use Facebook to communicate with their friends?"
Notice that neither of these questions has a clear independent or dependent variable, as there is no clear cause or effect being assumed by the question. The question is merely descriptive in nature. It can be answered by summarizing the numbers obtained for each category, such as by providing percentages, averages, or just the raw totals for each type of strategy or organization. This is true also of the following research questions found in a study of online public relations strategies:
"What online public relations strategies are organizations implementing to combat phishing" (Baker, Baker, & Tedesco, 2007, p. 330), and
"Which organizations are doing most and least, according to recommendations from anti- phishing advocacy recommendations, to combat phishing" (Baker, Baker, & Tedesco, 2007, p. 330)
The researchers in this study reported statistics in their results or findings section, making it clearly a quantitative study, but without an independent or dependent variable; therefore, these research questions illustrate the first type of RQ, the descriptive question.
Difference Question/Hypothesis.
The second type of question is a question/hypothesis of difference, and will often have the word "difference" as part of the question. The very first research question in this section, asking if there is a difference between 1st year and 4th year college students' use of Facebook, is an example of this type of question. In this type of question, the independent variable is some type of grouping or categories, such as age. Another example of a question of difference is one April asked in her research on home schooling: "Is there a difference between home vs. public schoolers on the size of their social networks?" In this example, the independent variable is home vs. public schooling (a group being compared), and the dependent variable is size of social networks. Hypotheses can also be difference hypotheses, as the following example on the same topic illustrates: "Public schoolers have a larger social network than home schoolers do."
Relationship/Association Question/Hypothesis.
The third type of question is a relationship/association question or hypothesis, and will often have the word "relate" or "relationship" in it, as the following example does: "There is a relationship between number of television ads for a political candidate and how successful that political candidate is in getting elected." Here the independent (or predictor) variable is number of TV ads, and the dependent (or criterion) variable is the success at getting elected. In this type of question, there is no grouping being compared, but rather the independent variable is continuous (ranges from zero to a certain number) in nature. This type of question can be worded as either a hypothesis or as a research question, as stated earlier.
Test out your knowledge of the above information, by answering the following questions about the RQ/H listed below. (Remember, for a descriptive question there are no clear independent & dependent variables.)
- What is the independent variable (IV)?
- What is the dependent variable (DV)?
- What type of research question/hypothesis is it? (descriptive, difference, relationship/association)
- "Is there a difference on relational satisfaction between those who met their current partner through online dating and those who met their current partner face-to-face?"
- "How do Fortune 500 firms use focus groups to market new products?"
- "There is a relationship between age and amount of time spent online using social media."
Answers: RQ1 is a difference question, with type of dating being the IV and relational satisfaction being the DV. RQ2 is a descriptive question with no IV or DV. RQ3 is a relationship hypothesis with age as the IV and amount of time spent online as the DV.
Design Your Study
The third step in planning your research project, after you have decided on your topic/goal and written your research questions/hypotheses, is to design your study which means to decide how to proceed in gathering data to answer your research question or to test your hypothesis. This step includes six things to do. [NOTE: The terms used in this section will be defined as they are used.]
- Decide type of study design: Experimental, quasi-experimental, non-experimental.
- Decide kind of data to collect: Survey/interview, observation, already existing data.
- Operationalize variables into measurable concepts.
- Determine type of sample: Probability or non-probability.
- Decide how you will collect your data: face-to-face, via e-mail, an online survey, library research, etc.
- Pilot test your methods.
Types of Study Designs
With quantitative research being rooted in the scientific method, traditional research is structured in an experimental fashion. This is especially true in the natural sciences, where they try to prove causes and effects on topics such as successful treatments for cancer. For example, the University of Iowa Hospitals and Clinics regularly conduct clinical trials to test for the effectiveness of certain treatments for medical conditions ( University of Iowa Hospitals & Clinics: Clinical Trials ). They use human participants to conduct such research, regularly recruiting volunteers. However, in communication, true experiments with treatments the researcher controls are less necessary and thus less common. It is important for the researcher to understand which type of study s/he wishes to do, in order to accurately communicate his/her methods to the public when describing the study.
There are three possible types of studies you may choose to do, when embarking on quantitative research: (a) True experiments, (b) quasi-experiments, and (c) non-experiments.
For more information to read on these types of designs, take a look at the following website and related links in it: Types of Designs .
The following flowchart should help you distinguish between the three types of study designs described below.
True Experiments.
The first two types of study designs use difference questions/hypotheses, as the independent variable for true and quasi-experiments is nominal or categorical (based on categories or groupings), as you have groups that are being compared. As seen in the flowchart above, what distinguishes a true experiment from the other two designs is a concept called "random assignment." Random assignment means that the researcher controls to which group the participants are assigned. April's study of home vs. public schooling was NOT a true experiment, because she could not control which participants were home schooled and which ones were public schooled, and instead relied on already existing groups.
An example of a true experiment reported in a communication journal is a study investigating the effects of using interest-based contemporary examples in a lecture on the history of public relations, in which the researchers had the following two hypotheses: "Lectures utilizing interest- based examples should result in more interested participants" and "Lectures utilizing interest- based examples should result in participants with higher scores on subsequent tests of cognitive recall" (Weber, Corrigan, Fornash, & Neupauer, 2003, p. 118). In this study, the 122 college student participants were randomly assigned by the researchers to one of two lecture video viewing groups: a video lecture with traditional examples and a video with contemporary examples. (To see the results of the study, look it up using your school's library databases).
A second example of a true experiment in communication is a study of the effects of viewing either a dramatic narrative television show vs. a nonnarrative television show about the consequences of an unexpected teen pregnancy. The researchers randomly assigned their 367 undergraduate participants to view one of the two types of shows.
Moyer-Gusé, E., & Nabi, R. L. (2010). Explaining the effects of narrative in an entertainment television program: Overcoming resistance to persuasion. Human Communication Research, 36 , 26-52.
A third example of a true experiment done in the field of communication can be found in the following study.
Jensen, J. D. (2008). Scientific uncertainty in news coverage of cancer research: Effects of hedging on scientists' and journalists' credibility. Human Communication Research, 34, 347-369.
In this study, Jakob Jensen had three independent variables. He randomly assigned his 601 participants to 1 of 20 possible conditions, between his three independent variables, which were (a) a hedged vs. not hedged message, (b) the source of the hedging message (research attributed to primary vs. unaffiliated scientists), and (c) specific news story employed (of which he had five randomly selected news stories about cancer research to choose from). Although this study was pretty complex, it does illustrate the true experiment in our field since the participants were randomly assigned to read a particular news story, with certain characteristics.
Quasi-Experiments.
If the researcher is not able to randomly assign participants to one of the treatment groups (or independent variable), but the participants already belong to one of them (e.g., age; home vs. public schooling), then the design is called a quasi-experiment. Here you still have an independent variable with groups, but the participants already belong to a group before the study starts, and the researcher has no control over which group they belong to.
An example of a hypothesis found in a communication study is the following: "Individuals high in trait aggression will enjoy violent content more than nonviolent content, whereas those low in trait aggression will enjoy violent content less than nonviolent content" (Weaver & Wilson, 2009, p. 448). In this study, the researchers could not assign the participants to a high or low trait aggression group since this is a personality characteristic, so this is a quasi-experiment. It does not have any random assignment of participants to the independent variable groups. Read their study, if you would like to, at the following location.
Weaver, A. J., & Wilson, B. J. (2009). The role of graphic and sanitized violence in the enjoyment of television dramas. Human Communication Research, 35 (3), 442-463.
Benoit and Hansen (2004) did not choose to randomly assign participants to groups either, in their study of a national presidential election survey, in which they were looking at differences between debate and non-debate viewers, in terms of several dependent variables, such as which candidate viewers supported. If you are interested in discovering the results of this study, take a look at the following article.
Benoit, W. L., & Hansen, G. J. (2004). Presidential debate watching, issue knowledge, character evaluation, and vote choice. Human Communication Research, 30 (1), 121-144.
Non-Experiments.
The third type of design is the non-experiment. Non-experiments are sometimes called survey designs, because their primary way of collecting data is through surveys. This is not enough to distinguish them from true experiments and quasi-experiments, however, as both of those types of designs may use surveys as well.
What makes a study a non-experiment is that the independent variable is not a grouping or categorical variable. Researchers observe or survey participants in order to describe them as they naturally exist without any experimental intervention. Researchers do not give treatments or observe the effects of a potential natural grouping variable such as age. Descriptive and relationship/association questions are most often used in non-experiments.
Some examples of this type of commonly used design for communication researchers include the following studies.
- Serota, Levine, and Boster (2010) used a national survey of 1,000 adults to determine the prevalence of lying in America (see Human Communication Research, 36 , pp. 2-25).
- Nabi (2009) surveyed 170 young adults on their perceptions of reality television on cosmetic surgery effects, looking at several things: for example, does viewing cosmetic surgery makeover programs relate to body satisfaction (p. 6), finding no significant relationship between those two variables (see Human Communication Research, 35 , pp. 1-27).
- Derlega, Winstead, Mathews, and Braitman (2008) collected stories from 238 college students on reasons why they would disclose or not disclose personal information within close relationships (see Communication Research Reports, 25 , pp. 115-130). They coded the participants' answers into categories so they could count how often specific reasons were mentioned, using a method called content analysis , to answer the following research questions:
RQ1: What are research participants' attributions for the disclosure and nondisclosure of highly personal information?
RQ2: Do attributions reflect concerns about rewards and costs of disclosure or the tension between openness with another and privacy?
RQ3: How often are particular attributions for disclosure/nondisclosure used in various types of relationships? (p. 117)
All of these non-experimental studies have in common no researcher manipulation of an independent variable or even having an independent variable that has natural groups that are being compared.
Identify which design discussed above should be used for each of the following research questions.
- Is there a difference between generations on how much they use MySpace?
- Is there a relationship between age when a person first started using Facebook and the amount of time they currently spend on Facebook daily?
- Is there a difference between potential customers' perceptions of an organization who are shown an organization's Facebook page and those who are not shown an organization's Facebook page?
[HINT: Try to identify the independent and dependent variable in each question above first, before determining what type of design you would use. Also, try to determine what type of question it is – descriptive, difference, or relationship/association.]
Answers: 1. Quasi-experiment 2. Non-experiment 3. True Experiment
Data Collection Methods
Once you decide the type of quantitative research design you will be using, you will need to determine which of the following types of data you will collect: (a) survey data, (b) observational data, and/or (c) already existing data, as in library research.
Using the survey data collection method means you will talk to people or survey them about their behaviors, attitudes, perceptions, and demographic characteristics (e.g., biological sex, socio-economic status, race). This type of data usually consists of a series of questions related to the concepts you want to study (i.e., your independent and dependent variables). Both of April's studies on home schooling and on taking adopted children on a return trip back to China used survey data.
On a survey, you can have both closed-ended and open-ended questions. Closed-ended questions, can be written in a variety of forms. Some of the most common response options include the following.
Likert responses – for example: for the following statement, ______ do you strongly agree agree neutral disagree strongly disagree
Semantic differential – for example: does the following ______ make you Happy ..................................... Sad
Yes-no answers for example: I use social media daily. Yes / No.
One site to check out for possible response options is http://www.360degreefeedback.net/media/ResponseScales.pdf .
Researchers often follow up some of their closed-ended questions with an "other" category, in which they ask their participants to "please specify," their response if none of the ones provided are applicable. They may also ask open-ended questions on "why" a participant chose a particular answer or ask participants for more information about a particular topic. If the researcher wants to use the open-ended question responses as part of his/her quantitative study, the answers are usually coded into categories and counted, in terms of the frequency of a certain answer, using a method called content analysis , which will be discussed when we talk about already-existing artifacts as a source of data.
Surveys can be done face-to-face, by telephone, mail, or online. Each of these methods has its own advantages and disadvantages, primarily in the form of the cost in time and money to do the survey. For example, if you want to survey many people, then online survey tools such as surveygizmo.com and surveymonkey.com are very efficient, but not everyone has access to taking a survey on the computer, so you may not get an adequate sample of the population by doing so. Plus you have to decide how you will recruit people to take your online survey, which can be challenging. There are trade-offs with every method.
For more information on things to consider when selecting your survey method, check out the following website:
Selecting the Survey Method .
There are also many good sources for developing a good survey, such as the following websites. Constructing the Survey Survey Methods Designing Surveys
Observation.
A second type of data collection method is observation . In this data collection method, you make observations of the phenomenon you are studying and then code your observations, so that you can count what you are studying. This type of data collection method is often called interaction analysis, if you collect data by observing people's behavior. For example, if you want to study the phenomenon of mall-walking, you could go to a mall and count characteristics of mall-walkers. A researcher in the area of health communication could study the occurrence of humor in an operating room, for example, by coding and counting the use of humor in such a setting.
One extended research study using observational data collection methods, which is cited often in interpersonal communication classes, is John Gottman's research, which started out in what is now called "The Love Lab." In this lab, researchers observe interactions between couples, including physiological symptoms, using coders who look for certain items found to predict relationship problems and success.
Take a look at the YouTube video about "The Love Lab" at the following site to learn more about the potential of using observation in collecting data for a research study: The "Love" Lab .
Already-Existing Artifacts.
The third method of quantitative data collection is the use of already-existing artifacts . With this method, you choose certain artifacts (e.g., newspaper or magazine articles; television programs; webpages) and code their content, resulting in a count of whatever you are studying. With this data collection method, researchers most often use what is called quantitative content analysis . Basically, the researcher counts frequencies of something that occurs in an artifact of study, such as the frequency of times something is mentioned on a webpage. Content analysis can also be used in qualitative research, where a researcher identifies and creates text-based themes but does not do a count of the occurrences of these themes. Content analysis can also be used to take open-ended questions from a survey method, and identify countable themes within the questions.
Content analysis is a very common method used in media studies, given researchers are interested in studying already-existing media artifacts. There are many good sources to illustrate how to do content analysis such as are seen in the box below.
See the following sources for more information on content analysis. Writing Guide: Content Analysis A Flowchart for the Typical Process of Content Analysis Research What is Content Analysis?
With content analysis and any method that you use to code something into categories, one key concept you need to remember is inter-coder or inter-rater reliability , in which there are multiple coders (at least two) trained to code the observations into categories. This check on coding is important because you need to check to make sure that the way you are coding your observations on the open-ended answers is the same way that others would code a particular item. To establish this kind of inter-coder or inter-rater reliability, researchers prepare codebooks (to train their coders on how to code the materials) and coding forms for their coders to use.
To see some examples of actual codebooks used in research, see the following website: Human Coding--Sample Materials .
There are also online inter-coder reliability calculators some researchers use, such as the following: ReCal: reliability calculation for the masses .
Regardless of which method of data collection you choose, you need to decide even more specifically how you will measure the variables in your study, which leads us to the next planning step in the design of a study.
Operationalization of Variables into Measurable Concepts
When you look at your research question/s and/or hypotheses, you should know already what your independent and dependent variables are. Both of these need to be measured in some way. We call that way of measuring operationalizing a variable. One way to think of it is writing a step by step recipe for how you plan to obtain data on this topic. How you choose to operationalize your variable (or write the recipe) is one all-important decision you have to make, which will make or break your study. In quantitative research, you have to measure your variables in a valid (accurate) and reliable (consistent) manner, which we discuss in this section. You also need to determine the level of measurement you will use for your variables, which will help you later decide what statistical tests you need to run to answer your research question/s or test your hypotheses. We will start with the last topic first.
Level of Measurement
Level of measurement has to do with whether you measure your variables using categories or groupings OR whether you measure your variables using a continuous level of measurement (range of numbers). The level of measurement that is considered to be categorical in nature is called nominal, while the levels of measurement considered to be continuous in nature are ordinal, interval, and ratio. The only ones you really need to know are nominal, ordinal, and interval/ratio.
Nominal variables are categories that do not have meaningful numbers attached to them but are broader categories, such as male and female, home schooled and public schooled, Caucasian and African-American. Ordinal variables do have numbers attached to them, in that the numbers are in a certain order, but there are not equal intervals between the numbers (e.g., such as when you rank a group of 5 items from most to least preferred, where 3 might be highly preferred, and 2 hated). Interval/ratio variables have equal intervals between the numbers (e.g., weight, age).
For more information about these levels of measurement, check out one of the following websites. Levels of Measurement Measurement Scales in Social Science Research What is the difference between ordinal, interval and ratio variables? Why should I care?
Validity and Reliability
When developing a scale/measure or survey, you need to be concerned about validity and reliability. Readers of quantitative research expect to see researchers justify their research measures using these two terms in the methods section of an article or paper.
Validity. Validity is the extent to which your scale/measure or survey adequately reflects the full meaning of the concept you are measuring. Does it measure what you say it measures? For example, if researchers wanted to develop a scale to measure "servant leadership," the researchers would have to determine what dimensions of servant leadership they wanted to measure, and then create items which would be valid or accurate measures of these dimensions. If they included items related to a different type of leadership, those items would not be a valid measure of servant leadership. When doing so, the researchers are trying to prove their measure has internal validity. Researchers may also be interested in external validity, but that has to do with how generalizable their study is to a larger population (a topic related to sampling, which we will consider in the next section), and has less to do with the validity of the instrument itself.
There are several types of validity you may read about, including face validity, content validity, criterion-related validity, and construct validity. To learn more about these types of validity, read the information at the following link: Validity .
To improve the validity of an instrument, researchers need to fully understand the concept they are trying to measure. This means they know the academic literature surrounding that concept well and write several survey questions on each dimension measured, to make sure the full idea of the concept is being measured. For example, Page and Wong (n.d.) identified four dimensions of servant leadership: character, people-orientation, task-orientation, and process-orientation ( A Conceptual Framework for Measuring Servant-Leadership ). All of these dimensions (and any others identified by other researchers) would need multiple survey items developed if a researcher wanted to create a new scale on servant leadership.
Before you create a new survey, it can be useful to see if one already exists with established validity and reliability. Such measures can be found by seeing what other respected studies have used to measure a concept and then doing a library search to find the scale/measure itself (sometimes found in the reference area of a library in books like those listed below).
Reliability . Reliability is the second criterion you will need to address if you choose to develop your own scale or measure. Reliability is concerned with whether a measurement is consistent and reproducible. If you have ever wondered why, when taking a survey, that a question is asked more than once or very similar questions are asked multiple times, it is because the researchers one concerned with proving their study has reliability. Are you, for example, answering all of the similar questions similarly? If so, the measure/scale may have good reliability or consistency over time.
Researchers can use a variety of ways to show their measure/scale is reliable. See the following websites for explanations of some of these ways, which include methods such as the test-retest method, the split-half method, and inter-coder/rater reliability. Types of Reliability Reliability
To understand the relationship between validity and reliability, a nice visual provided below is explained at the following website (Trochim, 2006, para. 2). Reliability & Validity
Self-Quiz/Discussion:
Take a look at one of the surveys found at the following poll reporting sites on a topic which interests you. Critique one of these surveys, using what you have learned about creating surveys so far.
http://www.pewinternet.org/ http://pewresearch.org/ http://www.gallup.com/Home.aspx http://www.kff.org/
One of the things you might have critiqued in the previous self-quiz/discussion may have had less to do with the actual survey itself, but rather with how the researchers got their participants or sample. How participants are recruited is just as important to doing a good study as how valid and reliable a survey is.
Imagine that in the article you chose for the last "self-quiz/discussion" you read the following quote from the Pew Research Center's Internet and American Life Project: "One in three teens sends more than 100 text messages a day, or 3000 texts a month" (Lenhart, 2010, para.5). How would you know whether you could trust this finding to be true? Would you compare it to what you know about texting from your own and your friends' experiences? Would you want to know what types of questions people were asked to determine this statistic, or whether the survey the statistic is based on is valid and reliable? Would you want to know what type of people were surveyed for the study? As a critical consumer of research, you should ask all of these types of questions, rather than just accepting such a statement as undisputable fact. For example, if only people shopping at an Apple Store were surveyed, the results might be skewed high.
In particular, related to the topic of this section, you should ask about the sampling method the researchers did. Often, the researchers will provide information related to the sample, stating how many participants were surveyed (in this case 800 teens, aged 12-17, who were a nationally representative sample of the population) and how much the "margin of error" is (in this case +/- 3.8%). Why do they state such things? It is because they know the importance of a sample in making the case for their findings being legitimate and credible. Margin of error is how much we are confident that our findings represent the population at large. The larger the margin of error, the less likely it is that the poll or survey is accurate. Margin of error assumes a 95% confidence level that what we found from our study represents the population at large.
For more information on margin of error, see one of the following websites. Answers.com Margin of Error Stats.org Margin of Error Americanresearchgroup.com Margin of Error [this last site is a margin of error calculator, which shows that margin of error is directly tied to the size of your sample, in relationship to the size of the population, two concepts we will talk about in the next few paragraphs]
In particular, this section focused on sampling will talk about the following topics: (a) the difference between a population vs. a sample; (b) concepts of error and bias, or "it's all about significance"; (c) probability vs. non-probability sampling; and (d) sample size issues.
Population vs. Sample
When doing quantitative studies, such as the study of cell phone usage among teens, you are never able to survey the entire population of teenagers, so you survey a portion of the population. If you study every member of a population, then you are conducting a census such as the United States Government does every 10 years. When, however, this is not possible (because you do not have the money the U.S. government has!), you attempt to get as good a sample as possible.
Characteristics of a population are summarized in numerical form, and technically these numbers are called parameters . However, numbers which summarize the characteristics of a sample are called statistics .
Error and Bias
If a sample is not done well, then you may not have confidence in how the study's results can be generalized to the population from which the sample was taken. Your confidence level is often stated as the margin of error of the survey. As noted earlier, a study's margin of error refers to the degree to which a sample differs from the total population you are studying. In the Pew survey, they had a margin of error of +/- 3.8%. So, for example, when the Pew survey said 33% of teens send more than 100 texts a day, the margin of error means they were 95% sure that 29.2% - 36.8% of teens send this many texts a day.
Margin of error is tied to sampling error , which is how much difference there is between your sample's results and what would have been obtained if you had surveyed the whole population. Sample error is linked to a very important concept for quantitative researchers, which is the notion of significance . Here, significance does not refer to whether some finding is morally or practically significant, it refers to whether a finding is statistically significant, meaning the findings are not due to chance but actually represent something that is found in the population. Statistical significance is about how much you, as the researcher, are willing to risk saying you found something important and be wrong.
For the difference between statistical significance and practical significance, see the following YouTube video: Statistical and Practical Significance .
Scientists set certain arbitrary standards based on the probability they could be wrong in reporting their findings. These are called significance levels and are commonly reported in the literature as p <.05 or p <.01 or some other probability (or p ) level.
If an article says a statistical test reported that p < .05 , it simply means that they are most likely correct in what they are saying, but there is a 5% chance they could be wrong and not find the same results in the population. If p < .01, then there would be only a 1% chance they were wrong and would not find the same results in the population. The lower the probability level, the more certain the results.
When researchers are wrong, or make that kind of decision error, it often implies that either (a) their sample was biased and was not representative of the true population in some way, or (b) that something they did in collecting the data biased the results. There are actually two kinds of sampling error talked about in quantitative research: Type I and Type II error. Type 1 error is what happens when you think you found something statistically significant and claim there is a significant difference or relationship, when there really is not in the actual population. So there is something about your sample that made you find something that is not in the actual population. (Type I error is the same as the probability level, or .05, if using the traditional p-level accepted by most researchers.) Type II error happens when you don't find a statistically significant difference or relationship, yet there actually is one in the population at large, so once again, your sample is not representative of the population.
For more information on these two types of error, check out the following websites. Hypothesis Testing: Type I Error, Type II Error Type I and Type II Errors - Making Mistakes in the Justice System
Researchers want to select a sample that is representative of the population in order to reduce the likelihood of having a sample that is biased. There are two types of bias particularly troublesome for researchers, in terms of sampling error. The first type is selection bias , in which each person in the population does not have an equal chance to be chosen for the sample, which happens frequently in communication studies, because we often rely on convenience samples (whoever we can get to complete our surveys). The second type of bias is response bias , in which those who volunteer for a study have different characteristics than those who did not volunteer for the study, another common challenge for communication researchers. Volunteers for a study may very well be different from persons who choose not to volunteer for a study, so that you have a biased sample by relying just on volunteers, which is not representative of the population from which you are trying to sample.
Probability vs. Non-Probability Sampling
One of the best ways to lower your sampling error and reduce the possibility of bias is to do probability or random sampling. This means that every person in the population has an equal chance of being selected to be in your sample. Another way of looking at this is to attempt to get a representative sample, so that the characteristics of your sample closely approximate those of the population. A sample needs to contain essentially the same variations that exist in the population, if possible, especially on the variables or elements that are most important to you (e.g., age, biological sex, race, level of education, socio-economic class).
There are many different ways to draw a probability/random sample from the population. Some of the most common are a simple random sample , where you use a random numbers table or random number generator to select your sample from the population.
There are several examples of random number generators available online. See the following example of an online random number generator: http://www.randomizer.org/ .
A systematic random sample takes every n-th number from the population, depending on how many people you would like to have in your sample. A stratified random sample does random sampling within groups, and a multi-stage or cluster sample is used when there are multiple groups within a large area and a large population, and the researcher does random sampling in stages.
If you are interested in understanding more about these types of probability/random samples, take a look at the following website: Probability Sampling .
However, many times communication researchers use whoever they can find to participate in their study, such as college students in their classes since these people are easily accessible. Many of the studies in interpersonal communication and relationship development, for example, used this type of sample. This is called a convenience sample. In doing so, they are using a non- probability or non-random sample. In these types of samples, each member of the population does not have an equal opportunity to be selected. For example, if you decide to ask your facebook friends to participate in an online survey you created about how college students in the U.S. use cell phones to text, you are using a non-random type of sample. You are unable to randomly sample the whole population in the U.S. of college students who text, so you attempt to find participants more conveniently. Some common non-random or non-probability samples are:
- accidental/convenience samples, such as the facebook example illustrates
- quota samples, in which you do convenience samples within subgroups of the population, such as biological sex, looking for a certain number of participants in each group being compared
- snowball or network sampling, where you ask current participants to send your survey onto their friends.
For more information on non-probability sampling, see the following website: Nonprobability Sampling .
Researchers, such as communication scholars, often use these types of samples because of the nature of their research. Most research designs used in communication are not true experiments, such as would be required in the medical field where they are trying to prove some cause-effect relationship to cure or alleviate symptoms of a disease. Most communication scholars recognize that human behavior in communication situations is much less predictable, so they do not adhere to the strictest possible worldview related to quantitative methods and are less concerned with having to use probability sampling.
They do recognize, however, that with either probability or non-probability sampling, there is still the possibility of bias and error, although much less with probability sampling. That is why all quantitative researchers, regardless of field, will report statistical significance levels if they are interested in generalizing from their sample to the population at large, to let the readers of their work know how confident they are in their results.
Size of Sample
The larger the sample, the more likely the sample is going to be representative of the population. If there is a lot of variability in the population (e.g., lots of different ethnic groups in the population), a researcher will need a larger sample. If you are interested in detecting small possible differences (e.g., in a close political race), you need a larger sample. However, the bigger your population, the less you have to increase the size of your sample in order to have an adequate sample, as is illustrated by an example sample size calculator such as can be found at http://www.raosoft.com/samplesize.html .
Using the example sample size calculator, see how you might determine how large of a sample you might need in order to study how college students in the U.S. use texting on their cell phones. You would have to first determine approximately how many college students are in the U.S. According to ANEKI, there are a little over 14,000,000 college students in the U.S. ( Countries with the Most University Students ). When inputting that figure into the sample size calculator below (using no commas for the population size), you would need a sample size of approximately 385 students. If the population size was 20,000, you would need a sample of 377 students. If the population was only 2,000, you would need a sample of 323. For a population of 500, you would need a sample of 218.
It is not enough, however, to just have an adequate or large sample. If there is bias in the sampling, you can have a very bad large sample, one that also does not represent the population at large. So, having an unbiased sample is even more important than having a large sample.
So, what do you do, if you cannot reasonably conduct a probability or random sample? You run statistics which report significance levels, and you report the limitations of your sample in the discussion section of your paper/article.
Pilot Testing Methods
Now that we have talked about the different elements of your study design, you should try out your methods by doing a pilot test of some kind. This means that you try out your procedures with someone to try to catch any mistakes in your design before you start collecting data from actual participants in your study. This will save you time and money in the long run, along with unneeded angst over mistakes you made in your design during data collection. There are several ways you might do this.
You might ask an expert who knows about this topic (such as a faculty member) to try out your experiment or survey and provide feedback on what they think of your design. You might ask some participants who are like your potential sample to take your survey or be a part of your pilot test; then you could ask them which parts were confusing or needed revising. You might have potential participants explain to you what they think your questions mean, to see if they are interpreting them like you intended, or if you need to make some questions clearer.
The main thing is that you do not just assume your methods will work or are the best type of methods to use until you try them out with someone. As you write up your study, in your methods section of your paper, you can then talk about what you did to change your study based on the pilot study you did.
Institutional Review Board (IRB) Approval
The last step of your planning takes place when you take the necessary steps to get your study approved by your institution's review board. As you read in chapter 3, this step is important if you are planning on using the data or results from your study beyond just the requirements for your class project. See chapter 3 for more information on the procedures involved in this step.
Conclusion: Study Design Planning
Once you have decided what topic you want to study, you plan your study. Part 1 of this chapter has covered the following steps you need to follow in this planning process:
- decide what type of study you will do (i.e., experimental, quasi-experimental, non- experimental);
- decide on what data collection method you will use (i.e., survey, observation, or already existing data);
- operationalize your variables into measureable concepts;
- determine what type of sample you will use (probability or non-probability);
- pilot test your methods; and
- get IRB approval.
At that point, you are ready to commence collecting your data, which is the topic of the next section in this chapter.

An official website of the United States government
The .gov means it’s official. Federal government websites often end in .gov or .mil. Before sharing sensitive information, make sure you’re on a federal government site.
The site is secure. The https:// ensures that you are connecting to the official website and that any information you provide is encrypted and transmitted securely.
- Publications
- Account settings
Preview improvements coming to the PMC website in October 2024. Learn More or Try it out now .
- Advanced Search
- Journal List
- J Korean Med Sci
- v.37(16); 2022 Apr 25
A Practical Guide to Writing Quantitative and Qualitative Research Questions and Hypotheses in Scholarly Articles
Edward barroga.
1 Department of General Education, Graduate School of Nursing Science, St. Luke’s International University, Tokyo, Japan.
Glafera Janet Matanguihan
2 Department of Biological Sciences, Messiah University, Mechanicsburg, PA, USA.
The development of research questions and the subsequent hypotheses are prerequisites to defining the main research purpose and specific objectives of a study. Consequently, these objectives determine the study design and research outcome. The development of research questions is a process based on knowledge of current trends, cutting-edge studies, and technological advances in the research field. Excellent research questions are focused and require a comprehensive literature search and in-depth understanding of the problem being investigated. Initially, research questions may be written as descriptive questions which could be developed into inferential questions. These questions must be specific and concise to provide a clear foundation for developing hypotheses. Hypotheses are more formal predictions about the research outcomes. These specify the possible results that may or may not be expected regarding the relationship between groups. Thus, research questions and hypotheses clarify the main purpose and specific objectives of the study, which in turn dictate the design of the study, its direction, and outcome. Studies developed from good research questions and hypotheses will have trustworthy outcomes with wide-ranging social and health implications.
INTRODUCTION
Scientific research is usually initiated by posing evidenced-based research questions which are then explicitly restated as hypotheses. 1 , 2 The hypotheses provide directions to guide the study, solutions, explanations, and expected results. 3 , 4 Both research questions and hypotheses are essentially formulated based on conventional theories and real-world processes, which allow the inception of novel studies and the ethical testing of ideas. 5 , 6
It is crucial to have knowledge of both quantitative and qualitative research 2 as both types of research involve writing research questions and hypotheses. 7 However, these crucial elements of research are sometimes overlooked; if not overlooked, then framed without the forethought and meticulous attention it needs. Planning and careful consideration are needed when developing quantitative or qualitative research, particularly when conceptualizing research questions and hypotheses. 4
There is a continuing need to support researchers in the creation of innovative research questions and hypotheses, as well as for journal articles that carefully review these elements. 1 When research questions and hypotheses are not carefully thought of, unethical studies and poor outcomes usually ensue. Carefully formulated research questions and hypotheses define well-founded objectives, which in turn determine the appropriate design, course, and outcome of the study. This article then aims to discuss in detail the various aspects of crafting research questions and hypotheses, with the goal of guiding researchers as they develop their own. Examples from the authors and peer-reviewed scientific articles in the healthcare field are provided to illustrate key points.
DEFINITIONS AND RELATIONSHIP OF RESEARCH QUESTIONS AND HYPOTHESES
A research question is what a study aims to answer after data analysis and interpretation. The answer is written in length in the discussion section of the paper. Thus, the research question gives a preview of the different parts and variables of the study meant to address the problem posed in the research question. 1 An excellent research question clarifies the research writing while facilitating understanding of the research topic, objective, scope, and limitations of the study. 5
On the other hand, a research hypothesis is an educated statement of an expected outcome. This statement is based on background research and current knowledge. 8 , 9 The research hypothesis makes a specific prediction about a new phenomenon 10 or a formal statement on the expected relationship between an independent variable and a dependent variable. 3 , 11 It provides a tentative answer to the research question to be tested or explored. 4
Hypotheses employ reasoning to predict a theory-based outcome. 10 These can also be developed from theories by focusing on components of theories that have not yet been observed. 10 The validity of hypotheses is often based on the testability of the prediction made in a reproducible experiment. 8
Conversely, hypotheses can also be rephrased as research questions. Several hypotheses based on existing theories and knowledge may be needed to answer a research question. Developing ethical research questions and hypotheses creates a research design that has logical relationships among variables. These relationships serve as a solid foundation for the conduct of the study. 4 , 11 Haphazardly constructed research questions can result in poorly formulated hypotheses and improper study designs, leading to unreliable results. Thus, the formulations of relevant research questions and verifiable hypotheses are crucial when beginning research. 12
CHARACTERISTICS OF GOOD RESEARCH QUESTIONS AND HYPOTHESES
Excellent research questions are specific and focused. These integrate collective data and observations to confirm or refute the subsequent hypotheses. Well-constructed hypotheses are based on previous reports and verify the research context. These are realistic, in-depth, sufficiently complex, and reproducible. More importantly, these hypotheses can be addressed and tested. 13
There are several characteristics of well-developed hypotheses. Good hypotheses are 1) empirically testable 7 , 10 , 11 , 13 ; 2) backed by preliminary evidence 9 ; 3) testable by ethical research 7 , 9 ; 4) based on original ideas 9 ; 5) have evidenced-based logical reasoning 10 ; and 6) can be predicted. 11 Good hypotheses can infer ethical and positive implications, indicating the presence of a relationship or effect relevant to the research theme. 7 , 11 These are initially developed from a general theory and branch into specific hypotheses by deductive reasoning. In the absence of a theory to base the hypotheses, inductive reasoning based on specific observations or findings form more general hypotheses. 10
TYPES OF RESEARCH QUESTIONS AND HYPOTHESES
Research questions and hypotheses are developed according to the type of research, which can be broadly classified into quantitative and qualitative research. We provide a summary of the types of research questions and hypotheses under quantitative and qualitative research categories in Table 1 .
| Quantitative research questions | Quantitative research hypotheses |
|---|---|
| Descriptive research questions | Simple hypothesis |
| Comparative research questions | Complex hypothesis |
| Relationship research questions | Directional hypothesis |
| Non-directional hypothesis | |
| Associative hypothesis | |
| Causal hypothesis | |
| Null hypothesis | |
| Alternative hypothesis | |
| Working hypothesis | |
| Statistical hypothesis | |
| Logical hypothesis | |
| Hypothesis-testing | |
| Qualitative research questions | Qualitative research hypotheses |
| Contextual research questions | Hypothesis-generating |
| Descriptive research questions | |
| Evaluation research questions | |
| Explanatory research questions | |
| Exploratory research questions | |
| Generative research questions | |
| Ideological research questions | |
| Ethnographic research questions | |
| Phenomenological research questions | |
| Grounded theory questions | |
| Qualitative case study questions |
Research questions in quantitative research
In quantitative research, research questions inquire about the relationships among variables being investigated and are usually framed at the start of the study. These are precise and typically linked to the subject population, dependent and independent variables, and research design. 1 Research questions may also attempt to describe the behavior of a population in relation to one or more variables, or describe the characteristics of variables to be measured ( descriptive research questions ). 1 , 5 , 14 These questions may also aim to discover differences between groups within the context of an outcome variable ( comparative research questions ), 1 , 5 , 14 or elucidate trends and interactions among variables ( relationship research questions ). 1 , 5 We provide examples of descriptive, comparative, and relationship research questions in quantitative research in Table 2 .
| Quantitative research questions | |
|---|---|
| Descriptive research question | |
| - Measures responses of subjects to variables | |
| - Presents variables to measure, analyze, or assess | |
| What is the proportion of resident doctors in the hospital who have mastered ultrasonography (response of subjects to a variable) as a diagnostic technique in their clinical training? | |
| Comparative research question | |
| - Clarifies difference between one group with outcome variable and another group without outcome variable | |
| Is there a difference in the reduction of lung metastasis in osteosarcoma patients who received the vitamin D adjunctive therapy (group with outcome variable) compared with osteosarcoma patients who did not receive the vitamin D adjunctive therapy (group without outcome variable)? | |
| - Compares the effects of variables | |
| How does the vitamin D analogue 22-Oxacalcitriol (variable 1) mimic the antiproliferative activity of 1,25-Dihydroxyvitamin D (variable 2) in osteosarcoma cells? | |
| Relationship research question | |
| - Defines trends, association, relationships, or interactions between dependent variable and independent variable | |
| Is there a relationship between the number of medical student suicide (dependent variable) and the level of medical student stress (independent variable) in Japan during the first wave of the COVID-19 pandemic? | |
Hypotheses in quantitative research
In quantitative research, hypotheses predict the expected relationships among variables. 15 Relationships among variables that can be predicted include 1) between a single dependent variable and a single independent variable ( simple hypothesis ) or 2) between two or more independent and dependent variables ( complex hypothesis ). 4 , 11 Hypotheses may also specify the expected direction to be followed and imply an intellectual commitment to a particular outcome ( directional hypothesis ) 4 . On the other hand, hypotheses may not predict the exact direction and are used in the absence of a theory, or when findings contradict previous studies ( non-directional hypothesis ). 4 In addition, hypotheses can 1) define interdependency between variables ( associative hypothesis ), 4 2) propose an effect on the dependent variable from manipulation of the independent variable ( causal hypothesis ), 4 3) state a negative relationship between two variables ( null hypothesis ), 4 , 11 , 15 4) replace the working hypothesis if rejected ( alternative hypothesis ), 15 explain the relationship of phenomena to possibly generate a theory ( working hypothesis ), 11 5) involve quantifiable variables that can be tested statistically ( statistical hypothesis ), 11 6) or express a relationship whose interlinks can be verified logically ( logical hypothesis ). 11 We provide examples of simple, complex, directional, non-directional, associative, causal, null, alternative, working, statistical, and logical hypotheses in quantitative research, as well as the definition of quantitative hypothesis-testing research in Table 3 .
| Quantitative research hypotheses | |
|---|---|
| Simple hypothesis | |
| - Predicts relationship between single dependent variable and single independent variable | |
| If the dose of the new medication (single independent variable) is high, blood pressure (single dependent variable) is lowered. | |
| Complex hypothesis | |
| - Foretells relationship between two or more independent and dependent variables | |
| The higher the use of anticancer drugs, radiation therapy, and adjunctive agents (3 independent variables), the higher would be the survival rate (1 dependent variable). | |
| Directional hypothesis | |
| - Identifies study direction based on theory towards particular outcome to clarify relationship between variables | |
| Privately funded research projects will have a larger international scope (study direction) than publicly funded research projects. | |
| Non-directional hypothesis | |
| - Nature of relationship between two variables or exact study direction is not identified | |
| - Does not involve a theory | |
| Women and men are different in terms of helpfulness. (Exact study direction is not identified) | |
| Associative hypothesis | |
| - Describes variable interdependency | |
| - Change in one variable causes change in another variable | |
| A larger number of people vaccinated against COVID-19 in the region (change in independent variable) will reduce the region’s incidence of COVID-19 infection (change in dependent variable). | |
| Causal hypothesis | |
| - An effect on dependent variable is predicted from manipulation of independent variable | |
| A change into a high-fiber diet (independent variable) will reduce the blood sugar level (dependent variable) of the patient. | |
| Null hypothesis | |
| - A negative statement indicating no relationship or difference between 2 variables | |
| There is no significant difference in the severity of pulmonary metastases between the new drug (variable 1) and the current drug (variable 2). | |
| Alternative hypothesis | |
| - Following a null hypothesis, an alternative hypothesis predicts a relationship between 2 study variables | |
| The new drug (variable 1) is better on average in reducing the level of pain from pulmonary metastasis than the current drug (variable 2). | |
| Working hypothesis | |
| - A hypothesis that is initially accepted for further research to produce a feasible theory | |
| Dairy cows fed with concentrates of different formulations will produce different amounts of milk. | |
| Statistical hypothesis | |
| - Assumption about the value of population parameter or relationship among several population characteristics | |
| - Validity tested by a statistical experiment or analysis | |
| The mean recovery rate from COVID-19 infection (value of population parameter) is not significantly different between population 1 and population 2. | |
| There is a positive correlation between the level of stress at the workplace and the number of suicides (population characteristics) among working people in Japan. | |
| Logical hypothesis | |
| - Offers or proposes an explanation with limited or no extensive evidence | |
| If healthcare workers provide more educational programs about contraception methods, the number of adolescent pregnancies will be less. | |
| Hypothesis-testing (Quantitative hypothesis-testing research) | |
| - Quantitative research uses deductive reasoning. | |
| - This involves the formation of a hypothesis, collection of data in the investigation of the problem, analysis and use of the data from the investigation, and drawing of conclusions to validate or nullify the hypotheses. | |
Research questions in qualitative research
Unlike research questions in quantitative research, research questions in qualitative research are usually continuously reviewed and reformulated. The central question and associated subquestions are stated more than the hypotheses. 15 The central question broadly explores a complex set of factors surrounding the central phenomenon, aiming to present the varied perspectives of participants. 15
There are varied goals for which qualitative research questions are developed. These questions can function in several ways, such as to 1) identify and describe existing conditions ( contextual research question s); 2) describe a phenomenon ( descriptive research questions ); 3) assess the effectiveness of existing methods, protocols, theories, or procedures ( evaluation research questions ); 4) examine a phenomenon or analyze the reasons or relationships between subjects or phenomena ( explanatory research questions ); or 5) focus on unknown aspects of a particular topic ( exploratory research questions ). 5 In addition, some qualitative research questions provide new ideas for the development of theories and actions ( generative research questions ) or advance specific ideologies of a position ( ideological research questions ). 1 Other qualitative research questions may build on a body of existing literature and become working guidelines ( ethnographic research questions ). Research questions may also be broadly stated without specific reference to the existing literature or a typology of questions ( phenomenological research questions ), may be directed towards generating a theory of some process ( grounded theory questions ), or may address a description of the case and the emerging themes ( qualitative case study questions ). 15 We provide examples of contextual, descriptive, evaluation, explanatory, exploratory, generative, ideological, ethnographic, phenomenological, grounded theory, and qualitative case study research questions in qualitative research in Table 4 , and the definition of qualitative hypothesis-generating research in Table 5 .
| Qualitative research questions | |
|---|---|
| Contextual research question | |
| - Ask the nature of what already exists | |
| - Individuals or groups function to further clarify and understand the natural context of real-world problems | |
| What are the experiences of nurses working night shifts in healthcare during the COVID-19 pandemic? (natural context of real-world problems) | |
| Descriptive research question | |
| - Aims to describe a phenomenon | |
| What are the different forms of disrespect and abuse (phenomenon) experienced by Tanzanian women when giving birth in healthcare facilities? | |
| Evaluation research question | |
| - Examines the effectiveness of existing practice or accepted frameworks | |
| How effective are decision aids (effectiveness of existing practice) in helping decide whether to give birth at home or in a healthcare facility? | |
| Explanatory research question | |
| - Clarifies a previously studied phenomenon and explains why it occurs | |
| Why is there an increase in teenage pregnancy (phenomenon) in Tanzania? | |
| Exploratory research question | |
| - Explores areas that have not been fully investigated to have a deeper understanding of the research problem | |
| What factors affect the mental health of medical students (areas that have not yet been fully investigated) during the COVID-19 pandemic? | |
| Generative research question | |
| - Develops an in-depth understanding of people’s behavior by asking ‘how would’ or ‘what if’ to identify problems and find solutions | |
| How would the extensive research experience of the behavior of new staff impact the success of the novel drug initiative? | |
| Ideological research question | |
| - Aims to advance specific ideas or ideologies of a position | |
| Are Japanese nurses who volunteer in remote African hospitals able to promote humanized care of patients (specific ideas or ideologies) in the areas of safe patient environment, respect of patient privacy, and provision of accurate information related to health and care? | |
| Ethnographic research question | |
| - Clarifies peoples’ nature, activities, their interactions, and the outcomes of their actions in specific settings | |
| What are the demographic characteristics, rehabilitative treatments, community interactions, and disease outcomes (nature, activities, their interactions, and the outcomes) of people in China who are suffering from pneumoconiosis? | |
| Phenomenological research question | |
| - Knows more about the phenomena that have impacted an individual | |
| What are the lived experiences of parents who have been living with and caring for children with a diagnosis of autism? (phenomena that have impacted an individual) | |
| Grounded theory question | |
| - Focuses on social processes asking about what happens and how people interact, or uncovering social relationships and behaviors of groups | |
| What are the problems that pregnant adolescents face in terms of social and cultural norms (social processes), and how can these be addressed? | |
| Qualitative case study question | |
| - Assesses a phenomenon using different sources of data to answer “why” and “how” questions | |
| - Considers how the phenomenon is influenced by its contextual situation. | |
| How does quitting work and assuming the role of a full-time mother (phenomenon assessed) change the lives of women in Japan? | |
| Qualitative research hypotheses | |
|---|---|
| Hypothesis-generating (Qualitative hypothesis-generating research) | |
| - Qualitative research uses inductive reasoning. | |
| - This involves data collection from study participants or the literature regarding a phenomenon of interest, using the collected data to develop a formal hypothesis, and using the formal hypothesis as a framework for testing the hypothesis. | |
| - Qualitative exploratory studies explore areas deeper, clarifying subjective experience and allowing formulation of a formal hypothesis potentially testable in a future quantitative approach. | |
Qualitative studies usually pose at least one central research question and several subquestions starting with How or What . These research questions use exploratory verbs such as explore or describe . These also focus on one central phenomenon of interest, and may mention the participants and research site. 15
Hypotheses in qualitative research
Hypotheses in qualitative research are stated in the form of a clear statement concerning the problem to be investigated. Unlike in quantitative research where hypotheses are usually developed to be tested, qualitative research can lead to both hypothesis-testing and hypothesis-generating outcomes. 2 When studies require both quantitative and qualitative research questions, this suggests an integrative process between both research methods wherein a single mixed-methods research question can be developed. 1
FRAMEWORKS FOR DEVELOPING RESEARCH QUESTIONS AND HYPOTHESES
Research questions followed by hypotheses should be developed before the start of the study. 1 , 12 , 14 It is crucial to develop feasible research questions on a topic that is interesting to both the researcher and the scientific community. This can be achieved by a meticulous review of previous and current studies to establish a novel topic. Specific areas are subsequently focused on to generate ethical research questions. The relevance of the research questions is evaluated in terms of clarity of the resulting data, specificity of the methodology, objectivity of the outcome, depth of the research, and impact of the study. 1 , 5 These aspects constitute the FINER criteria (i.e., Feasible, Interesting, Novel, Ethical, and Relevant). 1 Clarity and effectiveness are achieved if research questions meet the FINER criteria. In addition to the FINER criteria, Ratan et al. described focus, complexity, novelty, feasibility, and measurability for evaluating the effectiveness of research questions. 14
The PICOT and PEO frameworks are also used when developing research questions. 1 The following elements are addressed in these frameworks, PICOT: P-population/patients/problem, I-intervention or indicator being studied, C-comparison group, O-outcome of interest, and T-timeframe of the study; PEO: P-population being studied, E-exposure to preexisting conditions, and O-outcome of interest. 1 Research questions are also considered good if these meet the “FINERMAPS” framework: Feasible, Interesting, Novel, Ethical, Relevant, Manageable, Appropriate, Potential value/publishable, and Systematic. 14
As we indicated earlier, research questions and hypotheses that are not carefully formulated result in unethical studies or poor outcomes. To illustrate this, we provide some examples of ambiguous research question and hypotheses that result in unclear and weak research objectives in quantitative research ( Table 6 ) 16 and qualitative research ( Table 7 ) 17 , and how to transform these ambiguous research question(s) and hypothesis(es) into clear and good statements.
| Variables | Unclear and weak statement (Statement 1) | Clear and good statement (Statement 2) | Points to avoid |
|---|---|---|---|
| Research question | Which is more effective between smoke moxibustion and smokeless moxibustion? | “Moreover, regarding smoke moxibustion versus smokeless moxibustion, it remains unclear which is more effective, safe, and acceptable to pregnant women, and whether there is any difference in the amount of heat generated.” | 1) Vague and unfocused questions |
| 2) Closed questions simply answerable by yes or no | |||
| 3) Questions requiring a simple choice | |||
| Hypothesis | The smoke moxibustion group will have higher cephalic presentation. | “Hypothesis 1. The smoke moxibustion stick group (SM group) and smokeless moxibustion stick group (-SLM group) will have higher rates of cephalic presentation after treatment than the control group. | 1) Unverifiable hypotheses |
| Hypothesis 2. The SM group and SLM group will have higher rates of cephalic presentation at birth than the control group. | 2) Incompletely stated groups of comparison | ||
| Hypothesis 3. There will be no significant differences in the well-being of the mother and child among the three groups in terms of the following outcomes: premature birth, premature rupture of membranes (PROM) at < 37 weeks, Apgar score < 7 at 5 min, umbilical cord blood pH < 7.1, admission to neonatal intensive care unit (NICU), and intrauterine fetal death.” | 3) Insufficiently described variables or outcomes | ||
| Research objective | To determine which is more effective between smoke moxibustion and smokeless moxibustion. | “The specific aims of this pilot study were (a) to compare the effects of smoke moxibustion and smokeless moxibustion treatments with the control group as a possible supplement to ECV for converting breech presentation to cephalic presentation and increasing adherence to the newly obtained cephalic position, and (b) to assess the effects of these treatments on the well-being of the mother and child.” | 1) Poor understanding of the research question and hypotheses |
| 2) Insufficient description of population, variables, or study outcomes |
a These statements were composed for comparison and illustrative purposes only.
b These statements are direct quotes from Higashihara and Horiuchi. 16
| Variables | Unclear and weak statement (Statement 1) | Clear and good statement (Statement 2) | Points to avoid |
|---|---|---|---|
| Research question | Does disrespect and abuse (D&A) occur in childbirth in Tanzania? | How does disrespect and abuse (D&A) occur and what are the types of physical and psychological abuses observed in midwives’ actual care during facility-based childbirth in urban Tanzania? | 1) Ambiguous or oversimplistic questions |
| 2) Questions unverifiable by data collection and analysis | |||
| Hypothesis | Disrespect and abuse (D&A) occur in childbirth in Tanzania. | Hypothesis 1: Several types of physical and psychological abuse by midwives in actual care occur during facility-based childbirth in urban Tanzania. | 1) Statements simply expressing facts |
| Hypothesis 2: Weak nursing and midwifery management contribute to the D&A of women during facility-based childbirth in urban Tanzania. | 2) Insufficiently described concepts or variables | ||
| Research objective | To describe disrespect and abuse (D&A) in childbirth in Tanzania. | “This study aimed to describe from actual observations the respectful and disrespectful care received by women from midwives during their labor period in two hospitals in urban Tanzania.” | 1) Statements unrelated to the research question and hypotheses |
| 2) Unattainable or unexplorable objectives |
a This statement is a direct quote from Shimoda et al. 17
The other statements were composed for comparison and illustrative purposes only.
CONSTRUCTING RESEARCH QUESTIONS AND HYPOTHESES
To construct effective research questions and hypotheses, it is very important to 1) clarify the background and 2) identify the research problem at the outset of the research, within a specific timeframe. 9 Then, 3) review or conduct preliminary research to collect all available knowledge about the possible research questions by studying theories and previous studies. 18 Afterwards, 4) construct research questions to investigate the research problem. Identify variables to be accessed from the research questions 4 and make operational definitions of constructs from the research problem and questions. Thereafter, 5) construct specific deductive or inductive predictions in the form of hypotheses. 4 Finally, 6) state the study aims . This general flow for constructing effective research questions and hypotheses prior to conducting research is shown in Fig. 1 .

Research questions are used more frequently in qualitative research than objectives or hypotheses. 3 These questions seek to discover, understand, explore or describe experiences by asking “What” or “How.” The questions are open-ended to elicit a description rather than to relate variables or compare groups. The questions are continually reviewed, reformulated, and changed during the qualitative study. 3 Research questions are also used more frequently in survey projects than hypotheses in experiments in quantitative research to compare variables and their relationships.
Hypotheses are constructed based on the variables identified and as an if-then statement, following the template, ‘If a specific action is taken, then a certain outcome is expected.’ At this stage, some ideas regarding expectations from the research to be conducted must be drawn. 18 Then, the variables to be manipulated (independent) and influenced (dependent) are defined. 4 Thereafter, the hypothesis is stated and refined, and reproducible data tailored to the hypothesis are identified, collected, and analyzed. 4 The hypotheses must be testable and specific, 18 and should describe the variables and their relationships, the specific group being studied, and the predicted research outcome. 18 Hypotheses construction involves a testable proposition to be deduced from theory, and independent and dependent variables to be separated and measured separately. 3 Therefore, good hypotheses must be based on good research questions constructed at the start of a study or trial. 12
In summary, research questions are constructed after establishing the background of the study. Hypotheses are then developed based on the research questions. Thus, it is crucial to have excellent research questions to generate superior hypotheses. In turn, these would determine the research objectives and the design of the study, and ultimately, the outcome of the research. 12 Algorithms for building research questions and hypotheses are shown in Fig. 2 for quantitative research and in Fig. 3 for qualitative research.

EXAMPLES OF RESEARCH QUESTIONS FROM PUBLISHED ARTICLES
- EXAMPLE 1. Descriptive research question (quantitative research)
- - Presents research variables to be assessed (distinct phenotypes and subphenotypes)
- “BACKGROUND: Since COVID-19 was identified, its clinical and biological heterogeneity has been recognized. Identifying COVID-19 phenotypes might help guide basic, clinical, and translational research efforts.
- RESEARCH QUESTION: Does the clinical spectrum of patients with COVID-19 contain distinct phenotypes and subphenotypes? ” 19
- EXAMPLE 2. Relationship research question (quantitative research)
- - Shows interactions between dependent variable (static postural control) and independent variable (peripheral visual field loss)
- “Background: Integration of visual, vestibular, and proprioceptive sensations contributes to postural control. People with peripheral visual field loss have serious postural instability. However, the directional specificity of postural stability and sensory reweighting caused by gradual peripheral visual field loss remain unclear.
- Research question: What are the effects of peripheral visual field loss on static postural control ?” 20
- EXAMPLE 3. Comparative research question (quantitative research)
- - Clarifies the difference among groups with an outcome variable (patients enrolled in COMPERA with moderate PH or severe PH in COPD) and another group without the outcome variable (patients with idiopathic pulmonary arterial hypertension (IPAH))
- “BACKGROUND: Pulmonary hypertension (PH) in COPD is a poorly investigated clinical condition.
- RESEARCH QUESTION: Which factors determine the outcome of PH in COPD?
- STUDY DESIGN AND METHODS: We analyzed the characteristics and outcome of patients enrolled in the Comparative, Prospective Registry of Newly Initiated Therapies for Pulmonary Hypertension (COMPERA) with moderate or severe PH in COPD as defined during the 6th PH World Symposium who received medical therapy for PH and compared them with patients with idiopathic pulmonary arterial hypertension (IPAH) .” 21
- EXAMPLE 4. Exploratory research question (qualitative research)
- - Explores areas that have not been fully investigated (perspectives of families and children who receive care in clinic-based child obesity treatment) to have a deeper understanding of the research problem
- “Problem: Interventions for children with obesity lead to only modest improvements in BMI and long-term outcomes, and data are limited on the perspectives of families of children with obesity in clinic-based treatment. This scoping review seeks to answer the question: What is known about the perspectives of families and children who receive care in clinic-based child obesity treatment? This review aims to explore the scope of perspectives reported by families of children with obesity who have received individualized outpatient clinic-based obesity treatment.” 22
- EXAMPLE 5. Relationship research question (quantitative research)
- - Defines interactions between dependent variable (use of ankle strategies) and independent variable (changes in muscle tone)
- “Background: To maintain an upright standing posture against external disturbances, the human body mainly employs two types of postural control strategies: “ankle strategy” and “hip strategy.” While it has been reported that the magnitude of the disturbance alters the use of postural control strategies, it has not been elucidated how the level of muscle tone, one of the crucial parameters of bodily function, determines the use of each strategy. We have previously confirmed using forward dynamics simulations of human musculoskeletal models that an increased muscle tone promotes the use of ankle strategies. The objective of the present study was to experimentally evaluate a hypothesis: an increased muscle tone promotes the use of ankle strategies. Research question: Do changes in the muscle tone affect the use of ankle strategies ?” 23
EXAMPLES OF HYPOTHESES IN PUBLISHED ARTICLES
- EXAMPLE 1. Working hypothesis (quantitative research)
- - A hypothesis that is initially accepted for further research to produce a feasible theory
- “As fever may have benefit in shortening the duration of viral illness, it is plausible to hypothesize that the antipyretic efficacy of ibuprofen may be hindering the benefits of a fever response when taken during the early stages of COVID-19 illness .” 24
- “In conclusion, it is plausible to hypothesize that the antipyretic efficacy of ibuprofen may be hindering the benefits of a fever response . The difference in perceived safety of these agents in COVID-19 illness could be related to the more potent efficacy to reduce fever with ibuprofen compared to acetaminophen. Compelling data on the benefit of fever warrant further research and review to determine when to treat or withhold ibuprofen for early stage fever for COVID-19 and other related viral illnesses .” 24
- EXAMPLE 2. Exploratory hypothesis (qualitative research)
- - Explores particular areas deeper to clarify subjective experience and develop a formal hypothesis potentially testable in a future quantitative approach
- “We hypothesized that when thinking about a past experience of help-seeking, a self distancing prompt would cause increased help-seeking intentions and more favorable help-seeking outcome expectations .” 25
- “Conclusion
- Although a priori hypotheses were not supported, further research is warranted as results indicate the potential for using self-distancing approaches to increasing help-seeking among some people with depressive symptomatology.” 25
- EXAMPLE 3. Hypothesis-generating research to establish a framework for hypothesis testing (qualitative research)
- “We hypothesize that compassionate care is beneficial for patients (better outcomes), healthcare systems and payers (lower costs), and healthcare providers (lower burnout). ” 26
- Compassionomics is the branch of knowledge and scientific study of the effects of compassionate healthcare. Our main hypotheses are that compassionate healthcare is beneficial for (1) patients, by improving clinical outcomes, (2) healthcare systems and payers, by supporting financial sustainability, and (3) HCPs, by lowering burnout and promoting resilience and well-being. The purpose of this paper is to establish a scientific framework for testing the hypotheses above . If these hypotheses are confirmed through rigorous research, compassionomics will belong in the science of evidence-based medicine, with major implications for all healthcare domains.” 26
- EXAMPLE 4. Statistical hypothesis (quantitative research)
- - An assumption is made about the relationship among several population characteristics ( gender differences in sociodemographic and clinical characteristics of adults with ADHD ). Validity is tested by statistical experiment or analysis ( chi-square test, Students t-test, and logistic regression analysis)
- “Our research investigated gender differences in sociodemographic and clinical characteristics of adults with ADHD in a Japanese clinical sample. Due to unique Japanese cultural ideals and expectations of women's behavior that are in opposition to ADHD symptoms, we hypothesized that women with ADHD experience more difficulties and present more dysfunctions than men . We tested the following hypotheses: first, women with ADHD have more comorbidities than men with ADHD; second, women with ADHD experience more social hardships than men, such as having less full-time employment and being more likely to be divorced.” 27
- “Statistical Analysis
- ( text omitted ) Between-gender comparisons were made using the chi-squared test for categorical variables and Students t-test for continuous variables…( text omitted ). A logistic regression analysis was performed for employment status, marital status, and comorbidity to evaluate the independent effects of gender on these dependent variables.” 27
EXAMPLES OF HYPOTHESIS AS WRITTEN IN PUBLISHED ARTICLES IN RELATION TO OTHER PARTS
- EXAMPLE 1. Background, hypotheses, and aims are provided
- “Pregnant women need skilled care during pregnancy and childbirth, but that skilled care is often delayed in some countries …( text omitted ). The focused antenatal care (FANC) model of WHO recommends that nurses provide information or counseling to all pregnant women …( text omitted ). Job aids are visual support materials that provide the right kind of information using graphics and words in a simple and yet effective manner. When nurses are not highly trained or have many work details to attend to, these job aids can serve as a content reminder for the nurses and can be used for educating their patients (Jennings, Yebadokpo, Affo, & Agbogbe, 2010) ( text omitted ). Importantly, additional evidence is needed to confirm how job aids can further improve the quality of ANC counseling by health workers in maternal care …( text omitted )” 28
- “ This has led us to hypothesize that the quality of ANC counseling would be better if supported by job aids. Consequently, a better quality of ANC counseling is expected to produce higher levels of awareness concerning the danger signs of pregnancy and a more favorable impression of the caring behavior of nurses .” 28
- “This study aimed to examine the differences in the responses of pregnant women to a job aid-supported intervention during ANC visit in terms of 1) their understanding of the danger signs of pregnancy and 2) their impression of the caring behaviors of nurses to pregnant women in rural Tanzania.” 28
- EXAMPLE 2. Background, hypotheses, and aims are provided
- “We conducted a two-arm randomized controlled trial (RCT) to evaluate and compare changes in salivary cortisol and oxytocin levels of first-time pregnant women between experimental and control groups. The women in the experimental group touched and held an infant for 30 min (experimental intervention protocol), whereas those in the control group watched a DVD movie of an infant (control intervention protocol). The primary outcome was salivary cortisol level and the secondary outcome was salivary oxytocin level.” 29
- “ We hypothesize that at 30 min after touching and holding an infant, the salivary cortisol level will significantly decrease and the salivary oxytocin level will increase in the experimental group compared with the control group .” 29
- EXAMPLE 3. Background, aim, and hypothesis are provided
- “In countries where the maternal mortality ratio remains high, antenatal education to increase Birth Preparedness and Complication Readiness (BPCR) is considered one of the top priorities [1]. BPCR includes birth plans during the antenatal period, such as the birthplace, birth attendant, transportation, health facility for complications, expenses, and birth materials, as well as family coordination to achieve such birth plans. In Tanzania, although increasing, only about half of all pregnant women attend an antenatal clinic more than four times [4]. Moreover, the information provided during antenatal care (ANC) is insufficient. In the resource-poor settings, antenatal group education is a potential approach because of the limited time for individual counseling at antenatal clinics.” 30
- “This study aimed to evaluate an antenatal group education program among pregnant women and their families with respect to birth-preparedness and maternal and infant outcomes in rural villages of Tanzania.” 30
- “ The study hypothesis was if Tanzanian pregnant women and their families received a family-oriented antenatal group education, they would (1) have a higher level of BPCR, (2) attend antenatal clinic four or more times, (3) give birth in a health facility, (4) have less complications of women at birth, and (5) have less complications and deaths of infants than those who did not receive the education .” 30
Research questions and hypotheses are crucial components to any type of research, whether quantitative or qualitative. These questions should be developed at the very beginning of the study. Excellent research questions lead to superior hypotheses, which, like a compass, set the direction of research, and can often determine the successful conduct of the study. Many research studies have floundered because the development of research questions and subsequent hypotheses was not given the thought and meticulous attention needed. The development of research questions and hypotheses is an iterative process based on extensive knowledge of the literature and insightful grasp of the knowledge gap. Focused, concise, and specific research questions provide a strong foundation for constructing hypotheses which serve as formal predictions about the research outcomes. Research questions and hypotheses are crucial elements of research that should not be overlooked. They should be carefully thought of and constructed when planning research. This avoids unethical studies and poor outcomes by defining well-founded objectives that determine the design, course, and outcome of the study.
Disclosure: The authors have no potential conflicts of interest to disclose.
Author Contributions:
- Conceptualization: Barroga E, Matanguihan GJ.
- Methodology: Barroga E, Matanguihan GJ.
- Writing - original draft: Barroga E, Matanguihan GJ.
- Writing - review & editing: Barroga E, Matanguihan GJ.

Quantitative and Qualitative Research
- I NEED TO . . .
What is Quantitative Research?
- What is Qualitative Research?
- Quantitative vs Qualitative
- Step 1: Accessing CINAHL
- Step 2: Create a Keyword Search
- Step 3: Create a Subject Heading Search
- Step 4: Repeat Steps 1-3 for Second Concept
- Step 5: Repeat Steps 1-3 for Quantitative Terms
- Step 6: Combining All Searches
- Step 7: Adding Limiters
- Step 8: Save Your Search!
- What Kind of Article is This?
- More Research Help This link opens in a new window
Quantitative methodology is the dominant research framework in the social sciences. It refers to a set of strategies, techniques and assumptions used to study psychological, social and economic processes through the exploration of numeric patterns . Quantitative research gathers a range of numeric data. Some of the numeric data is intrinsically quantitative (e.g. personal income), while in other cases the numeric structure is imposed (e.g. ‘On a scale from 1 to 10, how depressed did you feel last week?’). The collection of quantitative information allows researchers to conduct simple to extremely sophisticated statistical analyses that aggregate the data (e.g. averages, percentages), show relationships among the data (e.g. ‘Students with lower grade point averages tend to score lower on a depression scale’) or compare across aggregated data (e.g. the USA has a higher gross domestic product than Spain). Quantitative research includes methodologies such as questionnaires, structured observations or experiments and stands in contrast to qualitative research. Qualitative research involves the collection and analysis of narratives and/or open-ended observations through methodologies such as interviews, focus groups or ethnographies.
Coghlan, D., Brydon-Miller, M. (2014). The SAGE encyclopedia of action research (Vols. 1-2). London, : SAGE Publications Ltd doi: 10.4135/9781446294406
What is the purpose of quantitative research?
The purpose of quantitative research is to generate knowledge and create understanding about the social world. Quantitative research is used by social scientists, including communication researchers, to observe phenomena or occurrences affecting individuals. Social scientists are concerned with the study of people. Quantitative research is a way to learn about a particular group of people, known as a sample population. Using scientific inquiry, quantitative research relies on data that are observed or measured to examine questions about the sample population.
Allen, M. (2017). The SAGE encyclopedia of communication research methods (Vols. 1-4). Thousand Oaks, CA: SAGE Publications, Inc doi: 10.4135/9781483381411
How do I know if the study is a quantitative design? What type of quantitative study is it?
Quantitative Research Designs: Descriptive non-experimental, Quasi-experimental or Experimental?
Studies do not always explicitly state what kind of research design is being used. You will need to know how to decipher which design type is used. The following video will help you determine the quantitative design type.
- << Previous: I NEED TO . . .
- Next: What is Qualitative Research? >>
- Last Updated: Jun 12, 2024 8:56 AM
- URL: https://libguides.uta.edu/quantitative_and_qualitative_research
University of Texas Arlington Libraries 702 Planetarium Place · Arlington, TX 76019 · 817-272-3000
- Internet Privacy
- Accessibility
- Problems with a guide? Contact Us.
- Skip to main content
- Skip to primary sidebar
- Skip to footer
- QuestionPro

- Solutions Industries Gaming Automotive Sports and events Education Government Travel & Hospitality Financial Services Healthcare Cannabis Technology Use Case NPS+ Communities Audience Contactless surveys Mobile LivePolls Member Experience GDPR Positive People Science 360 Feedback Surveys
- Resources Blog eBooks Survey Templates Case Studies Training Help center
Home Market Research
Quantitative Research: What It Is, Practices & Methods

Quantitative research involves analyzing and gathering numerical data to uncover trends, calculate averages, evaluate relationships, and derive overarching insights. It’s used in various fields, including the natural and social sciences. Quantitative data analysis employs statistical techniques for processing and interpreting numeric data.
Research designs in the quantitative realm outline how data will be collected and analyzed with methods like experiments and surveys. Qualitative methods complement quantitative research by focusing on non-numerical data, adding depth to understanding. Data collection methods can be qualitative or quantitative, depending on research goals. Researchers often use a combination of both approaches to gain a comprehensive understanding of phenomena.
What is Quantitative Research?
Quantitative research is a systematic investigation of phenomena by gathering quantifiable data and performing statistical, mathematical, or computational techniques. Quantitative research collects statistically significant information from existing and potential customers using sampling methods and sending out online surveys , online polls , and questionnaires , for example.
One of the main characteristics of this type of research is that the results can be depicted in numerical form. After carefully collecting structured observations and understanding these numbers, it’s possible to predict the future of a product or service, establish causal relationships or Causal Research , and make changes accordingly. Quantitative research primarily centers on the analysis of numerical data and utilizes inferential statistics to derive conclusions that can be extrapolated to the broader population.
An example of a quantitative research study is the survey conducted to understand how long a doctor takes to tend to a patient when the patient walks into the hospital. A patient satisfaction survey can be administered to ask questions like how long a doctor takes to see a patient, how often a patient walks into a hospital, and other such questions, which are dependent variables in the research. This kind of research method is often employed in the social sciences, and it involves using mathematical frameworks and theories to effectively present data, ensuring that the results are logical, statistically sound, and unbiased.
Data collection in quantitative research uses a structured method and is typically conducted on larger samples representing the entire population. Researchers use quantitative methods to collect numerical data, which is then subjected to statistical analysis to determine statistically significant findings. This approach is valuable in both experimental research and social research, as it helps in making informed decisions and drawing reliable conclusions based on quantitative data.
Quantitative Research Characteristics
Quantitative research has several unique characteristics that make it well-suited for specific projects. Let’s explore the most crucial of these characteristics so that you can consider them when planning your next research project:

- Structured tools: Quantitative research relies on structured tools such as surveys, polls, or questionnaires to gather quantitative data . Using such structured methods helps collect in-depth and actionable numerical data from the survey respondents, making it easier to perform data analysis.
- Sample size: Quantitative research is conducted on a significant sample size representing the target market . Appropriate Survey Sampling methods, a fundamental aspect of quantitative research methods, must be employed when deriving the sample to fortify the research objective and ensure the reliability of the results.
- Close-ended questions: Closed-ended questions , specifically designed to align with the research objectives, are a cornerstone of quantitative research. These questions facilitate the collection of quantitative data and are extensively used in data collection processes.
- Prior studies: Before collecting feedback from respondents, researchers often delve into previous studies related to the research topic. This preliminary research helps frame the study effectively and ensures the data collection process is well-informed.
- Quantitative data: Typically, quantitative data is represented using tables, charts, graphs, or other numerical forms. This visual representation aids in understanding the collected data and is essential for rigorous data analysis, a key component of quantitative research methods.
- Generalization of results: One of the strengths of quantitative research is its ability to generalize results to the entire population. It means that the findings derived from a sample can be extrapolated to make informed decisions and take appropriate actions for improvement based on numerical data analysis.
Quantitative Research Methods
Quantitative research methods are systematic approaches used to gather and analyze numerical data to understand and draw conclusions about a phenomenon or population. Here are the quantitative research methods:
- Primary quantitative research methods
- Secondary quantitative research methods
Primary Quantitative Research Methods
Primary quantitative research is the most widely used method of conducting market research. The distinct feature of primary research is that the researcher focuses on collecting data directly rather than depending on data collected from previously done research. Primary quantitative research design can be broken down into three further distinctive tracks and the process flow. They are:
A. Techniques and Types of Studies
There are multiple types of primary quantitative research. They can be distinguished into the four following distinctive methods, which are:
01. Survey Research
Survey Research is fundamental for all quantitative outcome research methodologies and studies. Surveys are used to ask questions to a sample of respondents, using various types such as online polls, online surveys, paper questionnaires, web-intercept surveys , etc. Every small and big organization intends to understand what their customers think about their products and services, how well new features are faring in the market, and other such details.
By conducting survey research, an organization can ask multiple survey questions , collect data from a pool of customers, and analyze this collected data to produce numerical results. It is the first step towards collecting data for any research. You can use single ease questions . A single-ease question is a straightforward query that elicits a concise and uncomplicated response.
This type of research can be conducted with a specific target audience group and also can be conducted across multiple groups along with comparative analysis . A prerequisite for this type of research is that the sample of respondents must have randomly selected members. This way, a researcher can easily maintain the accuracy of the obtained results as a huge variety of respondents will be addressed using random selection.
Traditionally, survey research was conducted face-to-face or via phone calls. Still, with the progress made by online mediums such as email or social media, survey research has also spread to online mediums.There are two types of surveys , either of which can be chosen based on the time in hand and the kind of data required:
Cross-sectional surveys: Cross-sectional surveys are observational surveys conducted in situations where the researcher intends to collect data from a sample of the target population at a given point in time. Researchers can evaluate various variables at a particular time. Data gathered using this type of survey is from people who depict similarity in all variables except the variables which are considered for research . Throughout the survey, this one variable will stay constant.
- Cross-sectional surveys are popular with retail, SMEs, and healthcare industries. Information is garnered without modifying any parameters in the variable ecosystem.
- Multiple samples can be analyzed and compared using a cross-sectional survey research method.
- Multiple variables can be evaluated using this type of survey research.
- The only disadvantage of cross-sectional surveys is that the cause-effect relationship of variables cannot be established as it usually evaluates variables at a particular time and not across a continuous time frame.
Longitudinal surveys: Longitudinal surveys are also observational surveys , but unlike cross-sectional surveys, longitudinal surveys are conducted across various time durations to observe a change in respondent behavior and thought processes. This time can be days, months, years, or even decades. For instance, a researcher planning to analyze the change in buying habits of teenagers over 5 years will conduct longitudinal surveys.
- In cross-sectional surveys, the same variables were evaluated at a given time, and in longitudinal surveys, different variables can be analyzed at different intervals.
- Longitudinal surveys are extensively used in the field of medicine and applied sciences. Apart from these two fields, they are also used to observe a change in the market trend analysis , analyze customer satisfaction, or gain feedback on products/services.
- In situations where the sequence of events is highly essential, longitudinal surveys are used.
- Researchers say that when research subjects need to be thoroughly inspected before concluding, they rely on longitudinal surveys.
02. Correlational Research
A comparison between two entities is invariable. Correlation research is conducted to establish a relationship between two closely-knit entities and how one impacts the other, and what changes are eventually observed. This research method is carried out to give value to naturally occurring relationships, and a minimum of two different groups are required to conduct this quantitative research method successfully. Without assuming various aspects, a relationship between two groups or entities must be established.
Researchers use this quantitative research design to correlate two or more variables using mathematical analysis methods. Patterns, relationships, and trends between variables are concluded as they exist in their original setup. The impact of one of these variables on the other is observed, along with how it changes the relationship between the two variables. Researchers tend to manipulate one of the variables to attain the desired results.
Ideally, it is advised not to make conclusions merely based on correlational research. This is because it is not mandatory that if two variables are in sync that they are interrelated.
Example of Correlational Research Questions :
- The relationship between stress and depression.
- The equation between fame and money.
- The relation between activities in a third-grade class and its students.
03. Causal-comparative Research
This research method mainly depends on the factor of comparison. Also called quasi-experimental research , this quantitative research method is used by researchers to conclude the cause-effect equation between two or more variables, where one variable is dependent on the other independent variable. The independent variable is established but not manipulated, and its impact on the dependent variable is observed. These variables or groups must be formed as they exist in the natural setup. As the dependent and independent variables will always exist in a group, it is advised that the conclusions are carefully established by keeping all the factors in mind.
Causal-comparative research is not restricted to the statistical analysis of two variables but extends to analyzing how various variables or groups change under the influence of the same changes. This research is conducted irrespective of the type of relationship that exists between two or more variables. Statistical analysis plan is used to present the outcome using this quantitative research method.
Example of Causal-Comparative Research Questions:
- The impact of drugs on a teenager. The effect of good education on a freshman. The effect of substantial food provision in the villages of Africa.
04. Experimental Research
Also known as true experimentation, this research method relies on a theory. As the name suggests, experimental research is usually based on one or more theories. This theory has yet to be proven before and is merely a supposition. In experimental research, an analysis is done around proving or disproving the statement. This research method is used in natural sciences. Traditional research methods are more effective than modern techniques.
There can be multiple theories in experimental research. A theory is a statement that can be verified or refuted.
After establishing the statement, efforts are made to understand whether it is valid or invalid. This quantitative research method is mainly used in natural or social sciences as various statements must be proved right or wrong.
- Traditional research methods are more effective than modern techniques.
- Systematic teaching schedules help children who struggle to cope with the course.
- It is a boon to have responsible nursing staff for ailing parents.
B. Data Collection Methodologies
The second major step in primary quantitative research is data collection. Data collection can be divided into sampling methods and data collection using surveys and polls.
01. Data Collection Methodologies: Sampling Methods
There are two main sampling methods for quantitative research: Probability and Non-probability sampling .
Probability sampling: A theory of probability is used to filter individuals from a population and create samples in probability sampling . Participants of a sample are chosen by random selection processes. Each target audience member has an equal opportunity to be selected in the sample.
There are four main types of probability sampling:
- Simple random sampling: As the name indicates, simple random sampling is nothing but a random selection of elements for a sample. This sampling technique is implemented where the target population is considerably large.
- Stratified random sampling: In the stratified random sampling method , a large population is divided into groups (strata), and members of a sample are chosen randomly from these strata. The various segregated strata should ideally not overlap one another.
- Cluster sampling: Cluster sampling is a probability sampling method using which the main segment is divided into clusters, usually using geographic segmentation and demographic segmentation parameters.
- Systematic sampling: Systematic sampling is a technique where the starting point of the sample is chosen randomly, and all the other elements are chosen using a fixed interval. This interval is calculated by dividing the population size by the target sample size.
Non-probability sampling: Non-probability sampling is where the researcher’s knowledge and experience are used to create samples. Because of the researcher’s involvement, not all the target population members have an equal probability of being selected to be a part of a sample.
There are five non-probability sampling models:
- Convenience sampling: In convenience sampling , elements of a sample are chosen only due to one prime reason: their proximity to the researcher. These samples are quick and easy to implement as there is no other parameter of selection involved.
- Consecutive sampling: Consecutive sampling is quite similar to convenience sampling, except for the fact that researchers can choose a single element or a group of samples and conduct research consecutively over a significant period and then perform the same process with other samples.
- Quota sampling: Using quota sampling , researchers can select elements using their knowledge of target traits and personalities to form strata. Members of various strata can then be chosen to be a part of the sample as per the researcher’s understanding.
- Snowball sampling: Snowball sampling is conducted with target audiences who are difficult to contact and get information. It is popular in cases where the target audience for analysis research is rare to put together.
- Judgmental sampling: Judgmental sampling is a non-probability sampling method where samples are created only based on the researcher’s experience and research skill .
02. Data collection methodologies: Using surveys & polls
Once the sample is determined, then either surveys or polls can be distributed to collect the data for quantitative research.
Using surveys for primary quantitative research
A survey is defined as a research method used for collecting data from a pre-defined group of respondents to gain information and insights on various topics of interest. The ease of survey distribution and the wide number of people it can reach depending on the research time and objective makes it one of the most important aspects of conducting quantitative research.
Fundamental levels of measurement – nominal, ordinal, interval, and ratio scales
Four measurement scales are fundamental to creating a multiple-choice question in a survey. They are nominal, ordinal, interval, and ratio measurement scales without the fundamentals of which no multiple-choice questions can be created. Hence, it is crucial to understand these measurement levels to develop a robust survey.
Use of different question types
To conduct quantitative research, close-ended questions must be used in a survey. They can be a mix of multiple question types, including multiple-choice questions like semantic differential scale questions , rating scale questions , etc.
Survey Distribution and Survey Data Collection
In the above, we have seen the process of building a survey along with the research design to conduct primary quantitative research. Survey distribution to collect data is the other important aspect of the survey process. There are different ways of survey distribution. Some of the most commonly used methods are:
- Email: Sending a survey via email is the most widely used and effective survey distribution method. This method’s response rate is high because the respondents know your brand. You can use the QuestionPro email management feature to send out and collect survey responses.
- Buy respondents: Another effective way to distribute a survey and conduct primary quantitative research is to use a sample. Since the respondents are knowledgeable and are on the panel by their own will, responses are much higher.
- Embed survey on a website: Embedding a survey on a website increases a high number of responses as the respondent is already in close proximity to the brand when the survey pops up.
- Social distribution: Using social media to distribute the survey aids in collecting a higher number of responses from the people that are aware of the brand.
- QR code: QuestionPro QR codes store the URL for the survey. You can print/publish this code in magazines, signs, business cards, or on just about any object/medium.
- SMS survey: The SMS survey is a quick and time-effective way to collect a high number of responses.
- Offline Survey App: The QuestionPro App allows users to circulate surveys quickly, and the responses can be collected both online and offline.
Survey example
An example of a survey is a short customer satisfaction (CSAT) survey that can quickly be built and deployed to collect feedback about what the customer thinks about a brand and how satisfied and referenceable the brand is.
Using polls for primary quantitative research
Polls are a method to collect feedback using close-ended questions from a sample. The most commonly used types of polls are election polls and exit polls . Both of these are used to collect data from a large sample size but using basic question types like multiple-choice questions.
C. Data Analysis Techniques
The third aspect of primary quantitative research design is data analysis . After collecting raw data, there must be an analysis of this data to derive statistical inferences from this research. It is important to relate the results to the research objective and establish the statistical relevance of the results.
Remember to consider aspects of research that were not considered for the data collection process and report the difference between what was planned vs. what was actually executed.
It is then required to select precise Statistical Analysis Methods , such as SWOT, Conjoint, Cross-tabulation, etc., to analyze the quantitative data.
- SWOT analysis: SWOT Analysis stands for the acronym of Strengths, Weaknesses, Opportunities, and Threat analysis. Organizations use this statistical analysis technique to evaluate their performance internally and externally to develop effective strategies for improvement.
- Conjoint Analysis: Conjoint Analysis is a market analysis method to learn how individuals make complicated purchasing decisions. Trade-offs are involved in an individual’s daily activities, and these reflect their ability to decide from a complex list of product/service options.
- Cross-tabulation: Cross-tabulation is one of the preliminary statistical market analysis methods which establishes relationships, patterns, and trends within the various parameters of the research study.
- TURF Analysis: TURF Analysis , an acronym for Totally Unduplicated Reach and Frequency Analysis, is executed in situations where the reach of a favorable communication source is to be analyzed along with the frequency of this communication. It is used for understanding the potential of a target market.
Inferential statistics methods such as confidence interval, the margin of error, etc., can then be used to provide results.
Secondary Quantitative Research Methods
Secondary quantitative research or desk research is a research method that involves using already existing data or secondary data. Existing data is summarized and collated to increase the overall effectiveness of the research.
This research method involves collecting quantitative data from existing data sources like the internet, government resources, libraries, research reports, etc. Secondary quantitative research helps to validate the data collected from primary quantitative research and aid in strengthening or proving, or disproving previously collected data.
The following are five popularly used secondary quantitative research methods:
- Data available on the internet: With the high penetration of the internet and mobile devices, it has become increasingly easy to conduct quantitative research using the internet. Information about most research topics is available online, and this aids in boosting the validity of primary quantitative data.
- Government and non-government sources: Secondary quantitative research can also be conducted with the help of government and non-government sources that deal with market research reports. This data is highly reliable and in-depth and hence, can be used to increase the validity of quantitative research design.
- Public libraries: Now a sparingly used method of conducting quantitative research, it is still a reliable source of information, though. Public libraries have copies of important research that was conducted earlier. They are a storehouse of valuable information and documents from which information can be extracted.
- Educational institutions: Educational institutions conduct in-depth research on multiple topics, and hence, the reports that they publish are an important source of validation in quantitative research.
- Commercial information sources: Local newspapers, journals, magazines, radio, and TV stations are great sources to obtain data for secondary quantitative research. These commercial information sources have in-depth, first-hand information on market research, demographic segmentation, and similar subjects.
Quantitative Research Examples
Some examples of quantitative research are:
- A customer satisfaction template can be used if any organization would like to conduct a customer satisfaction (CSAT) survey . Through this kind of survey, an organization can collect quantitative data and metrics on the goodwill of the brand or organization in the customer’s mind based on multiple parameters such as product quality, pricing, customer experience, etc. This data can be collected by asking a net promoter score (NPS) question , matrix table questions, etc. that provide data in the form of numbers that can be analyzed and worked upon.
- Another example of quantitative research is an organization that conducts an event, collecting feedback from attendees about the value they see from the event. By using an event survey , the organization can collect actionable feedback about the satisfaction levels of customers during various phases of the event such as the sales, pre and post-event, the likelihood of recommending the organization to their friends and colleagues, hotel preferences for the future events and other such questions.
What are the Advantages of Quantitative Research?
There are many advantages to quantitative research. Some of the major advantages of why researchers use this method in market research are:

Collect Reliable and Accurate Data:
Quantitative research is a powerful method for collecting reliable and accurate quantitative data. Since data is collected, analyzed, and presented in numbers, the results obtained are incredibly reliable and objective. Numbers do not lie and offer an honest and precise picture of the conducted research without discrepancies. In situations where a researcher aims to eliminate bias and predict potential conflicts, quantitative research is the method of choice.
Quick Data Collection:
Quantitative research involves studying a group of people representing a larger population. Researchers use a survey or another quantitative research method to efficiently gather information from these participants, making the process of analyzing the data and identifying patterns faster and more manageable through the use of statistical analysis. This advantage makes quantitative research an attractive option for projects with time constraints.
Wider Scope of Data Analysis:
Quantitative research, thanks to its utilization of statistical methods, offers an extensive range of data collection and analysis. Researchers can delve into a broader spectrum of variables and relationships within the data, enabling a more thorough comprehension of the subject under investigation. This expanded scope is precious when dealing with complex research questions that require in-depth numerical analysis.
Eliminate Bias:
One of the significant advantages of quantitative research is its ability to eliminate bias. This research method leaves no room for personal comments or the biasing of results, as the findings are presented in numerical form. This objectivity makes the results fair and reliable in most cases, reducing the potential for researcher bias or subjectivity.
In summary, quantitative research involves collecting, analyzing, and presenting quantitative data using statistical analysis. It offers numerous advantages, including the collection of reliable and accurate data, quick data collection, a broader scope of data analysis, and the elimination of bias, making it a valuable approach in the field of research. When considering the benefits of quantitative research, it’s essential to recognize its strengths in contrast to qualitative methods and its role in collecting and analyzing numerical data for a more comprehensive understanding of research topics.
Best Practices to Conduct Quantitative Research
Here are some best practices for conducting quantitative research:

- Differentiate between quantitative and qualitative: Understand the difference between the two methodologies and apply the one that suits your needs best.
- Choose a suitable sample size: Ensure that you have a sample representative of your population and large enough to be statistically weighty.
- Keep your research goals clear and concise: Know your research goals before you begin data collection to ensure you collect the right amount and the right quantity of data.
- Keep the questions simple: Remember that you will be reaching out to a demographically wide audience. Pose simple questions for your respondents to understand easily.
Quantitative Research vs Qualitative Research
Quantitative research and qualitative research are two distinct approaches to conducting research, each with its own set of methods and objectives. Here’s a comparison of the two:

Quantitative Research
- Objective: The primary goal of quantitative research is to quantify and measure phenomena by collecting numerical data. It aims to test hypotheses, establish patterns, and generalize findings to a larger population.
- Data Collection: Quantitative research employs systematic and standardized approaches for data collection, including techniques like surveys, experiments, and observations that involve predefined variables. It is often collected from a large and representative sample.
- Data Analysis: Data is analyzed using statistical techniques, such as descriptive statistics, inferential statistics, and mathematical modeling. Researchers use statistical tests to draw conclusions and make generalizations based on numerical data.
- Sample Size: Quantitative research often involves larger sample sizes to ensure statistical significance and generalizability.
- Results: The results are typically presented in tables, charts, and statistical summaries, making them highly structured and objective.
- Generalizability: Researchers intentionally structure quantitative research to generate outcomes that can be helpful to a larger population, and they frequently seek to establish causative connections.
- Emphasis on Objectivity: Researchers aim to minimize bias and subjectivity, focusing on replicable and objective findings.
Qualitative Research
- Objective: Qualitative research seeks to gain a deeper understanding of the underlying motivations, behaviors, and experiences of individuals or groups. It explores the context and meaning of phenomena.
- Data Collection: Qualitative research employs adaptable and open-ended techniques for data collection, including methods like interviews, focus groups, observations, and content analysis. It allows participants to express their perspectives in their own words.
- Data Analysis: Data is analyzed through thematic analysis, content analysis, or grounded theory. Researchers focus on identifying patterns, themes, and insights in the data.
- Sample Size: Qualitative research typically involves smaller sample sizes due to the in-depth nature of data collection and analysis.
- Results: Findings are presented in narrative form, often in the participants’ own words. Results are subjective, context-dependent, and provide rich, detailed descriptions.
- Generalizability: Qualitative research does not aim for broad generalizability but focuses on in-depth exploration within a specific context. It provides a detailed understanding of a particular group or situation.
- Emphasis on Subjectivity: Researchers acknowledge the role of subjectivity and the researcher’s influence on the Research Process . Participant perspectives and experiences are central to the findings.
Researchers choose between quantitative and qualitative research methods based on their research objectives and the nature of the research question. Each approach has its advantages and drawbacks, and the decision between them hinges on the particular research objectives and the data needed to address research inquiries effectively.
Quantitative research is a structured way of collecting and analyzing data from various sources. Its purpose is to quantify the problem and understand its extent, seeking results that someone can project to a larger population.
Companies that use quantitative rather than qualitative research typically aim to measure magnitudes and seek objectively interpreted statistical results. So if you want to obtain quantitative data that helps you define the structured cause-and-effect relationship between the research problem and the factors, you should opt for this type of research.
At QuestionPro , we have various Best Data Collection Tools and features to conduct investigations of this type. You can create questionnaires and distribute them through our various methods. We also have sample services or various questions to guarantee the success of your study and the quality of the collected data.
Quantitative research is a systematic and structured approach to studying phenomena that involves the collection of measurable data and the application of statistical, mathematical, or computational techniques for analysis.
Quantitative research is characterized by structured tools like surveys, substantial sample sizes, closed-ended questions, reliance on prior studies, data presented numerically, and the ability to generalize findings to the broader population.
The two main methods of quantitative research are Primary quantitative research methods, involving data collection directly from sources, and Secondary quantitative research methods, which utilize existing data for analysis.
1.Surveying to measure employee engagement with numerical rating scales. 2.Analyzing sales data to identify trends in product demand and market share. 4.Examining test scores to assess the impact of a new teaching method on student performance. 4.Using website analytics to track user behavior and conversion rates for an online store.
1.Differentiate between quantitative and qualitative approaches. 2.Choose a representative sample size. 3.Define clear research goals before data collection. 4.Use simple and easily understandable survey questions.
MORE LIKE THIS

Customer Marketing: The Best Kept Secret of Big Brands
Jul 8, 2024

Positive Correlation: What It Is, Importance & How It Works
Jul 5, 2024

Exit Interviews: Transforming Departures into Growth Opportunities
Jul 4, 2024

Techathon by QuestionPro: An Amazing Showcase of Tech Brilliance
Jul 3, 2024
Other categories
- Academic Research
- Artificial Intelligence
- Assessments
- Brand Awareness
- Case Studies
- Communities
- Consumer Insights
- Customer effort score
- Customer Engagement
- Customer Experience
- Customer Loyalty
- Customer Research
- Customer Satisfaction
- Employee Benefits
- Employee Engagement
- Employee Retention
- Friday Five
- General Data Protection Regulation
- Insights Hub
- Life@QuestionPro
- Market Research
- Mobile diaries
- Mobile Surveys
- New Features
- Online Communities
- Question Types
- Questionnaire
- QuestionPro Products
- Release Notes
- Research Tools and Apps
- Revenue at Risk
- Survey Templates
- Training Tips
- Tuesday CX Thoughts (TCXT)
- Uncategorized
- What’s Coming Up
- Workforce Intelligence
The Ultimate Guide to Quantitative Research Methods

9 Powerful Techniques You Must Know!

Introduction
Quantitative Research Methods are integral for those aiming to conduct rigorous and objective research. They offer invaluable insights through structured and systematic procedures, allowing researchers to draw verifiable and statistical conclusions. This guide will explore the fundamental components of these techniques, emphasizing the significance an their potential to transform your approach to research.
Quantitative Research Methods: The Pillar of Objective Research
Quantitative Research is rooted in empirical evidence. It revolves around numerical data, and these data narrate a compelling and enlightening tale.
History and Evolution
From the meticulous tax records of ancient civilizations to modern stock market analyses, quantitative research has always been around. Over time the approaches have advanced, naturally becoming more refined and extensive.
Why Is It Crucial?
Numbers don’t lie. Quantitative research, with its focus on statistical analysis, offers objective findings. By removing subjective biases, it ensures the purity of data, making its results invaluable.
Basic Concepts and Terminologies
For beginners, diving into quantitative research can feel like being lost in a jargon jungle. Fear not! From variables to sampling , this section will decode the most essential terms for you.
Popular Techniques and Methods
Perhaps the most popular method, surveys allow researchers to gather data from a large group. Thanks to digitalization and the internet, online surveys have become possible providing us with a wider casting net for samples and data.
Experiments
The cornerstone of scientific studies. Conducting experiments in controlled environments can provide valuable information into the cause and effect relationships.
Correlational Research
It’s all about relationships! Correlational research identifies and measures the strengths of relationships between two variables.
Longitudinal Studies
Observing the same subjects over long periods, this method offers insights into changes over time.
Cross-sectional Studies
A snapshot in time. This technique studies different groups simultaneously to draw comparisons.
Case Studies
While traditionally more qualitative, quantitative case studies use statistical methods to analyze specific instances or events.
Incorporating Technology
Modern research is synonymous with technology. Data analytics tools, AI-driven algorithms, and digital platforms have made quantitative research more efficient and precise.
Software and Tools
From SPSS to R, modern researchers have a slew of software at their disposal. These tools not only simplify data collection but also empower researchers with advanced analytical capabilities.
Big Data and Quantitative Research
In this era of information, big data assumes a crucial role by harnessing extensive amounts of data. Scholars can unveil patterns and insights that were once unimaginable.
Challenges and Limitations
While quantitative research is powerful, it isn’t without its pitfalls.
Biases in Data Collection
Even with the most rigorous methods, biases can creep in, skewing results.
Over-reliance on Numbers
Sometimes, numbers don’t tell the full story. Over-relying on them can lead to incomplete insights.
Financial and Time Constraints
Conducting extensive quantitative research can be both time-consuming and expensive.
The Future of Quantitative Research
With AI, ML, and the ever-growing realm of technology, the future of quantitative research holds immense potential. Automated gathering of data, instant analysis, and predictive modelling are some fields that there are possibilities of growth.

- What distinguishes quantitative research from qualitative research?
Quantitative research focuses on numbers and statistical analysis, while qualitative research is more about exploring underlying reasons and motivations.
- Is quantitative research always reliable?
While it offers more objective results, it’s essential to consider biases and other limitations that might affect its reliability.
- Which industries heavily rely on quantitative research?
Fields like finance, healthcare, social sciences, and even marketing extensively use quantitative research for data-driven decision making.
- How has technology impacted quantitative research?
Technology has revolutionized data collection, analysis, and presentation, making research more efficient and precise.
- Can I combine both qualitative and quantitative methods?
Absolutely! Mixed methods research combines both approaches to provide a holistic understanding of a topic.
- What’s the primary advantage of using quantitative research?
Its primary advantage is its ability to provide objective, verifiable, and statistical data that can be generalized to larger populations.
Quantitative Research Methods, known for their empirical approach has transformed our comprehension of the surrounding world. Regardless of you occupation, a slight curiosity in this field is all you need to embrace these methods and enhance the quality of your research.
External Links/ Sources:
Quantitative research
Types of Quantitative Research
What is quantitative research? Definition, methods, types, and examples
Unlocking the 7 Wonders of Systematic Random Sampling
Identity verification in online gaming and gambling, leave a reply cancel reply.
Your email address will not be published. Required fields are marked *
Save my name, email, and website in this browser for the next time I comment.
Sign up for a free trial today!
Centilio’s end-to-end marketing platform solves every marketing need of your organization.
TRY FOR FREE
Deleting your Account
Add a contact in centilio, accessing the sign journey.
© 2023 Centilio Inc, All Rights Reserved.
- Research Process
- Manuscript Preparation
- Manuscript Review
- Publication Process
- Publication Recognition
- Language Editing Services
- Translation Services

Choosing the Right Research Methodology: A Guide for Researchers
- 3 minute read
- 44.2K views
Table of Contents
Choosing an optimal research methodology is crucial for the success of any research project. The methodology you select will determine the type of data you collect, how you collect it, and how you analyse it. Understanding the different types of research methods available along with their strengths and weaknesses, is thus imperative to make an informed decision.
Understanding different research methods:
There are several research methods available depending on the type of study you are conducting, i.e., whether it is laboratory-based, clinical, epidemiological, or survey based . Some common methodologies include qualitative research, quantitative research, experimental research, survey-based research, and action research. Each method can be opted for and modified, depending on the type of research hypotheses and objectives.
Qualitative vs quantitative research:
When deciding on a research methodology, one of the key factors to consider is whether your research will be qualitative or quantitative. Qualitative research is used to understand people’s experiences, concepts, thoughts, or behaviours . Quantitative research, on the contrary, deals with numbers, graphs, and charts, and is used to test or confirm hypotheses, assumptions, and theories.
Qualitative research methodology:
Qualitative research is often used to examine issues that are not well understood, and to gather additional insights on these topics. Qualitative research methods include open-ended survey questions, observations of behaviours described through words, and reviews of literature that has explored similar theories and ideas. These methods are used to understand how language is used in real-world situations, identify common themes or overarching ideas, and describe and interpret various texts. Data analysis for qualitative research typically includes discourse analysis, thematic analysis, and textual analysis.
Quantitative research methodology:
The goal of quantitative research is to test hypotheses, confirm assumptions and theories, and determine cause-and-effect relationships. Quantitative research methods include experiments, close-ended survey questions, and countable and numbered observations. Data analysis for quantitative research relies heavily on statistical methods.
Analysing qualitative vs quantitative data:
The methods used for data analysis also differ for qualitative and quantitative research. As mentioned earlier, quantitative data is generally analysed using statistical methods and does not leave much room for speculation. It is more structured and follows a predetermined plan. In quantitative research, the researcher starts with a hypothesis and uses statistical methods to test it. Contrarily, methods used for qualitative data analysis can identify patterns and themes within the data, rather than provide statistical measures of the data. It is an iterative process, where the researcher goes back and forth trying to gauge the larger implications of the data through different perspectives and revising the analysis if required.
When to use qualitative vs quantitative research:
The choice between qualitative and quantitative research will depend on the gap that the research project aims to address, and specific objectives of the study. If the goal is to establish facts about a subject or topic, quantitative research is an appropriate choice. However, if the goal is to understand people’s experiences or perspectives, qualitative research may be more suitable.
Conclusion:
In conclusion, an understanding of the different research methods available, their applicability, advantages, and disadvantages is essential for making an informed decision on the best methodology for your project. If you need any additional guidance on which research methodology to opt for, you can head over to Elsevier Author Services (EAS). EAS experts will guide you throughout the process and help you choose the perfect methodology for your research goals.

Why is data validation important in research?

When Data Speak, Listen: Importance of Data Collection and Analysis Methods
You may also like.

Descriptive Research Design and Its Myriad Uses

Five Common Mistakes to Avoid When Writing a Biomedical Research Paper

Making Technical Writing in Environmental Engineering Accessible

To Err is Not Human: The Dangers of AI-assisted Academic Writing

Writing a good review article

Scholarly Sources: What are They and Where can You Find Them?
Input your search keywords and press Enter.
- USC Libraries
- Research Guides
Organizing Your Social Sciences Research Paper
- Quantitative Methods
- Purpose of Guide
- Design Flaws to Avoid
- Independent and Dependent Variables
- Glossary of Research Terms
- Reading Research Effectively
- Narrowing a Topic Idea
- Broadening a Topic Idea
- Extending the Timeliness of a Topic Idea
- Academic Writing Style
- Applying Critical Thinking
- Choosing a Title
- Making an Outline
- Paragraph Development
- Research Process Video Series
- Executive Summary
- The C.A.R.S. Model
- Background Information
- The Research Problem/Question
- Theoretical Framework
- Citation Tracking
- Content Alert Services
- Evaluating Sources
- Primary Sources
- Secondary Sources
- Tiertiary Sources
- Scholarly vs. Popular Publications
- Qualitative Methods
- Insiderness
- Using Non-Textual Elements
- Limitations of the Study
- Common Grammar Mistakes
- Writing Concisely
- Avoiding Plagiarism
- Footnotes or Endnotes?
- Further Readings
- Generative AI and Writing
- USC Libraries Tutorials and Other Guides
- Bibliography
Quantitative methods emphasize objective measurements and the statistical, mathematical, or numerical analysis of data collected through polls, questionnaires, and surveys, or by manipulating pre-existing statistical data using computational techniques . Quantitative research focuses on gathering numerical data and generalizing it across groups of people or to explain a particular phenomenon.
Babbie, Earl R. The Practice of Social Research . 12th ed. Belmont, CA: Wadsworth Cengage, 2010; Muijs, Daniel. Doing Quantitative Research in Education with SPSS . 2nd edition. London: SAGE Publications, 2010.
Need Help Locating Statistics?
Resources for locating data and statistics can be found here:
Statistics & Data Research Guide
Characteristics of Quantitative Research
Your goal in conducting quantitative research study is to determine the relationship between one thing [an independent variable] and another [a dependent or outcome variable] within a population. Quantitative research designs are either descriptive [subjects usually measured once] or experimental [subjects measured before and after a treatment]. A descriptive study establishes only associations between variables; an experimental study establishes causality.
Quantitative research deals in numbers, logic, and an objective stance. Quantitative research focuses on numeric and unchanging data and detailed, convergent reasoning rather than divergent reasoning [i.e., the generation of a variety of ideas about a research problem in a spontaneous, free-flowing manner].
Its main characteristics are :
- The data is usually gathered using structured research instruments.
- The results are based on larger sample sizes that are representative of the population.
- The research study can usually be replicated or repeated, given its high reliability.
- Researcher has a clearly defined research question to which objective answers are sought.
- All aspects of the study are carefully designed before data is collected.
- Data are in the form of numbers and statistics, often arranged in tables, charts, figures, or other non-textual forms.
- Project can be used to generalize concepts more widely, predict future results, or investigate causal relationships.
- Researcher uses tools, such as questionnaires or computer software, to collect numerical data.
The overarching aim of a quantitative research study is to classify features, count them, and construct statistical models in an attempt to explain what is observed.
Things to keep in mind when reporting the results of a study using quantitative methods :
- Explain the data collected and their statistical treatment as well as all relevant results in relation to the research problem you are investigating. Interpretation of results is not appropriate in this section.
- Report unanticipated events that occurred during your data collection. Explain how the actual analysis differs from the planned analysis. Explain your handling of missing data and why any missing data does not undermine the validity of your analysis.
- Explain the techniques you used to "clean" your data set.
- Choose a minimally sufficient statistical procedure ; provide a rationale for its use and a reference for it. Specify any computer programs used.
- Describe the assumptions for each procedure and the steps you took to ensure that they were not violated.
- When using inferential statistics , provide the descriptive statistics, confidence intervals, and sample sizes for each variable as well as the value of the test statistic, its direction, the degrees of freedom, and the significance level [report the actual p value].
- Avoid inferring causality , particularly in nonrandomized designs or without further experimentation.
- Use tables to provide exact values ; use figures to convey global effects. Keep figures small in size; include graphic representations of confidence intervals whenever possible.
- Always tell the reader what to look for in tables and figures .
NOTE: When using pre-existing statistical data gathered and made available by anyone other than yourself [e.g., government agency], you still must report on the methods that were used to gather the data and describe any missing data that exists and, if there is any, provide a clear explanation why the missing data does not undermine the validity of your final analysis.
Babbie, Earl R. The Practice of Social Research . 12th ed. Belmont, CA: Wadsworth Cengage, 2010; Brians, Craig Leonard et al. Empirical Political Analysis: Quantitative and Qualitative Research Methods . 8th ed. Boston, MA: Longman, 2011; McNabb, David E. Research Methods in Public Administration and Nonprofit Management: Quantitative and Qualitative Approaches . 2nd ed. Armonk, NY: M.E. Sharpe, 2008; Quantitative Research Methods. Writing@CSU. Colorado State University; Singh, Kultar. Quantitative Social Research Methods . Los Angeles, CA: Sage, 2007.
Basic Research Design for Quantitative Studies
Before designing a quantitative research study, you must decide whether it will be descriptive or experimental because this will dictate how you gather, analyze, and interpret the results. A descriptive study is governed by the following rules: subjects are generally measured once; the intention is to only establish associations between variables; and, the study may include a sample population of hundreds or thousands of subjects to ensure that a valid estimate of a generalized relationship between variables has been obtained. An experimental design includes subjects measured before and after a particular treatment, the sample population may be very small and purposefully chosen, and it is intended to establish causality between variables. Introduction The introduction to a quantitative study is usually written in the present tense and from the third person point of view. It covers the following information:
- Identifies the research problem -- as with any academic study, you must state clearly and concisely the research problem being investigated.
- Reviews the literature -- review scholarship on the topic, synthesizing key themes and, if necessary, noting studies that have used similar methods of inquiry and analysis. Note where key gaps exist and how your study helps to fill these gaps or clarifies existing knowledge.
- Describes the theoretical framework -- provide an outline of the theory or hypothesis underpinning your study. If necessary, define unfamiliar or complex terms, concepts, or ideas and provide the appropriate background information to place the research problem in proper context [e.g., historical, cultural, economic, etc.].
Methodology The methods section of a quantitative study should describe how each objective of your study will be achieved. Be sure to provide enough detail to enable the reader can make an informed assessment of the methods being used to obtain results associated with the research problem. The methods section should be presented in the past tense.
- Study population and sampling -- where did the data come from; how robust is it; note where gaps exist or what was excluded. Note the procedures used for their selection;
- Data collection – describe the tools and methods used to collect information and identify the variables being measured; describe the methods used to obtain the data; and, note if the data was pre-existing [i.e., government data] or you gathered it yourself. If you gathered it yourself, describe what type of instrument you used and why. Note that no data set is perfect--describe any limitations in methods of gathering data.
- Data analysis -- describe the procedures for processing and analyzing the data. If appropriate, describe the specific instruments of analysis used to study each research objective, including mathematical techniques and the type of computer software used to manipulate the data.
Results The finding of your study should be written objectively and in a succinct and precise format. In quantitative studies, it is common to use graphs, tables, charts, and other non-textual elements to help the reader understand the data. Make sure that non-textual elements do not stand in isolation from the text but are being used to supplement the overall description of the results and to help clarify key points being made. Further information about how to effectively present data using charts and graphs can be found here .
- Statistical analysis -- how did you analyze the data? What were the key findings from the data? The findings should be present in a logical, sequential order. Describe but do not interpret these trends or negative results; save that for the discussion section. The results should be presented in the past tense.
Discussion Discussions should be analytic, logical, and comprehensive. The discussion should meld together your findings in relation to those identified in the literature review, and placed within the context of the theoretical framework underpinning the study. The discussion should be presented in the present tense.
- Interpretation of results -- reiterate the research problem being investigated and compare and contrast the findings with the research questions underlying the study. Did they affirm predicted outcomes or did the data refute it?
- Description of trends, comparison of groups, or relationships among variables -- describe any trends that emerged from your analysis and explain all unanticipated and statistical insignificant findings.
- Discussion of implications – what is the meaning of your results? Highlight key findings based on the overall results and note findings that you believe are important. How have the results helped fill gaps in understanding the research problem?
- Limitations -- describe any limitations or unavoidable bias in your study and, if necessary, note why these limitations did not inhibit effective interpretation of the results.
Conclusion End your study by to summarizing the topic and provide a final comment and assessment of the study.
- Summary of findings – synthesize the answers to your research questions. Do not report any statistical data here; just provide a narrative summary of the key findings and describe what was learned that you did not know before conducting the study.
- Recommendations – if appropriate to the aim of the assignment, tie key findings with policy recommendations or actions to be taken in practice.
- Future research – note the need for future research linked to your study’s limitations or to any remaining gaps in the literature that were not addressed in your study.
Black, Thomas R. Doing Quantitative Research in the Social Sciences: An Integrated Approach to Research Design, Measurement and Statistics . London: Sage, 1999; Gay,L. R. and Peter Airasain. Educational Research: Competencies for Analysis and Applications . 7th edition. Upper Saddle River, NJ: Merril Prentice Hall, 2003; Hector, Anestine. An Overview of Quantitative Research in Composition and TESOL . Department of English, Indiana University of Pennsylvania; Hopkins, Will G. “Quantitative Research Design.” Sportscience 4, 1 (2000); "A Strategy for Writing Up Research Results. The Structure, Format, Content, and Style of a Journal-Style Scientific Paper." Department of Biology. Bates College; Nenty, H. Johnson. "Writing a Quantitative Research Thesis." International Journal of Educational Science 1 (2009): 19-32; Ouyang, Ronghua (John). Basic Inquiry of Quantitative Research . Kennesaw State University.
Strengths of Using Quantitative Methods
Quantitative researchers try to recognize and isolate specific variables contained within the study framework, seek correlation, relationships and causality, and attempt to control the environment in which the data is collected to avoid the risk of variables, other than the one being studied, accounting for the relationships identified.
Among the specific strengths of using quantitative methods to study social science research problems:
- Allows for a broader study, involving a greater number of subjects, and enhancing the generalization of the results;
- Allows for greater objectivity and accuracy of results. Generally, quantitative methods are designed to provide summaries of data that support generalizations about the phenomenon under study. In order to accomplish this, quantitative research usually involves few variables and many cases, and employs prescribed procedures to ensure validity and reliability;
- Applying well established standards means that the research can be replicated, and then analyzed and compared with similar studies;
- You can summarize vast sources of information and make comparisons across categories and over time; and,
- Personal bias can be avoided by keeping a 'distance' from participating subjects and using accepted computational techniques .
Babbie, Earl R. The Practice of Social Research . 12th ed. Belmont, CA: Wadsworth Cengage, 2010; Brians, Craig Leonard et al. Empirical Political Analysis: Quantitative and Qualitative Research Methods . 8th ed. Boston, MA: Longman, 2011; McNabb, David E. Research Methods in Public Administration and Nonprofit Management: Quantitative and Qualitative Approaches . 2nd ed. Armonk, NY: M.E. Sharpe, 2008; Singh, Kultar. Quantitative Social Research Methods . Los Angeles, CA: Sage, 2007.
Limitations of Using Quantitative Methods
Quantitative methods presume to have an objective approach to studying research problems, where data is controlled and measured, to address the accumulation of facts, and to determine the causes of behavior. As a consequence, the results of quantitative research may be statistically significant but are often humanly insignificant.
Some specific limitations associated with using quantitative methods to study research problems in the social sciences include:
- Quantitative data is more efficient and able to test hypotheses, but may miss contextual detail;
- Uses a static and rigid approach and so employs an inflexible process of discovery;
- The development of standard questions by researchers can lead to "structural bias" and false representation, where the data actually reflects the view of the researcher instead of the participating subject;
- Results provide less detail on behavior, attitudes, and motivation;
- Researcher may collect a much narrower and sometimes superficial dataset;
- Results are limited as they provide numerical descriptions rather than detailed narrative and generally provide less elaborate accounts of human perception;
- The research is often carried out in an unnatural, artificial environment so that a level of control can be applied to the exercise. This level of control might not normally be in place in the real world thus yielding "laboratory results" as opposed to "real world results"; and,
- Preset answers will not necessarily reflect how people really feel about a subject and, in some cases, might just be the closest match to the preconceived hypothesis.
Research Tip
Finding Examples of How to Apply Different Types of Research Methods
SAGE publications is a major publisher of studies about how to design and conduct research in the social and behavioral sciences. Their SAGE Research Methods Online and Cases database includes contents from books, articles, encyclopedias, handbooks, and videos covering social science research design and methods including the complete Little Green Book Series of Quantitative Applications in the Social Sciences and the Little Blue Book Series of Qualitative Research techniques. The database also includes case studies outlining the research methods used in real research projects. This is an excellent source for finding definitions of key terms and descriptions of research design and practice, techniques of data gathering, analysis, and reporting, and information about theories of research [e.g., grounded theory]. The database covers both qualitative and quantitative research methods as well as mixed methods approaches to conducting research.
SAGE Research Methods Online and Cases
- << Previous: Qualitative Methods
- Next: Insiderness >>
- Last Updated: Jul 3, 2024 10:07 AM
- URL: https://libguides.usc.edu/writingguide
A Complete Guide to Quantitative Research Methods

Numbers are everywhere and drive our day-to-day lives. We take decisions based on numbers, both at work and in our personal lives. For example, an organization may rely on sales numbers to see if it’s succeeding or failing, and a group of friends planning a vacation may look at ticket prices to pick a place.
In the social domain, numbers are just as important. They help identify what interventions are needed, whether ongoing projects are effective, and more. But how do organizations in the social domain get the numbers they need?
This is where quantitative research comes in. Quantitative research is the process of collecting numerical data through standardized techniques, then applying statistical methods to derive insights from it.
When is quantitative research useful?
The goal of quantitative research methods is to collect numerical data from a group of people, then generalize those results to a larger group of people to explain a phenomenon. Researchers generally use quantitative research when they want get objective, conclusive answers.
For example, a chocolate brand may run a survey among a sample of their target group (teenagers in the United States) to check whether they like the taste of the chocolate. The result of this survey would reveal how all teenagers in the U.S. feel about the chocolate.

Similarly, an organization running a project to improve a village’s literacy rate may look at how many people came to their program, how many people dropped out, and each person’s literacy score before and after the program. They can use these metrics to evaluate the overall success of their program.
Unlike qualitative research , quantitative research is generally not used in the early stages of research for exploring a question or scoping out a problem. It is generally used to answer clear, pre-defined questions in the advanced stages of a research study.
How can you plan a quantitative research exercise?
- Identify the research problem . An example would be, how well do New Delhi’s government schools ensure that students complete their education?
- Prepare the research questions that need to be answered to address the research problem. For example, what percentage of students drop out of government schools in New Delhi?
- Review existing literature on the research problem and questions to ensure that there is no duplication. If someone has already answered this, you can rely on their results.
- Develop a research plan . This includes identifying the target group, sample , and method of data collection ; conducting data analysis; collating recommendations; and arriving at a conclusion.
What are the advantages of quantitative research methods?
- Quantitative research methods provide an relatively conclusive answer to the research questions.
- When the data is collected and analyzed in accordance with standardized, reputable methodology, the results are usually trustworthy.
- With statistically significant sample sizes, the results can be generalized to an entire target group.
Samples have to be carefully designed and chosen, else their results can’t be generalized. Learn how to choose the right sampling technique for your survey.
What are the limitations of quantitative research methods?
- Does not account for people’s thoughts or perceptions about what you’re evaluating.
- Does not explore the “why” and “how” behind a phenomenon.
What quantitative research methods can you use?
Here are four quantitative research methods that you can use to collect data for a quantitative research study:
Questionnaires
This is the most common way to collect quantitative data. A questionnaire (also called a survey) is a series of questions, usually written on paper or a digital form. Researchers give the questionnaire to their sample, and each participant answers the questions. The questions are designed to gather data that will help researchers answer their research questions.

Typically, a questionnaire has closed-ended questions — that is, the participant chooses an answer from the given options. However, a questionnaire may also have quantitative open-ended questions. In the open-ended example above, the participants could write a simple number like “4”, a range like “I usually go one or two times per week” or a more complex response like “Most weeks I go twice, but this week I went 4 times because I kept forgetting my grocery list. During the winter, I only go once a week.”
Understanding closed and open-ended questions is crucial to designing a great survey and collecting high quality data. Learn more with our complete guide about when and how to use closed and open-ended questions.
A good questionnaire should have clear language, correct grammar and spelling, and a clear objective.
Advantages:
- Questionnaires are often less time consuming than interviews or other in-person quantitative research methods.
- They’re a common, fairly simple way to collect data.
- They can be a cost-effective option for gathering data from a large sample.
Limitations:
- Responses may lack depth and provide limited information.
- Respondents may lose interest or quit if the questionnaire is long.
- Respondents may not understand all questions, which would lead to inaccurate responses.
Response bias — a set of factors that lead participants answer a question incorrectly — can be deadly for data quality. Learn how it happens and how to avoid it.

An interview for quantitative research involves verbal communication between the participant and researcher, whose goal is to gather numerical data. The interview can be conducted face-to-face or over the phone, and it can be structured or unstructured.
In a structured interview, the researcher asks a fixed set of questions to every participant. The questions and their order are pre-decided by the researcher. The interview follows a formal pattern. Structured interviews are more cost efficient and can be less time consuming.
In an unstructured interview, the researcher thinks of his/her questions as the interview proceeds. This type of interview is conversational in nature and can last a few hours. This type of interview allows the researcher to be flexible and ask questions depending on the participant’s responses. This quantitative research method can provide more in-depth information, since it allows researchers to delve deeper into a participant’s response.
- Interviews can provide more in-depth information.
- Interviews are more flexible than questionnaires, since interviewers can adapt their questions to each participant or ask follow-up questions.
- Interviewers can clarify participants’ questions, which will help them get clearer, more accurate data.
- Interviewing one person at a time can be time-consuming.
- Travel, interviewer salaries and other expenses can make interviews an expensive data collection tool.
- With unstructured interviews, it can be difficult to quantify some responses.
One way to speed up interviews is to conduct them with multiple people at one time in a focus group discussion. Learn more about how to conduct a great FGD.
Observation
Observation is a systematic way to collect data by observing people in natural situations or settings. Though it is mostly used for collecting qualitative data, observation can also be used to collect quantitative data.
Observation can be simple or behavioral. Simple observations are usually numerical, like how many cars pass through a given intersection each hour or how many students are asleep during a class. Behavioral observation, on the other hand, observes and interprets people’s behavior, like how many cars are driving dangerously or how engaging a lecturer is.
Simple observation can be a good way to collect numerical data. This can be done by pre-defining clear numerical variables that can be collected during observation — for example, what time employees leave the office. This data can be collected by observing employees over a period of time and recording when each person leaves.
- Observation is often an inexpensive way to collect data.
- Since researchers are recording the data themselves (rather than participants reporting the data), most of the collected data will generally be usable.
- Data collection can be stopped and started by researchers at any time, making it a flexible data collection tool.
- Researchers need to be extensively trained to undertake observation and record data correctly.
- Sometimes the environment or research may bias the data, like when participants know they’re being observed.
- If the situation to be observed sometimes doesn’t happen, researchers may waste a lot of time during data collection.
Simple vs. behavioral is just one type of observation. Learn more about the 5 different types of observation and when you should use each to collect different types of data.

Since quantitative research depends on numerical data, records (also known as external data) can provide critical information to answer research questions. Records are numbers and statistics that institutions use to track activities, like attendance in a school or the number of patients admitted in a hospital.
For example, the Government of India conducts the Census every 10 years, which is a record of the country’s population. This data can be used by a researcher who is addressing a population-related research problem.
- Records often include comprehensive data captured over a long period of time.
- Data collection time is minimal, since the data has already been collected and recorded by someone else.
- Records often only provide numerical data, not the reason or cause behind the data.
- Cleaning badly structured or formatted records can take a long time.
- If a record is incomplete or inaccurate, there is often no way to fix it.
Summing it up
Quantitative research methods are one of the best tools to identify a problem or phenomenon, how widespread it is, and how it is changing over time. After identifying a problem, quantitative research can also be used to come up with a trustworthy solution, identified using numerical data collected through standardized techniques.
Image credits: Curtis MacNewton , Brijesh Nirmal , Charles Deluvio , and Atlan.

Related Posts

3 Myths About Paper-Based Data Collection

18 Data Validations That Will Help You Collect Accurate Data

Everything You Need to Know About Informed Consent
14 comments.

Very useful for research

Very easy to read and informative book. Well written. Thany thanks for the download.

It is concise and practical as well as easy to understand.

Nice book but I kind find a way to download it. Kindly let me know how to download it. Thanks

Hello Micah Nalianya Greetings! Kindly tell me how to download the book. Simeon

Hi Micah and Simeon! You can download our data collection ebook here: https://socialcops.com/ebooks/data-collection/

I have loved reviewing the brief write up. Good revision for me. Thanks

The text contains concise and important tips on data collection techniques.

Thanks for an explicit and precise outline of data collection methods.

thank you very much, this guide is really useful and easy to understand. Specially for students that just have started research.

Thank you so much for sharing me this very important material.

I am highly impressed with the simply ways you explain methods of collecting data. I am a Monitoring and Evaluation Specialist and I will like to be receiving your regular publications.

i have benefited from the work. well organized .thank you

interview is a qualitative method not quantitative.
Write A Comment Cancel Reply
Save my name, email, and website in this browser for the next time I comment.
This site uses Akismet to reduce spam. Learn how your comment data is processed .
- The Future of the Modern Data Stack in 2023
- The Third-Generation Data Catalog Primer
- The Secrets of a Modern Data Leader
- The Ultimate Guide to Evaluating Data Lineage
- How Active Metadata Helps Modern Organizations Embrace the DataOps Way
- Inside Atlan
Type above and press Enter to search. Press Esc to cancel.
Course-embedded Research in Energy Transition Minerals as a Pathway to Enhance Quantitative, Analytical and Critical-Thinking Skills
- Dutrow, Barbara L.
A key challenge in expanding a student's quantitative and critical-thinking skills is to connect learning opportunities to curricular activities of paramount interest and relevance to students. A semester-long course-embedded research project with a focus on quantitative analyses of critical minerals was developed to enhance student skill sets and to grow a workforce informed for the energy transition. Each advanced under/graduate student analyzes a rock sample, primarily a carbonatite, containing critical-element-bearing (REE) mineral(s) from a well-known locality: Palabora, S. Africa, Mt. Pass, CA, Wilberforce or Sheffield Lake, Canada, or Magnet Cove, AR. Funds for instrument time were secured through an industry-academic partnership. Specific short-term tasks that highlight aspects of the project were used to add skill sets and reinforce concepts throughout the semester. These include: visual observations and penetrative thinking skills i.e., mapping images from one mental mode to another, and from 2D - 3D, essential for geoscientists in a multidimensional world; completing a variety of calculations including data reduction, starting with simplified hand calculations prior to using computer programs, to reinforce the embedded content and to avoid the 'black box' syndrome of simply entering numbers into a program; evaluating data for quality; plotting data for analyses and presentation; and, using instrumentation to collect highly precise and accurate mineral chemical data. Each student spent hours on the electron microprobe visualizing and analyzing their sample. Observation and analyses at the micrometer scale was then upscaled to reflective macroscopic properties demonstrating the complexity and importance of obtaining fundamental data for geophysical monitoring of environmental issues. As a capstone, all students developed and presented posters at the Department-wide poster competition. Such a relevant research topic enhances learning while improving their quantitative, analytical, communication and critical-thinking skills. While not a new method, selecting student-relevant research excites interest and stimulates learning. The course is self-selected but had significant diversity; 20% African/African Americans; 13% Latinx, with ~50% female, and 1 NB.
No Sources Found
- Open access
- Published: 03 July 2024
Exploring medical students' experience of the learning environment: a mixed methods study in Saudi medical college
- Mohammed Almansour 1 ,
- Noura Abouammoh 2 ,
- Reem Bin Idris 3 ,
- Omar Abdullatif Alsuliman 3 ,
- Renad Abdulrahman Alhomaidi 3 ,
- Mohammed Hamad Alhumud 3 &
- Hani A. Alghamdi 2
BMC Medical Education volume 24 , Article number: 723 ( 2024 ) Cite this article
363 Accesses
5 Altmetric
Metrics details
In medical education, the learning environment (LE) significantly impacts students' professionalism and academic performance. Positive LE perceptions are linked to better academic outcomes. Our study, which was conducted 15 years after curriculum reform at King Saud University's College of Medicine, aimed to explore students' perspectives on their LE and identify areas for improvement. By understanding their experiences, we strive to enhance LE and promote academic success.
This mixed-method study employed an explanatory sequential approach in which a cross-sectional analytical survey phase was collected first using the Johns Hopkins Learning Environment Scale (JHLES), followed by qualitative focus groups. Findings from quantitative and qualitative methods were integrated using joint display.
A total of 653 medical students completed the JHLES. The total average score was 81 out of 140 (16.8), and the average subscale scores ranged from 2.27 (0.95) for inclusion and safety to 3.37 (0.91) for community of peers. The qualitative approach encompasses both inductive and deductive analyses, identifying overarching themes comprising proudness, high expectations and competition, and views about the curriculum. The integration of results emphasizes the need for continued efforts to create a supportive and inclusive LE that positively influences students' experiences and academic success.
This research offers valuable insights for educational institutions seeking to enhance medical education quality and support systems. Recommendations include faculty development, the cultivation of supportive environments, curriculum revision, improved mentorship programs, and initiatives to promote inclusivity and gender equity. Future research should explore longitudinal and comparative studies, innovative mixed methods approaches, and interventions to further optimize medical education experiences. Overall, this study contributes to the ongoing dialog on medical education, offering a nuanced understanding of the complex factors influencing students' perceptions and suggesting actionable strategies for improvement.
Peer Review reports
The learning environment of medical students plays a significant role in shaping qualified, well-rounded physicians. It can also impact students' professionalism, ethics, and morals. As these students graduate and begin their professional practice, their competency can be a direct reflection of the medical institutes from which they graduated. The learning environment (LE) is a term used to describe the physical, cultural, and psychosocial climate in which learning takes place [ 1 ]. Students' skills, knowledge, and attitudes are influenced by the teaching and learning environment of their educational institutes. The interactions they have with their peers, faculty members, and administrators play a role in their learning environment. The curriculum that is taught to students is part of this environment, and the curriculum's design is a vital component [ 2 ].
The impact of LE on the academic performance of medical students is significant. Therefore, it is crucial to provide a supportive environment that positively influences students' perceptions of their LE. Research has consistently shown that students who perceive their LE to be positive and supportive are more likely to perform well academically [ 3 ]. Conversely, students who perceive their LE to be negative may experience adverse effects on their academic performance [ 3 ].
A student-centered curriculum of outstanding standards must be provided, and evaluation of the educational setting at both academic and clinical sites is essential [ 4 ]. King Saud University's College of Medicine program is seven years long, starting with a preparatory year, followed by two basic sciences (preclinical) years, then three clinical-practice years, and a one-year internship. The program employs a combination of problem-based learning and interactive lecturing to teach medical and healthcare-related sciences, emphasizing critical thinking and self-directed learning. Clinical training programs provide hands-on experience, with the goal of producing skilled and compassionate healthcare professionals.
Two studies were conducted at the College of Medicine at King Saud University (COM-KSU). The first study was conducted in 2008, prior to the college's curriculum reform in 2009, which transitioned from a traditional to a system-oriented hybrid curriculum [ 5 ]. Researchers utilized the Dundee Ready Educational Environment Measure (DREEM) scale to evaluate the learning environment (LE), and the results indicated that first-year students had significantly higher scores than other students [ 5 ]. Additionally, preclinical students had significantly greater scores than did clinical students, and gender was not a statistically significant factor [ 5 ].
The second study was conducted in 2014, where fifth-year medical students were evaluated using the DREEM scale to assess their perception of the LE [ 6 ]. The study revealed that the students' perception of the educational environment was satisfactory [ 6 ].
The Johns Hopkins Learning Environment Scale (JHLES) was created by the Johns Hopkins University School of Medicine to evaluate the quality of the learning environment for residents and medical students [ 7 ]. The 28-item scale helps medical educators identify areas of improvement by assessing seven factors or subscales, comprising community of peers, faculty relationships, academic climate, meaningful engagement, mentoring, inclusion and safety, and physical space [ 7 ].
The aim of our study was to investigate the perceptions of medical students regarding their LE at the COM-KSU 15 years after the curriculum was reformed. We seek to understand the experiences of students in this particular LE and gain insights into the factors that influence their perceptions of the LE. By exploring the students' perspectives, we aim to identify areas where improvements can be made to enhance LE and ensure that it is conducive to learning and promotes academic success.
Aim, design, and setting
This mixed-method study aimed to investigate students’ perceptions of the LE at COM-KSU 15 year proceeding a curriculum change, followed by an exploration of their perspectives aiming to identify areas of improvement of the LE. This study employed an explanatory sequential approach in which a cross-sectional analytical survey phase collected first, followed by qualitative focus groups. The research was carried out between November 2022 and March 2023 within the College of Medicine at King Saud University (COM-KSU), which is the pioneering medical education institution in the Kingdom of Saudi Arabia and is located in the capital city of Riyadh.
Participants and sampling
All the COM-KSU undergraduate students and interns were invited to participate in the study, with a total of 1471 students and 268 interns. The total number of enumeration techniques over the period of the study was used. Convenient sampling was employed in this study. The decision to employ convenient sampling was based on practical considerations of the accessibility and availability of participants. Consequently, a total of 653 individuals voluntarily participated in the first phase of the study, and the research team initiated the participant recruitment process by extending invitations to all undergraduate students and interns enrolled in the COM-KSU. The invitations were disseminated via multiple channels, including email, WhatsApp groups, and personal visits to each classroom within the college.
The data collection process comprised two distinct online surveys, each serving a specific purpose. The first survey focused on the quantitative phase and included questions related to demographic information and the Johns Hopkins Learning Environment Scale (JHLES). The second survey, designed for registration in the qualitative phase, included demographic inquiries along with a means of contact and the provision of available time slots. Subsequently, the research team communicated with the registered participants and arranged for focused group discussions (FGDs) to be conducted. Two FGDs were needed (5 and 7 participants) based on the theory of data saturation. Each FGD lasted approximately 70 min and was held at the College of Medicine. The discussions were facilitated by one of the authors, who is a qualitative methodologist and a faculty member at the same college, and the participants were comfortable discussing negative views as they were discussing positive views.
In the quantitative study phase, an online survey encompassing various components was developed. This survey collected demographic data, including information on gender, age, academic year, GPA, employment status, marital status, and residence type. Additionally, the Johns Hopkins Learning Environment Scale (JHLES), a validated tool used for assessing undergraduate medical school learning environments, was used. The JHLES consists of 28 items distributed across seven domains, and its use for this study was conducted without the need for direct permission, as it is publicly available.
In the qualitative study phase, students and interns were actively engaged in Focus Group Discussions (FGDs), aimed at eliciting their perspectives on the learning environment (LE). The FGDs employed a topic guide comprising open-ended questions aligned with the LE domains delineated by the JHLES. These questions included inquiries such as "How would you characterize your relationships with your peers?" and "To what extent does the college environment support collaboration with fellow students from the same college?" Furthermore, participants were asked to share their opinions regarding the faculty and provide insights into their perceptions of the curriculum. The FGDs were complemented with probing questions and follow-up queries to delve deeper into participants' experiences and perspectives.
Statistical analysis
For the first phase in this study, sociodemographic data were presented using descriptive statistics. The mean and standard deviation (SD) for the total score and the seven domains of the JHLES were calculated. Cross-tabulation was used to explore the relationships between the JHLES scores and the sociodemographic variables, and tests of significance through chi-square tests and ANOVA were performed. All analyses were performed using R (version 4.2.2), [ 8 ].
Qualitative data collection
The questions in the topic guide included probing questions and encompassed domains and questions from the JHLES. As open-ended questions were used to collect data, themes included deductive and inductive analysis. Inductive analysis was based on a priori themes based on the JHLES domains.
Qualitative analysis
Thematic analysis was adopted for qualitative analysis. This approach was proposed by Ritchie and Spencer (1994) to be helpful in providing a sequential structure for data analysis. This was conducted using NVivo software version 11.4.2. Using software increases the efficiency of data organization and retrieval. Familiarization, descriptive coding, basic analysis, and interpretation are the steps followed in the data analysis, and quotes from the participants were used to support the themes. Analyzing the data and identifying common descriptive themes were tasks shared with the team. The team agreed on a coding frame. The analysis was conducted independently, and the results are presented in comparison to the quantitative findings in Table 5 .
Mixed methods integration
Findings from quantitative and qualitative methods were integrated using joint display. The outcomes of the JHLES and FGDs were compared side-by-side. Integrating findings can create a holistic understanding of the learning environment of the College of Medicine, leading to a conclusion where the whole is greater than the sum of its parts.
Joint display of the data provided visual means of presenting qualitative and quantitative findings granting the ability to associate reasoning with different item score. Qualitative findings complement the quantitative findings in providing meaning to the score and explored in students’ perspective reasons for these scores. The qualitative findings also explained how students’ pride and perception about their own status reflect on the JHLES score. Students’ needs and preferences were expressed explicitly during the FGDs.
Ethical considerations
This study was approved by King Saud University’s Institutional Review Board (KSU IRB) with the approval number E-22–7298. Electronic informed consent was obtained from all participants in the quantitative arm, and written informed consent was obtained from all participants in the qualitative arm prior to their participation in the study.
Quantitative results
Sociodemographic characteristics.
Table 1 presents the sociodemographic characteristics of all participants. The total number of medical students and interns included in this phase of the study was 653. Of those studied, there was an almost equal gender distribution, with males making up slightly more than half (59%). There were relatively varied numbers of academic years, with less than average representation coming from the intern level at a participation rate of only 4%, while the highest engagement occurred during fourth-year studies at approximately 26%. Most individuals boasted high academic records, achieving an above-average GPA of 4.50–5.00 (65.7%). Of those who participated, a small fraction had lower grades below a GPA of 4 (11.5%). The majority of the participants were unemployed (96.2%), while less than 4% were either employed (full- or part-time) or freelancers (1.5%). Regarding personal life traits, most of the participants were single (98.5%) and lived with their families residing in Riyadh (93%).
As shown in Table 2 , the overall mean score for student experience was 81 ( SD = 16.76). Among the specific subscales, the highest mean score was observed for physical space (3.52; SD = 0.95), and the lowest mean score was found for inclusion and safety (2.27; SD = 0.95).
Sociodemographic variables and overall and domain scores of the JHLES (mean and SD)
Associations between sociodemographic variables and the different domains of the JHLES as well as the overall score are represented in Table 3 . Male students reported a higher mean overall score than females did (83.4 ± 17.1 and 77.5 ± 15.7, respectively). As the number of academic years increased, the first-year students reported a greater average score than did the senior-year students, with a mean overall score for first-year medical students of 87.6 ( SD = 16.9), whereas the average score for senior-year students (fifth-year) was 74.8 ± 18.2. Students who possessed higher GPAs (4.50–5.00) achieved the highest mean score of 82.2 ± 16, while those with GPAs less than 4.00 reported the lowest average score of 73.3 ( SD = 15). Employment status was another variable impacting students' individual perceptions of this survey total score, where employed students generally outperformed unemployed students, with higher scores (88.6 ± 18.6) than unemployed students (80.7 ± 16.7). A significant association was observed between the overall JHELS score and gender, academic year, and GPA at the 0.05 level.
There was a notable difference in scores between males and females, with males reporting higher scores for all domains except “inclusion and safety”. Intriguingly, both genders reflected a similar pattern for reporting the highest score for physical space and the lowest for inclusion and safety. However, four domains showed statistically significant associations at the 0.05 level: peer community, faculty relationships, academic climate, and meaningful engagement.
Among the different academic year levels, first-year students reported the highest score for community of peers (3.64 ± 0.88) and the lowest for inclusion and safety (1.82 ± 0.90). Similarly, second- to fourth-year students reported the highest scores for physical space and the lowest scores for inclusion and safety. As the academic year progressed, fifth-year students and interns obtained the lowest scores in meaningful engagement (2.26 ± 0.94 and 2.18 ± 0.95, respectively), but the highest score was given for physical space among 5th-year students (3.42 ± 0.93) and communities of peers for interns (3.43 ± 0.87). There were statistically significant associations with all subscales except physical space ( P value = 0.33).
Students with high GPA (4.50–5.0) recorded higher results across all domains than did their peers who earned a lower GPA (i.e., less than 4.00), with the exception of inclusion and safety. It is interesting to note that the physical space domain stood out as the highest scorer for all groups, while the scores for inclusion and safety fell short among all groups according to GPA. There was a statistically significant association with the first three domains only, community of peers, faculty relationships, and academic climate.
Employed students reported higher scores on measures related to community engagement reflected in the community of peers (3.70 ± 0.63), while unemployed and freelance students had the highest scores for physical space (3.52 ± 0.95 and 3.65 ± 1.13, respectively). The inclusion and safety subscale scores were the lowest for unemployed and employed students (2.25 ± 0.95 and 2.49 ± 1.20, respectively), while freelancers reported the lowest score for the academic climate subscale (2.36 ± 0.61). Employment status was significantly associated with only the mentoring subscale ( P value = 0.02).
Students who were single attained the highest average score of 3.37 ± 0.91 on the physical space domain, while inclusion and safety presented a challenging component (2.26 ± 0.95). Conversely, those who were married or engaged garnered the highest community of peer ratings, averaging 3.53 ± 0.78, and the lowest for faculty relationships, with a mean value of 2.72 ± 0.92. Students residing with family or in private accommodations, as well as those with families living in Riyadh or outside Riyadh, reported the highest scores in the physical space domain and the lowest scores in inclusion and safety. However, the association was not statistically significant between all groups or across all subscales ( P value > 0.05) .
Qualitative results
Participants of both genders, senior and junior years, represented the FGDs (Table 4 ). One participant was employed, and all were living with their families.
As open-ended questions were used to collect data, themes were derived from deductive and inductive analysis. Inductive analysis was based on a priori themes based on the JHLES domains. Table 5 shows the domains in which participants’ perceptions were compared with the quantitative findings. Some qualitative findings aligned with the quantitative findings, while others contradicted or explained them.
Evaluating the learning environment for medical students is essential for improving their professional standards, knowledge, and skills. This mixed methods study explored medical students' perceptions about the learning environment at the College of Medicine, a well-known university in Saudi Arabia, King Saud University. This study is two-pronged, first, to quantitatively assess students’ perceptions of the COM-KSU learning environment and, second, to qualitatively explore their experience in the same medical school.
Our study yielded an overall average score of 81 out of 140 on the JHLES. Notably, there was no predefined threshold for a passing or positive score on this tool. Compared to the original study where the scale was first used and validated, the average score in our study was lower (107 vs 81, respectively) [ 7 ]. This discrepancy might be related to the original study's single-institute design affects the generalizability of its results, and the differences in student characteristics due to the U.S. requiring a bachelor’s degree for medical school admission, unlike KSA, where students enter directly after high school, play a role. Additionally, the original study did not focus on the "hidden curriculum" influenced by organizational culture and structure, which may explain the discrepancy given the distinct social, organizational, and learning cultures between our context and the American one. However, our results were consistent with those of other studies that were conducted in other medical schools in different countries, including Malaysia, India and Pakistan, ranging from 81.1 to 86 [ 9 , 10 , 11 ].
Two previously published studies in the same setting, COM-KSU (2008 and 2017), utilized the DREEM survey and revealed that medical students reported different average scores (89.9 out of 200 and 171.57 out of 250, respectively) [ 5 , 6 ]. Compared to the current study utilizing the JHLES, we may compare the findings based on a significant correlation between the two measures that support the use of the JHLES in the assessment of the same construct [ 11 ]. This comparison yielded reassuring results that the perceptions of medical students are still positive, with variations in the domains of LE, as described below. The added value of the qualitative component of the current study elicits more depth in understanding LE in the COM-KSU.
Although there was no difference among male and female students in the DREEM overall average score in a previous study that was conducted at the same college in 2017, our study revealed a higher overall average score among males (83.4) than females (77.5). The lower recorded score among females might be explained by their tendency to have higher expectations of a learning environment that was not achieved as their counterpart expected [ 12 , 13 ]. For explanations, male students had higher scores in different domains related to their relationships with the faculty and peers, including mentorship, peer support, and the academic climate. Nevertheless, both genders perceived a negative view where they expressed potential gender discrimination in the focus group interviews. Male students felt that they were treated differently than females, while their counterparts believed that males had more opportunities to build relationships with the faculty and gain more experience accordingly.
In terms of academic years, the domains and overall average scores decreased as the students progressed from the first year to their internships, with an exceptional decrease in the third year followed by the recovery of scores afterward. Nevertheless, students in the first year had higher average scores than interns, possibly due to the new environment and the support provided during their first year. Qualitative group interviews elaborated more on this variation, where medical students in the first year felt a sense of pride and honor upon being accepted in the COM-KSU. They believe that this was a validation of their social status.
Although the relationship between medical students’ feelings of pride in belonging to their college and the learning environment is complex and multifaceted [ 14 ], a positive and supportive learning environment that fosters a sense of belonging can enhance medical students’ feelings of pride and affiliation with their college [ 15 , 16 ], which is evident among first-year medical students. In contrast, a negative learning environment that lacks support and inclusivity can detrimentally impact medical students’ feelings of pride and belonging [ 17 ]. Nevertheless, first-year students still experienced negative emotional effects that were not captured by the quantitative questionnaire due to the lack of professional identification they encountered when they moved from the preparatory year to medical school.
However, the decrease in the average score during the third year could be explained by engagement in clinical rotations and practical applications instead of merely learning basic science. This perception was explained during focus group interviews where students explained the third year as the most challenging due to the preparation for their actual medical practice. This included starting to see patients, taking medical history, and performing physical examinations. Interestingly, this result was consistent with other studies that were conducted in different medical schools, although different assessment tools were used, including MSLES, DREEM, and the same tool used in this study (i.e., JHLES) [ 3 , 7 , 10 ]. In contrast, other studies have shown that medical students feel more satisfied with clinical practice than with basic science during the first and second years [ 12 , 18 , 19 ].
This paradox might be explained by the difficulty students faced at the beginning of the clinical year, after which it decreased or diminished after they gained confidence in their practice under the supervision of well-trained faculty [ 20 , 21 , 22 ]. Hence, higher average scores in the following years could be explained by the maturity of the medical students and their ability to overcome early difficulties after they have more experience during clinical rotations. In the COM-KSU, medical students in their fifth year are prepared to experience life as physicians where they have pure clinical experience joining medical teams, attending rounds, clinics and doing procedures under the supervision of trained faculty and senior doctors. Hence, when mentoring was assessed among medical students, their perception reflected by the average score given to this domain increased as the number of academic years increased, with the highest score occurring during the internship. Mentorship plays an important role in the learning environment, as described in other studies [ 23 , 24 , 25 ]. The importance of the student‒faculty relationship and the enhancement of faculty influence on students are supported by the qualitative findings, which demonstrate that students' perceptions of faculty support vary, which is congruent with other studies [ 26 , 27 , 28 ]. However, a study revealed that the majority of faculty members are not prepared to provide the kind of support that has been shown to be most effective for students [ 29 ].
Furthermore, the meaningful engagement of students declines as the academic year progresses, as expressed by students’ responses to this domain in the JHLES. The qualitative approach elaborated more when students complained about the lack of support provided by the student council, which the COM-KSU perceived as the hub where medical students can engage and obtain the required support. From the students’ perspective, the student council was not able to provide effective support or bring about significant changes for students facing challenges related to their medical study needs. The qualitative study participants agreed with the findings of other local studies, highlighting the absence of a supportive environment for students in our local colleges [ 12 , 30 , 31 ]. On the other hand, the majority of students reflected positively on peer support, where they found it to have a positive impact on them. They identified college friends and colleagues as the main sources of support, which was congruent with other studies that explained the same attitude [ 32 , 33 , 34 ].
According to the students’ performance measured by their GPA, students with higher GPA had higher JHLES scores, both overall and domain average scores. High-achieving students tend to have more positive perceptions of the learning environment than do students with lower GPAs [ 10 , 11 , 21 , 22 , 35 ]. This could suggest a positive association between academic achievement and students’ perceptions of the educational setting [ 18 , 19 , 36 , 37 , 38 ]. However, students experienced positive consequences from high competition in the learning environment due to family and physician expectations that were captured during the focus group discussion. Similar results were found in another study that was conducted in the medical school of the University of Valladolid [ 39 ].
Inclusion and safety were negatively perceived in this study among medical students at all levels, regardless of their gender, academic year, or performance, which was reflected in their GPAs. This finding was consistent with other studies measuring the same domain average score of Cyberjaya University College of Medical Sciences (CUCMS), Nil Ratan Sircar Medical College (NRSMC), and College of Medicine and Sagore Dutta Hospital (CMSDH) [ 9 , 11 ]; however, this finding was in contrast to that of PUGSOM [ 40 ]. A possible explanation might be related to the aforementioned reasons, which were associated with students’ perceptions of gender discrimination, stress in the first year due to the new environment and in the third year due to engagement in clinical practice, and their achievements, which elevated stress when they had lower GPAs. Previous studies have shown that the prevalence of stress is greater during the first three years of medical education, which is consistent with our findings [ 35 ].
In contrast, the physical space domain in our study received the highest score, where we believe that physical space has improved as a result of the college's 2018 expansion [ 41 ].
Strengths and limitations
One key strength of this study is the employment of a comprehensive mixed methods approach to gain an understanding of how students perceive their learning environment. This approach collects numerical data, delves deeply into the students’ experiences and feelings, and provides valuable insights through the integration of findings from both approaches. Another strength of this study is the large number of participants from different academic years, which allows for a diverse range of perspectives from both new and experienced students.
Nevertheless, convenience sampling may not fully represent the student population and limits the generalizability of the findings. Additionally, focusing on one institution may not capture the experiences of students across different settings, cultures, or cities, potentially limiting the applicability of any recommendations to other medical colleges or regions. However, the large sample size, the diversity of data and the integration of results may enhance the transferability of the findings.
Recommendations for educational institutions
Enhance faculty development: Address the issues of perceived neutrality and reported negative interactions with faculty by investing in faculty development programs. These programs should focus on improving communication skills and mentoring abilities and cultivating more supportive and encouraging faculty‒student relationships. Creating opportunities for regular feedback from students can also aid in faculty improvement. This is important as students showed high tendency to be influenced by advice from faculty member.
Cultivate Supportive Environments: Foster a less stressful academic climate by promoting a culture of mutual respect and collaboration within the institution. Encourage open dialog between students and faculty, where questions and concerns can be raised without judgment. Stress management and well-being programs should be implemented to help students cope with academic pressures.
Revise Curriculum and Mentorship Programs: Address curriculum concerns by engaging students in the curriculum development process. Consider their suggestions for better organization, logical flow, and references. Additionally, structured mentorship programs that connect students with experienced doctors who can provide guidance, share experiences, and serve as positive role models should be established.
Evaluate and Improve Support Services: Reevaluate the effectiveness of support services such as the students' council and academic support departments. These services are responsive to students' needs and have the authority to enact meaningful changes. Regularly solicit feedback from students to gauge the impact of these services.
Promote Inclusivity and Gender Equity: as FGDs showed that both genders feel discriminated against, creating initiatives to address perceptions of discrimination and gender bias within the learning environment is important. This may involve raising awareness, offering training on gender sensitivity, and implementing policies that promote inclusivity and equal opportunities for all students, regardless of gender.
Recommendations for further research:
Longitudinal studies should be conducted to track the changes in students’ perceptions and experiences. This will help us identify emerging trends and understand the long-term effects of interventions and policy changes.
This research can be expanded by including studies with medical schools or institutions to validate our findings and assess how applicable they are in diverse educational settings.
The use of mixed methods research in the field of education should be further explored. Investigate approaches that combine qualitative and deductive methods to gain deeper insights into students’ educational experiences.
Dive deeper into specific areas highlighted in this research, such as mentoring programs and concerns related to the curriculum. Explore ways to enhance mentoring effectiveness and develop strategies for improving the curriculum to create a learning environment.
Interventions targeted at addressing identified areas should be implemented for improvement while thoroughly evaluating their impact. This will enable institutions to assess the effectiveness of these interventions based on data-driven decisions leading to the enhancement of education.
This study was the first to assess the learning environment of medical students at COM-KSU through quantitative and qualitative approaches. The overall average JHLES score indicated room for improvement, in line with global trends. Gender disparities, challenges in different academic years, and the critical role of mentorship were identified. Academic performance correlated positively with students' perceptions, while inclusion and safety were areas of concern. The physical space domain received the highest score, reflecting investments in infrastructure. These findings underscore the need for targeted interventions to address gender disparities, enhance mentorship, improve student engagement, and ensure inclusivity and safety, ultimately enhancing the educational experience of COM-KSU medical students.
Availability of data and materials
The datasets used and analyzed during the current study are available for request from the corresponding author.
Abbreviations
- Learning environment
Johns Hopkins Learning Environment Scale
College of Medicine at King Saud University
Dundee Ready Educational Environment Measure
Focused group discussions
Medical School Learning Environment Survey
Cyberjaya University College of Medical Sciences
Nil Ratan Sircar Medical College
College of Medicine and Sagore Dutta Hospital
Rusticus SA, Wilson D, Casiro O, Lovato C. Evaluating the quality of health professions learning environments: development and validation of the Health Education Learning Environment Survey (HELES). Eval Health Prof. 2020;43:162–8.
Article Google Scholar
Dunham L, Dekhtyar M, Gruener G, CichoskiKelly E, Deitz J, Elliott D, Stuber ML, Skochelak SE. Medical student perceptions of the learning environment in medical school change as students transition to clinical training in undergraduate medical school. Teach Learn Med. 2017;29:383–91.
Wayne SJ, Fortner SA, Kitzes JA, Timm C, Kalishman S. Cause or effect? The relationship between student perception of the medical school learning environment and academic performance on USMLE Step 1. Med Teach. 2013;35:376–80.
Harden RM. The learning environment and the curriculum. Med Teach. 2001;23:335–6.
Al Ayed IH, Sheik SA. Assessment of the educational environment at the college of medicine of king Saud University, Riyadh. EMHJ - East Mediterr Health J. 2008;14(4):953–9.
Google Scholar
Soliman MM, Sattar K, Alnassar S, Alsaif F, Alswat K, Alghonaim M, Alhaizan M, Al-Furaih N. Medical students’ perception of the learning environment at King Saud University Medical College, Saudi Arabia, using DREEM inventory. Adv Med Educ Pract. 2017;8:221–7.
Shochet RB, Colbert-Getz JM, Wright SM. The Johns Hopkins learning environment scale: measuring medical students’ perceptions of the processes supporting professional formation. Acad Med J Assoc Am Med Coll. 2015;90:810–8.
R Core Team (2022) R: The R Project for Statistical Computing. https://www.r-project.org/ . Accessed 13 Aug 2023
Sengupta P, Sharma A, Das N. Perception of Learning environment among undergraduate medical students in two different medical schools through DREEM and JHLES Questionnaire. J Clin Diagn Res JCDR. 2017;11:JC01–4.
Shahzad S, Wajid G. How different is the learning environment of public and private sector medical colleges in Lahore, Pakistan? Pak J Med Sci. 2023;39:757–63.
Tackett S, Shochet R, Shilkofski NA, Colbert-Getz J, Rampal K, Abu Bakar H, Wright S. Learning environment assessments of a single curriculum being taught at two medical schools 10,000 miles apart. BMC Med Educ. 2015;15:105.
Al-Hazimi A, Zaini R, Al-Hyiani A, Hassan N, Gunaid A, Ponnamperuma G, Karunathilake I, Roff S, McAleer S, Davis M. Educational environment in traditional and innovative medical schools: a study in four undergraduate medical schools. Educ Health Abingdon Engl. 2004;17:192–203.
Schultz-Jones B, Ledbetter C, Bishop J (2014) Investigating Differences Between Male and Female Students’ Perceptions of School Library Learning Environments. IASL Annu Conf Proc. https://doi.org/10.29173/iasl7867 .
Tanya Albert Henry (2016) Med students’ perceptions of learning environment matter. In: Am. Med. Assoc. https://www.ama-assn.org/education/accelerating-change-medical-education/med-students-perceptions-learning-environment . Accessed 13 Aug 2023.
Mahmood H, Chaudhry MA, Rashid H, Farani TM, Ali AR, Batool Z, Amin B. Medical student’s perception of educational environment. Proceedings. 2020;34:47–51.
Xie Y, Cao D, Sun T, Yang LB. The effects of academic adaptability on academic burnout, immersion in learning, and academic performance among Chinese medical students: a cross-sectional study. BMC Med Educ. 2019. https://doi.org/10.1186/s12909-019-1640-9 .
Verbree A-R, Isik U, Janssen J, Dilaver G. Inclusion and diversity within medical education: a focus group study of students’ experiences. BMC Med Educ. 2023;23:61.
Sarwar S, Tarique S. Perception of educational environment: does it impact academic performance of medical students? JPMA J Pak Med Assoc. 2016;66:1210–4.
Yoo D-M, Kim D-H. The relationship between students’ perception of the educational environment and their subjective happiness. BMC Med Educ. 2019;19:409.
Almansour M, AlMehmadi BA, Zeb NG, Matbouly G, Sami W, Badahdah A-M. Promising score for teaching and learning environment: an experience of a fledgling medical college in Saudi Arabia. BMC Med Educ. 2023;23:479.
Eyal L, Cohen R. Preparation for clinical practice: a survey of medical students’ and graduates’ perceptions of the effectiveness of their medical school curriculum. Med Teach. 2006;28:e162-170.
Fleit HB, Lu W-H, Olvet DM, Chandran L. Medical students’ perception of behaviors in the clinical learning environment evolve with increasing clinical exposure as measured with situational video vignettes. Med Teach. 2020;42:822–7.
Dobie S, Smith S, Robins L. How assigned faculty mentors view their mentoring relationships: an interview study of mentors in medical education. Mentor Tutoring Partnersh Learn. 2010;18:337–59.
Rose GL, Rukstalis MR, Schuckit MA. Informal mentoring between faculty and medical students. Acad Med J Assoc Am Med Coll. 2005;80:344–8.
Sonawane T, Meshram R, Jagia G, Gajbhiye R, Adhikari S. Effects of Mentoring in First Year Medical Undergraduate Students using DASS-21. J Clin Diagn Res. 2021. https://doi.org/10.7860/JCDR/2021/50102.15682 .
Cress CM. Creating inclusive learning communities: the role of student–faculty relationships in mitigating negative campus climate. Learn Inq. 2008;2:95–111.
Hendelman W, Byszewski A. Formation of medical student professional identity: categorizing lapses of professionalism, and the learning environment. BMC Med Educ. 2014;14:139.
Neufeld A, Malin G. How medical students’ perceptions of instructor autonomy-support mediate their motivation and psychological well-being. Med Teach. 2020;42:650–6.
Costino K. Equity-minded faculty development: an intersectional identity-conscious community of practice model for faculty learning. Metrop Univ. 2018;29:117–36.
Al-Mohaimeed A. Perceptions of the educational environment of a new medical school, Saudi Arabia. Int J Health Sci. 2013;7:150–9.
Altemani AH, Merghani TH. The quality of the educational environment in a medical college in Saudi Arabia. Int J Med Educ. 2017;8:128–32.
Lerchenfeldt S, Mi M, Eng M. The utilization of peer feedback during collaborative learning in undergraduate medical education: a systematic review. BMC Med Educ. 2019;19:321.
Nofziger AC, Naumburg EH, Davis BJ, Mooney CJ, Epstein RM. Impact of peer assessment on the professional development of medical students: a qualitative study. Acad Med J Assoc Am Med Coll. 2010;85:140–7.
Yamada Y, Klugar M, Ivanova K, Oborna I. Psychological distress and academic self-perception among international medical students: the role of peer social support. BMC Med Educ. 2014;14:256.
Abdulghani HM, AlKanhal AA, Mahmoud ES, Ponnamperuma GG, Alfaris EA. Stress and its effects on medical students: a cross-sectional study at a college of medicine in Saudi Arabia. J Health Popul Nutr. 2011;29:516–22.
Khursheed I, Baig L. Students’ perceptions of educational environment of a private medical school in Pakistan. JPMA J Pak Med Assoc. 2014;64:1244–9.
Mayya S, Roff S. Students’ perceptions of educational environment: a comparison of academic achievers and under-achievers at kasturba medical college, India. Educ Health Abingdon Engl. 2004;17:280–91.
Ahmed Y, Taha MH, Al-Neel S, Gaffar AM. Students’ perception of the learning environment and its relation to their study year and performance in Sudan. Int J Med Educ. 2018. https://doi.org/10.5116/ijme.5af0.1fee .
Corell A, Regueras LM, Verdú E, Verdú MJ, de Castro JP. Effects of competitive learning tools on medical students: a case study. PLoS ONE. 2018;13.
Tackett S, Bakar HA, Shilkofski NA, Coady N, Rampal K, Wright S. Profiling medical school learning environments in Malaysia: a validation study of the Johns Hopkins Learning Environment Scale. J Educ Eval Health Prof. 2015;12.
King Saud University Medical City. المدينة الطبية بجامعة الملك سعود | news. 2018. https://medicalcity.ksu.edu.sa/ar/news/details/26-10-2018 . Accessed 21 Oct 2023
Download references
Acknowledgements
Not applicable.
This research is non-funded.
Author information
Authors and affiliations.
Department of Medical Education, College of Medicine, King Saud University, Riyadh, Saudi Arabia
Mohammed Almansour
Department of Family and Community Medicine, College of Medicine, King Saud University, Riyadh, Saudi Arabia
Noura Abouammoh & Hani A. Alghamdi
College of Medicine, King Saud University, Riyadh, Saudi Arabia
Reem Bin Idris, Omar Abdullatif Alsuliman, Renad Abdulrahman Alhomaidi & Mohammed Hamad Alhumud
You can also search for this author in PubMed Google Scholar
Contributions
All authors made a significant contribution to the work reported, whether that is in the conception, study design, execution, acquisition of data, analysis and interpretation, or in all these areas; took part in drafting, revising or critically reviewing the article; gave final approval of the version to be published; have agreed on the journal to which the article has been submitted; and agree to be accountable for all aspects of the work.
Corresponding author
Correspondence to Hani A. Alghamdi .
Ethics declarations
Ethics approval and consent to participate.
This study was approved by King Saud University’s Institutional Review Board (KSU IRB) with the approval number E-22–7298.
Consent to participate
Electronic informed consent was obtained from all participants in the quantitative arm, and written informed consent was obtained from all participants in the qualitative arm before they participated in the study.
Consent for publication
Competing interests.
The authors declare that they have no competing interests.
Additional information
Publisher’s note.
Springer Nature remains neutral with regard to jurisdictional claims in published maps and institutional affiliations.
Rights and permissions
Open Access This article is licensed under a Creative Commons Attribution 4.0 International License, which permits use, sharing, adaptation, distribution and reproduction in any medium or format, as long as you give appropriate credit to the original author(s) and the source, provide a link to the Creative Commons licence, and indicate if changes were made. The images or other third party material in this article are included in the article's Creative Commons licence, unless indicated otherwise in a credit line to the material. If material is not included in the article's Creative Commons licence and your intended use is not permitted by statutory regulation or exceeds the permitted use, you will need to obtain permission directly from the copyright holder. To view a copy of this licence, visit http://creativecommons.org/licenses/by/4.0/ . The Creative Commons Public Domain Dedication waiver ( http://creativecommons.org/publicdomain/zero/1.0/ ) applies to the data made available in this article, unless otherwise stated in a credit line to the data.
Reprints and permissions
About this article
Cite this article.
Almansour, M., Abouammoh, N., Idris, R.B. et al. Exploring medical students' experience of the learning environment: a mixed methods study in Saudi medical college. BMC Med Educ 24 , 723 (2024). https://doi.org/10.1186/s12909-024-05716-4
Download citation
Received : 14 March 2024
Accepted : 26 June 2024
Published : 03 July 2024
DOI : https://doi.org/10.1186/s12909-024-05716-4
Share this article
Anyone you share the following link with will be able to read this content:
Sorry, a shareable link is not currently available for this article.
Provided by the Springer Nature SharedIt content-sharing initiative
- Medical education
- Comparative studies
- Mixed methods
BMC Medical Education
ISSN: 1472-6920
- Submission enquiries: [email protected]
- General enquiries: [email protected]
Root out friction in every digital experience, super-charge conversion rates, and optimize digital self-service
Uncover insights from any interaction, deliver AI-powered agent coaching, and reduce cost to serve
Increase revenue and loyalty with real-time insights and recommendations delivered to teams on the ground
Know how your people feel and empower managers to improve employee engagement, productivity, and retention
Take action in the moments that matter most along the employee journey and drive bottom line growth
Whatever they’re are saying, wherever they’re saying it, know exactly what’s going on with your people
Get faster, richer insights with qual and quant tools that make powerful market research available to everyone
Run concept tests, pricing studies, prototyping + more with fast, powerful studies designed by UX research experts
Track your brand performance 24/7 and act quickly to respond to opportunities and challenges in your market
Explore the platform powering Experience Management
- Free Account
- Product Demos
- For Digital
- For Customer Care
- For Human Resources
- For Researchers
- Financial Services
- All Industries
Popular Use Cases
- Customer Experience
- Employee Experience
- Employee Exit Interviews
- Net Promoter Score
- Voice of Customer
- Customer Success Hub
- Product Documentation
- Training & Certification
- XM Institute
- Popular Resources
- Customer Stories
- Artificial Intelligence
Market Research
- Partnerships
- Marketplace
The annual gathering of the experience leaders at the world’s iconic brands building breakthrough business results, live in Sydney.
- English/AU & NZ
- Español/Europa
- Español/América Latina
- Português Brasileiro
- REQUEST DEMO
- Experience Management
- The Ultimate Guide to Market Research
- Quantitative Research
Try Qualtrics for free
Your ultimate guide to quantitative research.
12 min read You may be already using quantitative research and want to check your understanding, or you may be starting from the beginning. Here’s an exploration of this research method and how you can best use it for maximum effect for your business.
You may be already using quantitative research and want to check your understanding, or you may be starting from the beginning. Here’s an exploration of this research method and how you can best use it for maximum effect for your business.
What is quantitative research?
Quantitative is the research method of collecting quantitative data – this is data that can be converted into numbers or numerical data, which can be easily quantified, compared, and analysed.
Quantitative research deals with primary and secondary sources where data is represented in numerical form. This can include closed-question poll results, statistics, and census information or demographic data .
Quantitative data tends to be used when researchers are interested in understanding a particular moment in time and examining data sets over time to find trends and patterns.
To collect numerical data, surveys are often employed as one of the main research methods to source first-hand information in primary research . Qualitative research can also come from third-party research studies .
Quantitative research is widely used in the realms of social sciences, such as biology, chemistry, psychology, economics, sociology, and marketing .
Research teams collect data that is significant to proving or disproving a hypothesis research question – known as the research objective. When they collect quantitative data, researchers will aim to use a sample size that is representative of the total population of the target market they’re interested in.
Then the data collected will be manually or automatically stored and compared for insights.
Free Download: Improve your market research with our Ultimate Guide to Market Research eBook
Qualitative vs quantitative research
While the quantitative research definition focuses on numerical data, qualitative research is defined as data that supplies non-numerical information.
Quantitative research focuses on the thoughts, feelings, and values of a participant , to understand why people act in the way they do . They result in data types like quotes, symbols, images, and written testimonials.
These data types tell researchers subjective information, which can help us assign people into categories, such as a participant’s religion, gender , social class, political alignment, likely favoured products to buy, or their preferred training learning style.
For this reason, qualitative research is often used in social research, as this gives a window into the behaviour and actions of people.
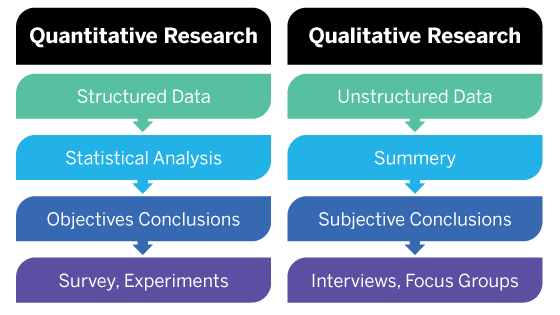
In general, if you’re interested in measuring something or testing a hypothesis, use quantitative methods. If you want to explore ideas, thoughts, and meanings, use qualitative methods.
However, quantitative and qualitative research methods are both recommended when you’re looking to understand a point in time, while also finding out the reason behind the facts.
Quantitative research data collection methods
Quantitative research methods can use structured research instruments like:
- Surveys : A survey is a simple-to-create and easy-to-distribute research method , which helps gather information from large groups of participants quickly. Traditionally, paper-based surveys can now be made online, so costs can stay quite low.
Quantitative questions tend to be closed questions that ask for a numerical result, based on a range of options, or a yes/no answer that can be tallied quickly.
- Face-to-face or phone interviews: Interviews are a great way to connect with participants , though they require time from the research team to set up and conduct.
Researchers may also have issues connecting with participants in different geographical regions . The researcher uses a set of predefined close-ended questions, which ask for yes/no or numerical values.
- Polls: Polls can be a shorter version of surveys , used to get a ‘flavour’ of what the current situation is with participants. Online polls can be shared easily, though polls are best used with simple questions that request a range or a yes/no answer.
Quantitative data is the opposite of qualitative research, another dominant framework for research in the social sciences, explored further below.
Quantitative data types
Quantitative research methods often deliver the following data types:
- Test Scores
- Percent of training course completed
- Performance score out of 100
- Number of support calls active
- Customer Net Promoter Score (NPS)
When gathering numerical data, the emphasis is on how specific the data is, and whether they can provide an indication of what ‘is’ at the time of collection. Pre-existing statistical data can tell us what ‘was’ for the date and time range that it represented
Quantitative research design methods (with examples)
Quantitative research has a number of quantitative research designs you can choose from:
Descriptive
This design type describes the state of a data type is telling researchers, in its native environment. There won’t normally be a clearly defined research question to start with. Instead, data analysis will suggest a conclusion , which can become the hypothesis to investigate further.
Examples of descriptive quantitative design include:
- A description of child’s Christmas gifts they received that year
- A description of what businesses sell the most of during Black Friday
- A description of a product issue being experienced by a customer
Correlational
This design type looks at two or more data types, the relationship between them, and the extent that they differ or align. This does not look at the causal links deeper – instead statistical analysis methods looks at the variables in a natural environment.
Examples of correlational quantitative design include:
- The relationship between a child’s Christmas gifts and their perceived happiness level
- The relationship between a business’ sales during Black Friday and the total revenue generated over the year
- The relationship between a customer’s product issue and the reputation of the product
Causal-Comparative/Quasi-Experimental
This design type looks at two or more data types and tries to explain any relationship and differences between them, using a cause-effect analysis. The research is carried out in a near-natural environment, where information is gathered from two groups – a naturally occurring group that matches the original natural environment, and one that is not naturally present.
This allows for causal links to be made, though they might not be correct, as other variables may have an impact on results.
Examples of causal-comparative/quasi-experimental quantitative design include:
- The effect of children’s Christmas gifts on happiness
- The effect of Black Friday sales figures on the productivity of company yearly sales
- The effect of product issues on the public perception of a product
Experimental Research
This design type looks to make a controlled environment in which two or more variables are observed to understand the exact cause and effect they have. This becomes a quantitative research study, where data types are manipulated to assess the effect they have. The participants are not naturally occurring groups, as the setting is no longer natural. A quantitative research study can help pinpoint the exact conditions in which variables impact one another.
Examples of experimental quantitative design include:
- The effect of children’s Christmas gifts on a child’s dopamine (happiness) levels
- The effect of Black Friday sales on the success of the company
- The effect of product issues on the perceived reliability of the product
Quantitative research methods need to be carefully considered, as your data collection of a data type can be used to different effects. For example, statistics can be descriptive or correlational (or inferential). Descriptive statistics help us to summarise our data, while inferential statistics help infer conclusions about significant differences.
Advantages of quantitative research
- Easy to do : Doing quantitative research is more straightforward, as the results come in numerical format, which can be more easily interpreted.
- Less interpretation : Due to the factual nature of the results, you will be able to accept or reject your hypothesis based on the numerical data collected.
- Less bias : There are higher levels of control that can be applied to the research, so bias can be reduced , making your data more reliable and precise.
Disadvantages of quantitative research
- Can’t understand reasons: Quantitative research doesn’t always tell you the full story, meaning you won’t understand the context – or the why, of the data you see, why do you see the results you have uncovered?
- Useful for simpler situations: Quantitative research on its own is not great when dealing with complex issues. In these cases, quantitative research may not be enough.
How to use quantitative research to your business’s advantage
Quantitative research methods may help in areas such as:
- Identifying which advert or landing page performs better
- Identifying how satisfied your customers are
- How many customers are likely to recommend you
- Tracking how your brand ranks in awareness and customer purchase intent
- Learn what consumers are likely to buy from your brand.
6 steps to conducting good quantitative research
Businesses can benefit from quantitative research by using it to evaluate the impact of data types. There are several steps to this:
- Define your problem or interest area : What do you observe is happening and is it frequent? Identify the data type/s you’re observing.
- Create a hypothesis : Ask yourself what could be the causes for the situation with those data types.
- Plan your quantitative research : Use structured research instruments like surveys or polls to ask questions that test your hypothesis.
- Data Collection : Collect quantitative data and understand what your data types are telling you. Using data collected on different types over long time periods can give you information on patterns.
- Data analysis : Does your information support your hypothesis? (You may need to redo the research with other variables to see if the results improve)
- Effectively present data : Communicate the results in a clear and concise way to help other people understand the findings.
How Qualtrics products can enhance & simplify the quantitative research process
The Qualtrics XM system gives you an all-in-one, integrated solution to help you all the way through conducting quantitative research. From survey creation and data collection to statistical analysis methods and data reporting, it can help all your internal teams gain insights from your numerical data.
Quantitative methods are catered to your business through templates or advanced survey designs. While you can manually collect data and conduct data analysis in a spreadsheet program, this solution helps you automate the process of quantitative research, saving you time and administration work.
Using computational techniques helps you to avoid human errors, and participant results come in are already incorporated into the analysis in real-time.
Our key tools, Stats IQ™ and Driver IQ™ make analysing numerical data easy and simple. Choose to highlight key findings based on variables or highlight statistically insignificant findings. The choice is yours.

Some examples of your workspace in action, using drag and drop to create fast data visualisations quickly:

Find out how Qualtrics XM solution can help improve research team’s quantitative methods
Related resources
Market intelligence tools 10 min read, qualitative research questions 11 min read, primary vs secondary research 14 min read, business research methods 12 min read, ethnographic research 11 min read, business research 10 min read, qualitative research design 12 min read, request demo.
Ready to learn more about Qualtrics?
IMAGES
VIDEO
COMMENTS
Quantitative research methods. You can use quantitative research methods for descriptive, correlational or experimental research. In descriptive research, you simply seek an overall summary of your study variables.; In correlational research, you investigate relationships between your study variables.; In experimental research, you systematically examine whether there is a cause-and-effect ...
Quantitative Research Methods are as follows: Descriptive Research Design. Descriptive research design is used to describe the characteristics of a population or phenomenon being studied. This research method is used to answer the questions of what, where, when, and how. Descriptive research designs use a variety of methods such as observation ...
Quantitative research methods are used to observe events that affect a particular group of individuals, which is the sample population. In this type of research, diverse numerical data are collected through various methods and then statistically analyzed to aggregate the data, compare them, or show relationships among the data. ...
Quantitative methods can also be used to test hypotheses by conducting quasi-experimental studies or designing experiments. Independent and Dependent Variables In quantitative research, a variable is something (an intervention technique, a pharmaceutical, a temperature, etc.) that changes.
About Research Methods. This guide provides an overview of research methods, how to choose and use them, and supports and resources at UC Berkeley. As Patten and Newhart note in the book Understanding Research Methods, "Research methods are the building blocks of the scientific enterprise. They are the "how" for building systematic knowledge.
Quantitative research methods. a method of research that relies on measuring variables using a numerical system, analyzing these measurements using any of a variety of statistical models, and reporting relationships and associations among the studied variables. For example, these variables may be test scores or measurements of reaction time.
Quantitative research methods. You can use quantitative research methods for descriptive, correlational or experimental research. In descriptive research, you simply seek an overall summary of your study variables.; In correlational research, you investigate relationships between your study variables.; In experimental research, you systematically examine whether there is a cause-and-effect ...
Quantitative research is a research strategy that focuses on quantifying the collection and analysis of data. It is formed from a deductive approach where emphasis is placed on the testing of theory, shaped by empiricist and positivist philosophies.. Associated with the natural, applied, formal, and social sciences this research strategy promotes the objective empirical investigation of ...
Quantitative method is the collection and analysis of numerical data to answer scientific research questions. Quantitative method is used to summarize, average, find patterns, make predictions, and test causal associations as well as generalizing results to wider populations. It allows us to quantify effect sizes, determine the strength of ...
Quantitative research is a type of research that focuses on collecting and analyzing numerical data to answer research questions. There are two main methods used to conduct quantitative research: 1. Primary Method. There are several methods of primary quantitative research, each with its own strengths and limitations.
The main difference between quantitative and qualitative research is the type of data they collect and analyze. Quantitative research collects numerical data and analyzes it using statistical methods. The aim is to produce objective, empirical data that can be measured and expressed in numerical terms.
Quantitative research Quantitative research is expressed in numbers and graphs. It is used to test or confirm theories and assumptions. This type of research can be used to establish generalizable facts. about a topic. Common quantitative methods include experiments, observations recorded as numbers, and surveys with closed-ended questions.
These parts can also be used as a checklist when working through the steps of your study. Specifically, part 1 focuses on planning a quantitative study (collecting data), part two explains the steps involved in doing a quantitative study, and part three discusses how to make sense of your results (organizing and analyzing data). Research Methods.
Unlike in quantitative research where hypotheses are usually developed to be tested, qualitative research can lead to both hypothesis-testing and hypothesis-generating outcomes.2 When studies require both quantitative and qualitative research questions, this suggests an integrative process between both research methods wherein a single mixed ...
What is Quantitative Research? Quantitative methodology is the dominant research framework in the social sciences. It refers to a set of strategies, techniques and assumptions used to study psychological, social and economic processes through the exploration of numeric patterns.Quantitative research gathers a range of numeric data.
Secondary quantitative research methods; Primary Quantitative Research Methods. Primary quantitative research is the most widely used method of conducting market research. The distinct feature of primary research is that the researcher focuses on collecting data directly rather than depending on data collected from previously done research ...
Quantitative Research Methods are integral for those aiming to conduct rigorous and objective research. They offer invaluable insights through structured and systematic procedures, allowing researchers to draw verifiable and statistical conclusions. This guide will explore the fundamental components of these techniques, emphasizing the ...
Mixed-methods research is a flexible approach, where the research design is determined by what we want to find out rather than by any predetermined epistemological position. In mixed-methods research, qualitative or quantitative components can predominate, or both can have equal status. 1.4. Units and variables.
Quantitative research methods can use structured research instruments like: Surveys: A survey is a simple-to-create and easy-to-distribute research method, which helps gather information from large groups of participants quickly. Traditionally, paper-based surveys can now be made online, so costs can stay quite low. ...
Quantitative research methodology: The goal of quantitative research is to test hypotheses, confirm assumptions and theories, and determine cause-and-effect relationships. Quantitative research methods include experiments, close-ended survey questions, and countable and numbered observations. Data analysis for quantitative research relies ...
Quantitative methods emphasize objective measurements and the statistical, mathematical, or numerical analysis of data collected through polls, questionnaires, and surveys, or by manipulating pre-existing statistical data using computational techniques.Quantitative research focuses on gathering numerical data and generalizing it across groups of people or to explain a particular phenomenon.
Quantitative research is a systematic investigation method that relies on numerical data to answer research questions or test hypotheses. Unlike qualitative research, which deals with subjective experiences and meanings, quantitative research aims to quantify relationships, behaviors, or phenomena through statistical analysis .
Quantitative research methods provide an relatively conclusive answer to the research questions. When the data is collected and analyzed in accordance with standardized, reputable methodology, the results are usually trustworthy. With statistically significant sample sizes, the results can be generalized to an entire target group.
Listen to this episode from My Blog » Izabelle Miranda on Spotify. Download EPub Social Research Methods: Qualitative, Quantitative and Mixed Methods Approaches by Sigmund Gronmo Online Full Chapters Read ePub Social Research Methods: Qualitative, Quantitative and Mixed Methods Approaches by Sigmund Gronmo is a great book to read and thats why I recommend reading or downloading ebook Social ...
A key challenge in expanding a student's quantitative and critical-thinking skills is to connect learning opportunities to curricular activities of paramount interest and relevance to students. A semester-long course-embedded research project with a focus on quantitative analyses of critical minerals was developed to enhance student skill sets and to grow a workforce informed for the energy ...
Findings from quantitative and qualitative methods were integrated using joint display. A total of 653 medical students completed the JHLES. The total average score was 81 out of 140 (16.8), and the average subscale scores ranged from 2.27 (0.95) for inclusion and safety to 3.37 (0.91) for community of peers. ... This research offers valuable ...
Quantitative research methods can use structured research instruments like: Surveys: A survey is a simple-to-create and easy-to-distribute research method, which helps gather information from large groups of participants quickly. Traditionally, paper-based surveys can now be made online, so costs can stay quite low. ...