

The Simple View of Reading
Dec 27, 2013
1.63k likes | 1.77k Views
The Simple View of Reading. Bruce Rosow, Ed.D. March, 2013. I. Setting the Stage:. National Report Card: NAEP PISA: International Student Assessment The Simple View of Reading Learning to Read Decoding Comprehension. NAEP Reading: National Results. NAEP Reading: National Results.
Share Presentation
- higher education income gap
- national report card
- thomas piketty
- financial success
- meeting benchmark

Presentation Transcript
The Simple View of Reading Bruce Rosow, Ed.D. March, 2013
I. Setting the Stage: • National Report Card: NAEP • PISA: International Student Assessment • The Simple View of Reading Learning to Read Decoding Comprehension
NAEP Reading: National Results
NAEP Reading: Massachusetts to National Scores
NAEP Reading: Massachusetts Over Time
Wide Disparity Among Sub-groups • The NAEP and state assessments show large achievement gaps between subgroups of students disaggregated by race/ethnicity, and poverty status. At 4th grade the gap between: White and African American students is 27 % White and Hispanic students is 24 – 26 %. High to Low SES students is 23 – 25 % McCombs et al, RAND Report, 2004
2011 Urban District Results (Washington, D.C.) – Reading scores of fourth- and eighth-grade students in 21 urban public school districts on the 2011 National Assessment of Educational Progress (NAEP) followed the national trend by remaining mostly flat, with no significant change from 2009.
SAT and ACT Since the 1960’s verbal scores on the SAT have declined by about .5 SD. On the ACT, barely 50% are able to read adequately to manage college and work-place tasks.
SAT TAMAR LEWIN Published: NY Times September 24, 2012 • For the high school class of 2012, the average score on the critical reading section of the SAT college entrance exam, 496, was down 1 point from the previous year, as was the average writing score, 488. • Also unchanged: only 43 percent of the 1.66 million test-takers achieved the benchmark score, 1550, that indicates readiness for college. • Among students whose parents have bachelor’s degrees, though, 60 percent were college ready.
SAT / ACT Dr. Danielle Thompson The state with the best scores on ACT and SAT tests is at 42% proficiency. This means that 42% of the students who take the test make the benchmark score. Meeting benchmark is correlated with having a 50% chance of obtaining a 'B' in a college course and a 75% chance of getting a 'C.' The top state was New Hampshire. North Dakota only has a 21% proficiency level, Tennessee is 18%.
Program for International Student Assessment (PISA), 2009 http://nces.ed.gov/surveys/pisa/ http://nces.ed.gov/pubs2011/2011004_1.pdf
PISA 2009 ReadingLiteracy: OECD • U.S. average score of 500 not measurably different from the OECD average score of 493 • 6 OECD countries had higher average scores. • 14 were not measurably different from the United States. • 13 had lower average scores. SOURCE: Fleischman et al. (2010). Highlights From PISA 2009: Performance of U.S. 15-Year-Old Students in Reading, Mathematics, and Science Literacy in an International Context (NCES 2011-004) . 14
PISA 2009 Reading Literacy: All • Among all participants • 9 had higher average scores than the United States. • 16 were not measurably different. • 39 had lower average scores. SOURCE: Fleischman et al. (2010). Highlights From PISA 2009: Performance of U.S. 15-Year-Old Students in Reading, Mathematics, and Science Literacy in an International Context (NCES 2011-004) . 15
Scores of U.S. 15-year-old students on combined reading literacy scale at selected percentiles: 2000, 2003, and 2009
PISA 2009 Reading Proficiency Levels • Highest proficiency level is level 6. • Below level 2 students may not be able to consistently “make valid comparisons or contrasts” based on even a single feature in the text or consistently “recognize the main idea in a text unless it is prominent” in the text. • At level 4 students are described by PISA as capable of “difficult reading tasks” and “critically evaluating” a text. SOURCE: Fleischman et al. (2010). Highlights From PISA 2009: Performance of U.S. 15-Year-Old Students in Reading, Mathematics, and Science Literacy in an International Context (NCES 2011-004) . 17
U.S. at the OECD Average for Key Proficiency Levels in Reading • 18 percent scored below level 2 (not measurably different from OECD). • 30 percent scored at or above level 4 (not measurably different from OECD). SOURCE: Fleischman et al. (2010). Highlights From PISA 2009: Performance of U.S. 15-Year-Old Students in Reading, Mathematics, and Science Literacy in an International Context (NCES 2011-004) . 18
Percentage distribution of 15-year-old students in the United States and OECD countries on combined reading literacy scale, by proficiency level: 2009 SOURCE: Organization for Economic Cooperation and Development (OECD), Program for International Student Assessment (PISA), 2009.
Average U.S. Reading Score Unchanged From 2000 • There was no measurable change in the U.S. average scores over time. • There was no measurable difference between U.S. and the OECD average scores in 2000 or in 2009. • OECD averages are based on 27 OECD member countries that participated in 2000 and 2009. 495 SOURCE: Fleischman et al. (2010). Highlights From PISA 2009: Performance of U.S. 15-Year-Old Students in Reading, Mathematics, and Science Literacy in an International Context (NCES 2011-004) . 20
Dr. Danielle Thompson The big message I took away from it was that we in the U.S. are doing nothing. We are not learning form the mistakes of others (e.g. Korea) or from the success of others (e.g. Finland). And, there are success in Korea to gain from too. The data of the PISA tests was pretty much buried when it came out and Thomas Friedman and Michael Mandelbaulm talk about that in their book That Use to be Us. I guess as a country we don't like to be seen as failing.
What is Good Enough? • To read comics in the newspaper, the basic level may be enough. • To digest thoughtful essays from which responsible citizens must understand the issues to become informed voters, at least a proficient level would be required. Caccamise et al., 2005
What is Good Enough? • To reach higher levels of academic achievement requiring such abilities as literary criticism and understanding of science and technology, levels of proficiency must be reached. Caccamise et al., 2005
If a child in a modern society like ours does not learn to read.. • Well enough to comprehend • Effortlessly enough to render reading pleasurable • Fluently enough to read reflectively and broadly across all content areas
If a child in a modern society like ours does not learn to read.. He/her chances for a fulfilling life, by whatever measure- academic success, financial success, the ability to find interesting work, personal autonomy, self-esteem- are practically nil E. Mcpike (1995)
If a child in a modern society like ours does not learn to read.. • 25% of the adult population in the US are functionally illiterate (U.S. Dept. Labor) • In the general population between a third and half of all adults have only very basic literacy skills. (Carlisle, 2002) • 70% or more of low SES, minority children fall behind early and are not likely to catch up to grade level
The Higher Education Income Gap (infoplease.com)
The Higher Education Income Gap Educational attainment, which created the American middle class, is no longer rising. The super-elite lavishes unlimited resources on its children, while public schools are starved of funding. This is the new Serrata. An elite education is increasingly available only to those already at the top. Bill Clinton and Barack Obama enrolled their daughters in an exclusive private school. CHRYSTIA FREELAND, NY Times, October 12, 2012
The Higher Education Income Gap The reality is that it is those at the top, particularly the tippy-top, of the economic pyramid who have been most effective at capturing government support — and at getting others to pay for it. CHRYSTIA FREELAND, NY Times, October 12, 2012
The Higher Education Income Gap Exhibit A is the bipartisan, $700 billion rescue of Wall Street in 2008. Exhibit B is the crony recovery. The economists Emmanuel Saez and Thomas Piketty found that 93 percent of the income gains from the 2009-10 recovery went to the top 1 percent of taxpayers. The top 0.01 percent captured 37 percent of these additional earnings, gaining an average of $4.2 million per household. CHRYSTIA FREELAND, NY Times, October 12, 2012
Between 1973 and 1998 • In skilled blue-collar, clerical, and related professions the percentage of workers who were high school dropouts fell by two thirds while the percentage of workers with some college or a college degree more than doubled. • In less-skilled blue-collar service the percentage of workers who were high school dropouts fell by nearly half while the percentage of workers with some college or a college degree tripled Reading Next Report, 2004
Changing Literacy Demands The 25 fastest growing professions have far greater than average literacy demands, while the 25 fastest declining professions have lower than average literacy demands. Barton, 2000 as cited in the Reading Next Report, 2004
Juvenile Detainees: • Illiteracy is perhaps the strongest common denominator among individuals in corrections (Kidder, 1990) • The average reading level nationally for ninth grade youth in correctional facilities is fourth grade (Project Read; 1978).
Juvenile Detainees: While poor reading skills and poor academic performance are not direct causes of criminal activity, adolescents who have deficits in these areas are disproportionately represented in correctional institutions. Some studies have explored the correlation between illiteracy and criminal behavior. They have found that individuals with a low literacy level are at greater risk for criminal behavior and incarceration (Bureau of Justice Statistics, 1997).
Vermont Juvenile Detainees: CHSVT • Typically, 50 % of the students under the age of 22 have a prior special education history. • Typically 60- 75% of the students under the age of 21 enrolled in CHSVT are not functionally literate. • This year the number of enrolled students was 486. Mary Koen, CHSVT, 2005
Juvenile Detainees: • In order to reduce crime rates and recidivism of students with disabilities and ethnic minorities in juvenile corrections, correctional educators need to incorporate programs that place a strong emphasis on literacy development. Advocates for correctional education believe that education prevents crime (Pell, 1997).
Reading is the Reason That Most “LD” Children Are Identified • At least 85% of the “LD” population are on IEP’s for serious reading problems and related issues with spoken and written language • Most of these children are identified for services after 3rd grade
“LD” Identification in the WNESU
The Importance of Early Intervention There was striking continuity in emergent literacy skills from pre-K to kindergarten. Individual differences were set by age four and quite stable thereafter. Lonigan, 2003
Meaningful Differences A majority of children who are judged to have a reading disability at grade 2 continue to have this classification at grade eight. Scarborough (1998)
Meaningful Differences Only about 5-10% of children who read satisfactorily in the primary grades ever stumble later, and 65-75% of children designated as reading disabled early on continue to read poorly throughout their school careers (and beyond). Scarborough, 2001. Cited in Carlisle, 2002
Children Don’t Catch Up… • Once children fall behind, they are likely to stay behind and the gap is likely to widen • C. Juel, 1994 (Harvard Graduate School of Education) • J. Torgesen, K. Stanovich, F. Vellutino (NICHD) • A. Biemiller (Toronto) • R. Good, E. Kame’enui, D. Simmons (U. of Oregon) • S. Shaywitz and J. Fletcher (Connecticut Longitudinal Study)
Reading Trajectories Are Established Early
Traditional Reading Tests Identify Children Too Late
Established Reading Trajectories Are Difficult to Change
In other words… Once behind, children who are poor readers do not catch up, unless we intervene specifically and intensively enough to match their need for systematic, direct, explicit instruction. Moats, 2004
Children who are poor readers do not catch up If we do not catch students early (by 2nd grade at the latest), improvement in their relative standing is much less likely and costs much more. Although many reading disabilities can be remediated or ameliorated by the end of first grade with systematic, explicit, phonics-emphasis instruction (Ryder, Tunmer, & Greaney, 2008; Mathes, Denton, Fletcher, Anthony, Francis, & Schatschneider, 2005) intensive effort on the part of teachers and students is required to achieve modest gains once students are beyond kindergarten and first grade. Moats, fall, 2012
Children who are poor readers do not catch up Morris, Lovett, Wolf, Sevcik, Stinbach, Frijters, & Shapiro (2012) recently showed that high school poor readers can improve .5 standard deviations in reading after expert, intensive, closely monitored, theoretically sound, comprehensive, integrated instruction was delivered for 70 hours. The teachers in these studies were experts in the subject matter, were well trained in the methodology and remedial strategies, and worked with well-defined populations of students. Moats, fall, 2012
Children who are poor readers do not catch up Aspects of reading instruction promoted by the CCSS (reading of harder, complex texts; reading aloud; reading in the content areas; writing arguments) may be appropriate for older students who already know how to read and write, but may serve only to frustrate less-skilled students if the text is impossible for them to read independently and if insufficient attention is devoted to building the requisite language skills that enable improvement. Moats, fall, 2012
Remediation verses PreventionTorgesen et al., 2003
- More by User

The climate of Reading
The climate of Reading. Roger Brugge [email protected] http://www.met.reading.ac.uk/~brugge Email me for a copy of this presentation or download it from my website . How do climate and weather differ?. Weather is the mix of events that happen each day in our atmosphere.
511 views • 34 slides

The Power of Reading
The Power of Reading. Jon Reyhner American Indian Teacher Education Conference Flagstaff, Arizona, July 14, 2012.
1.2k views • 44 slides

Reading Art and the art of reading
Reading Art and the art of reading. EQ: What does a carefully crafted character add to a text?
131 views • 4 slides

Three Simple Things...Automating VMware View
The slide deck from my presentation on automating VMware View using PowerShell and PowerCLI.
606 views • 23 slides

Monet, Claude. Wisteria. 1919. Oil on canvas. Musée Marmottan, Paris. . Reading Art and the art of reading. Rachael Sanford [email protected] Stephanie Tatum [email protected] Harrison High School Kennesaw, GA (678) 594-8104. The Power of Color.
792 views • 41 slides

The Importance of Reading
Develops Social Skills. The Importance of Reading. Reading is a great way to teach social skills because you can pick books that talk about different feelings. The child can see pictures in a book and discuss how different things make them feel. . Created By: Abi Mathwig.
472 views • 2 slides

View of the Parthenon
View of the Parthenon. Panarama of the Acropolis. Six (Seven?) figures of the Caryatid Porch of the Erechtheion on the Acropolis at Athens . Picture prior to being photoshopped.
155 views • 4 slides

The Joy of Reading
The Joy of Reading. Bronwen Loveday Cherrybrook Public School 2012. NYR 2012.
877 views • 14 slides

The Psychology of Reading
The Psychology of Reading. Developmental Reading Chapter 3. The Psychology of Reading. “A glimpse at the behavior of how you read. . .”. What is Psychology?. Psychology is the science of human mind that directs to human behavior , thinking, and intellectual processes. Eye Movements.
525 views • 12 slides

A IT Manager’s (Simple) View of BYOD
A IT Manager’s (Simple) View of BYOD. G. Harrison IT Manager, Lincoln College 15 th March 2013. The BYOD Puzzle. Thin Client. Remote Access. Wireless. Security. The BYOD Puzzle - Component. Thin Client. Remote Access. Wireless. Security. The BYOD Puzzle - Benefits.
145 views • 5 slides

The Power of Reading. A well-developed reading program is essential. A reading program is crucial. Research shows greater gains in vocabulary, spelling, writing, and grammar from reading than from direct instruction in those skills. The Power of Reading.
958 views • 22 slides

View of the ship
View of the ship. Hold inspection. View of loading. View of loading. View of loading. View of cutting bags in hold. View of material (P1 490mt Fesi). View of material (P1 490mt Fesi). View of material (P1 490mt Fesi). View of material (P1 490mt Fesi). View of material (P2 520mt Fesi).
494 views • 35 slides

Simple is as Simple Does: An Introduction to the Simple View of Reading
Simple is as Simple Does: An Introduction to the Simple View of Reading. Joe Magliano Department of Psychology. Overview of Discussion. Simple view of reading, 101 What is it? Why should I believe in it? Flies in the ointment. Evidence-Based Instruction and Assessment.
711 views • 15 slides

View Sharing draft-ietf-simple-view-sharing
View Sharing draft-ietf-simple-view-sharing. Jonathan Rosenberg Cisco. Problem Statement. Proposes a mechanism in response to draft-ietf-sipping-presence-scaling-requirements Meets all of the requirements, including preserving privacy and flexible authorization and composition policies.
143 views • 5 slides

THE TEACHER’S VIEW OF SCHOOL AND THE STUDENT’S VIEW OF SCHOOL
THE TEACHER’S VIEW OF SCHOOL AND THE STUDENT’S VIEW OF SCHOOL. T THE TEACHER’S VIEW OF THE SCHOOL HE TEACHER’S VIEW OF THE SCHOOL. Teaching is a difficult profession deal with the teaching process itself, as well as their relationship with other parties:. STUDENT. PRINCIPAL. PARENT.
822 views • 54 slides

The Simple Steps of
The Simple Steps of. Q. Courtesy of Amy Weaver, Gold Country Community Center, 2007. Accessing Clients In Q. Select Clients from menu options. Query ~ Searching for Specific Client in Q.
381 views • 26 slides

The brain Using the simple outlines of the brain (left side view) label:
The brain Using the simple outlines of the brain (left side view) label: cerebral hemisphere, cerebellum, medulla, spinal chord, hypothalamus and pituitary gland. Make a list of the main functions of each (try for a target of 2 per part – part of this is synoptic).
266 views • 15 slides

Simple View of Exchange Rate Determination
Simple View of Exchange Rate Determination. EUR exchange rate against the dollar: EUR value in USD. Source: FRB, NY. The ForEx market. Supply of the USD Imports to the US Goods (trade) Services (tourism) US investment abroad Foreign Financial Markets Direct investment abroad
237 views • 12 slides

The Power of Reading. Stopping Points. During my presentation, I will come to “stopping points” where I will ask to answer some questions. In order to answer the questions, you will need to take notes as I speak. Now, please get out a pen or pencil, and then we’ll begin.
348 views • 32 slides

The Power of Reading. Creating a love of reading in children is a powerful thing. Reading is taught and practised in school. However, home is a great place to practise in a more informal and relaxed atmosphere. We want to support parents and carers to feel informed
151 views • 13 slides

Simple hydraulic circuit (Pictorial view)
Simple hydraulic circuit (Pictorial view). Simple hydraulic circuit (Semi pictorial view). Simple hydraulic circuit (Symbolic method of presentation). Simple hydraulic circuit. Mobile valves configuration(Parallel circuit). Mobile valves configuration(Series circuit).
355 views • 22 slides

A Simple Anaylsis of Phenylpropanoid Pathway From the point of view of structure
A Simple Anaylsis of Phenylpropanoid Pathway From the point of view of structure. teammates: Liu Lanxuan Yin Jianmin. procedure. introduction of pathway and enzymes preparation of materials homology modelling protein-ligand docking protein-protein docking
376 views • 37 slides
Skip to content
Learning to Read: “The Simple View of Reading”

The Simple View of Reading
Learning to read consists of developing skills in two critical areas: (1) Reading each word in texts accurately and fluently and (2) Comprehending the meaning of texts being read. This is known as the Simple View of Reading.
To read words accurately and fluently, students need strategies to read words they have never seen before in print as well as words they have previously encountered. To understand the meaning of texts, students must have sufficient language comprehension skills. For example, if a text says, "the little dog barked at the big cat," a proficient reader must be able to read each word accurately and also know what the words mean in this specific sentence.
Learning these skills does not come naturally. Both accurate word reading and text comprehension require careful, systematic instruction . And, once formal reading instruction begins in school, instruction in both of these areas should occur on a daily basis.
Accurate, Fluent Reading
Reading words accurately is complex: it requires the integration of visual, auditory, and cognitive skills. For example, reading the word “cat” accurately in print requires the following:
- Seeing each letter (three different letters in “cat”— visual acuity );
- Producing the sound each letter makes (in “cat,” each letter makes a distinct sound— auditory perception );
- Putting the individual sounds together to pronounce the word (the three sounds are put together quickly to produce “cat”—a cognitive skill).
Fluency improves as students become familiar with seeing the same words in print over and over. They begin to recognize these words automatically and can pronounce them quickly and easily.
Reading words accurately with increased fluency helps set the stage for figuring out what the text means. Reading “dig” for “dog” or “baked” for “barked,” or not having any idea how to accurately read or decode these words hinders comprehension.
Comprehending the Meaning of Text
To understand the example sentence about “dogs and cats,” students must know what dogs and cats are. They must know what “bark” means and understand that “little” and “big” refer to size concepts.
Background knowledge also assists comprehension. Understanding will be improved if students know something about why a dog might bark at a cat (which the sentence does not say explicitly). Students might also sense the irony of a little dog barking at a big cat.
Reading involves a complex integration of skills. Proficient readers seem to make the process look effortless, but reading instruction for all students requires systematic instruction in both word reading and comprehension. For students in the early stages of reading, or for those who struggle, reading is particularly difficult and requires careful instruction and intervention . Problem areas must be determined, and instruction and intervention to address these areas must be carefully planned and delivered.
Infographic

Suggested Citation
Baker, S.K., Fien, F., Nelson, N. J., Petscher, Y., Sayko, S., & Turtura, J. (2017). Learning to read: “The simple view of reading”. Washington, DC: U.S. Department of Education, Office of Elementary and Secondary Education, Office of Special Education Programs, National Center on Improving Literacy. Retrieved from http://improvingliteracy.org
Adams, M.J. (1990). Beginning to read: Thinking and learning about print. Cambridge, MA: The MIT Press.
Gough, P.B. & Tunmer, W.E. (1986). Decoding, reading, and reading disability. Remedial and Special Education, 7 , 6-10.
National Reading Panel (U.S.), & National Institute of Child Health and Human Development (U.S.). (2000). Report of the National Reading Panel: Teaching children to read : an evidence-based assessment of the scientific research literature on reading and its implications for reading instruction: reports of the subgroups . Washington, D.C.: National Institute of Child Health and Human Development, National Institutes of Health.
Snow, C.E., Burns, M.S., & Griffin, P. (eds.) (1998). Preventing reading difficulties in young children. Washington, DC: National Academy Press.
Learning to read consists of developing skills in two areas: accurate, fluent reading and comprehending the meaning of texts. Learning these skills does not come naturally. Both accurate word reading and text comprehension require careful, systematic instruction.
Related Resources
Blending and segmenting games.
Read descriptions of specific activities that involve blending and segmenting sounds; includes activities for whole-class, small-group, and individual instructional contexts.
Topic: Phonemic Awareness
Reading 101: A Guide to Teaching Reading and Writing
Start the Reading Rockets online professional development module for phonological and phonemic awareness .
Speech Sounds: Suggested Activities
Learn how to deliver activities that focus on how speech sounds work; ; download related activities; and find supporting materials.
More on Beginning Reading
- A Common Family Factor Underlying Language Difficulties and Internalizing Problems: Findings From a Population-Based Sibling Study
- Coaching Steps for Families
- Comparison of Reading Growth Among Students With Severe Reading Deficits Who Received Intervention to Typically Achieving Students and Students Receiving Special Education
- Fluency with Text
- Four Steps to Building Fluency with Text
The research reported here is funded by awards to the National Center on Improving Literacy from the Office of Elementary and Secondary Education, in partnership with the Office of Special Education Programs (Award #: S283D160003). The opinions expressed are those of the authors and do not represent views of OESE, OSEP, or the U.S. Department of Education. Copyright © 2024 National Center on Improving Literacy. https://improvingliteracy.org
Academia.edu no longer supports Internet Explorer.
To browse Academia.edu and the wider internet faster and more securely, please take a few seconds to upgrade your browser .
Enter the email address you signed up with and we'll email you a reset link.
- We're Hiring!
- Help Center

Simple View of Reading

PPT from a class discussion.
Related Papers
David Farkas
Research Gate
DR.C.KARTHIKEYAN DR.C.KARTHIKEYAN
PowerPoint Presentation and Rubric for students and faculty members
Language Value
Larissa D'Angelo
Since the late 1990s, Microsoft PowerPoint has become the expected presentation genre. However, several studies have demonstrated its many faults, such as the pre-formatted construction of discourse leading to the abuse of bullet point presentations, the limited format and size of slides that support minimum content and the ever-present risk of overwhelming viewers with too much text or data (Alley 2003, 2004, Robertshaw 2004, Gottlieb 1985, Keller 2003, Tufte 2003). Taking into consideration how the linguistic and visual elements, as well as the design and text organizations found in PowerPoint presentations have evolved in the last 20 years, the present paper analyses the negative effects that the default slide structure provided by Microsoft PPT, consisting of topic-subtopics and bullet points, has on the audience. The paper will then demonstrate the positive learning effects that the assertion evidence structure has on readers. The different retaining degree of three groups of undergraduate students are tested, after having exposed them to PPTs applying phrase headlines, phrase headlines and images or the assertion evidence structure.
Language and Language Teaching Journal
Widi Hadiyanti
Jonalou S Labor
PowerPoint presentations (PPT) are measures of the technological capacity of the teacher inside the classroom. Students even expect their teachers to be knowledgeable of the design and delivery of the said tool in order to better teach the students. However, there is a dearth of qualitative data to either support or disprove this belief. This study thus aims to describe the experiences of a select group of college students as they describe and discuss the pluses, minuses, and interests (PMI) of PowerPoint use of their teachers inside the classroom. Thirty out of ninety selected college students who have been exposed to and taught in their classes using PPT were the participants in this qualitative inquiry. Initially, the students were made to fill out forms for purposes of profiling their baseline characteristics. The students were divided into small groups and were asked to discuss both the positive and negative details of PPT use inside the classroom on two separate group discussion instances. On the third group discussion, the students were asked to discuss the suggestions that they could offer their teachers about PPT design and delivery. Data gathered were carefully analyzed via a repertory grid, thematized via a dendrogram, and a member-checking procedure during data explicitation. The study revealed a " see saw " model typifying the experiences of the respondents relative to the three variables. The respondents' PowerPoint experience surfaced three themes: Functions, Dysfunctions, and Accretions. Functions were facilitative and generative. Dysfunctions were divided into two faces: technical or human. Accretion challenge were either technical or about its continuity. On the whole, students who experienced being lectured with PPT feel that there are ups and downs in the constant use of the tool inside the classroom.
Alexander Maxwell
Alan Apperley
PowerPoint began as a business package which allowed for the seductive presentation of information to achieve particular objectives, usually to sell a product. Many of the features were thus designed to impress prospective customers and persuade them to purchase a particular product, and guidance in manuals seeks to serve that purpose. This project grew out of a school staff development session where staff shared perceptions of PowerPoint and raised questions and concerns about pedagogy. Essentially the crucial question is how can a product designed for a different purpose assist us in the presentation of information in a teaching and learning situation?
ELT Journal
Jason Anderson
This article charts the chequered history of the PPP model (Presentation, Practice, Production) in English language teaching, told partly through reference to articles in ELT Journal. As well as documenting its origins at the dawn of communicative language teaching (and not in audiolingual approaches, as some have suggested), I chart its history through the 1980s, discuss key criticisms directed at it in the 1990s, and also document its close relationship with ELT coursebook syllabi ever since its emergence. Recent evidence from second language acquisition research in support of explicit, practice-oriented instruction such as PPP is also discussed, along with other recent references to the model, suggesting not only that it can no longer be rejected as incompatible with research evidence, but that it may be enjoying a revival in its fortunes.
Social media: articles by Cliff Atkinson
Cliff Atkinson
Journal of Education for Business
Mohammad Mehdi Ahmadi
Loading Preview
Sorry, preview is currently unavailable. You can download the paper by clicking the button above.
RELATED PAPERS
Deirdre Burke
Information Design Journal
Journal of Surgical Education
Margaret Tarpley
International Journal of Knowledge Society Research
Maira Kotsovoulou
iliasu ibrahim
Communication Education
Mark Stoner
Business Communication Quarterly
Debbie Dufrene
Archana Somashekar
Hossein Nouri
Arik Legacygeneration
Proceedings of the 2019 InSITE Conference
Gena Bardwell
Dr. J. Jaya Parveen Rajesh
Hue University Journal of Science: Social Sciences and Humanities
sociable media
jagannath Dange
Teaching of Psychology
Marianne Fallon
The CU Online Handbook
Patrick Lowenthal
JALT Journal
Roehl Sybing , Rintaro Sato
Michelle Kelley
Teaching Sociology
Tammi Arford
Ali (Arash) Farhadipour
Joanna Dunlap
Alfred Valdez
Innovative Higher Education
Russell Craig
- We're Hiring!
- Help Center
- Find new research papers in:
- Health Sciences
- Earth Sciences
- Cognitive Science
- Mathematics
- Computer Science
- Academia ©2024

Science of Teaching Reading Resource Guide
- Essential Components of Early Reading Success
- Defining Vocabulary Tiers
- Vocabulary Instructional Methods
- Knowledge and Practice Standards for Teachers of Reading
- The Five Language Domains
- The Reading Brain
- The Four-Part Processing Model for Word Recognition
- What are Print Concepts?
- Scarborough's Rope
The Simple View of Reading
- Reading Profiles
- Structured Literacy
- Consonant Phonemes
- Vowel Phonemes
- Six Layers of Phonemic Awareness
- Phonemes and Graphemes
- Principles for Teaching Multisyllabic Words
- Related Resource Handouts
- Additional Resources
According to Farrell, Davidson, Hunter, and Osenga (2020), the Simple View of Reading is based on the widely accepted view that reading has two key components: word recognition (decoding) and comprehension. The Simple View formula, presented by Gough and Tunmer in 1986, is:

Decoding (D) x Language Comprehension (LC) = Reading Comprehension (RC)
Language comprehension (LC) has been referred to as: linguistic comprehension, listening comprehension, and comprehension. All of these terms describe the ability to derive meaning from spoken words when they are part of sentences or discourse.
Reading comprehension (RC) focuses on print, as opposed to oral language, in order to derive meaning words (Hoover & Gough, 1990). In other words, language comprehension becomes reading comprehension when word meaning is derived from print. It is possible to have strong language comprehension and still be a poor reader if there is difficulty with decoding.
Reference: Farrell, L., Davidson, M., Hunter, M., and Osenga, T. (2020, January). “The Simple View of Reading.” The Center for Development and Learning: www.cdl.org/the-simple-view-of-reading/
- << Previous: Scarborough's Rope
- Next: Reading Profiles >>
- Last Updated: Jul 26, 2023 3:42 PM
- URL: https://relay.libguides.com/science-of-teaching-reading-resource-guide
- Skip to main content
- Skip to primary sidebar
- Skip to footer
The Center for Literacy & Learning
Customized Professional Learning Services for Schools, School Districts and Individual Teachers
The Simple View Of Reading
February 1, 2010 by Linda Farrell, Marcia Davidson, Michael Hunter and Tina Osenga 4 Comments
Research of Importance to All Educators
By Linda Farrell, Marcia Davidson, Michael Hunter and Tina Osenga
In spite of its importance in the world of reading research, many practicing educators do not know about the Simple View of Reading. It is a formula based on the widely accepted view that reading has two basic components: word recognition (decoding) and comprehension. The Simple View formula has been supported and validated by a number of research studies. Understanding the formula can help educators with assessing reading weaknesses and providing appropriate instruction.
The Simple View formula presented by Gough and Tunmer in 1986 is:
Decoding (D) x Language Comprehension (LC) = Reading Comprehension (RC)
The Simple View formula and supporting studies show that a student’s reading comprehension (RC) score can be predicted if decoding (D) skills and language comprehension (LC) abilities are known. Notice that D and LC are not added together to predict RC. They are multiplied. In the Simple View formula, the values of D and LC must be between 0 and 1 (or 0% and 100%). A score of 0 means no skill or ability at all and 1 indicates perfection. (Examples of how the formula works are presented later in this article.)
Gough and Tunmer (1986) proposed the Simple View of Reading to clarify the role of decoding in reading. Many educators believe that strong decoding skills are not necessary to achieve reading comprehension. Beginning and struggling readers are often taught to compensate for weak decoding by guessing an unfamiliar word based on the first letter or the picture, then asking themselves if the word makes sense after reading the sentence. In contrast, when decoding is the focus of instruction, students are taught to sound out unfamiliar words using all the letters.
This article discusses the following so that educators can take advantage of the Simple View of Reading to help all students achieve their maximum reading potential.
1. The Simple View formula makes clear that strong reading comprehension cannot occur unless both decoding skills and language comprehension abilities are strong.
- We must teach students to decode expertly as early as possible. When students can decode expertly, their reading comprehension capabilities equal their language comprehension abilities.
- We must provide students with strong content knowledge in many domains at all grade levels in order for them to develop adequate language comprehension abilities.
2. Intervention for struggling readers is effective only when it addresses the student’s specific weakness, which may be decoding, language comprehension, or both.
- Intervention instruction focused on developing content knowledge or comprehension strategies will benefit struggling readers only they have a weakness in language comprehension.
- Struggling readers of all ages can have decoding weaknesses; explicit instruction in decoding will be necessary to improve their reading comprehension.
3. Decoding and language comprehension skills are separable for both assessment and teaching, although both are required to achieve reading comprehension.
- Scores from reading comprehension (RC) assessments are not enough data to identify students’ areas of weakness (D or LC) with certainty.
- Assessment for students of all ages must supply enough information to specifically identify decoding skills and language comprehension abilities.
4. The Simple View of Reading is a mathematical formula with three variables. If we have two variables, the third can be estimated using the formula.
5. The Simple View of Reading is supported by scientific research.
Definitions
For purposes of the Simple View of Reading, skilled decoding (D) is defined as “efficient word recognition” (Hoover & Gough, 1990). This definition goes beyond the traditional definition of decoding as the ability to sound out words based on phonics rules. The meaning of decoding expands to include fast and accurate reading of familiar and unfamiliar words in both lists and connected text (Gough & Tunmer, 1986).
Language comprehension (LC) is called by several other names in various studies, including linguistic comprehension, listening comprehension, and comprehension. All of these terms are defined as the ability to derive meaning from spoken words when they are part of sentences or other discourse. Language comprehension abilities, at a minimum, encompass “receptive vocabulary, grammatical understanding, and discourse comprehension” (Catts, Adlof, & Weismer, 2006).
Reading comprehension (RC) differs from language comprehension because of the reliance on print, as opposed to oral language, to perceive the words and derive meaning (Hoover & Gough, 1990). In other words, language comprehension becomes reading comprehension when word meaning is derived from print. It is possible to have strong language comprehension and still be a poor reader if there is difficulty with decoding.
Kamhi (2007) eloquently describes the differences between decoding (word recognition) and comprehension. Decoding is “a teachable skill” compared to comprehension, which “is not a skill and is not easily taught.” Kamhi explains that word recognition is a teachable skill because it “involves a narrow scope of knowledge (e.g. letters, sounds, words) and processes (decoding) that, once acquired, will lead to fast, accurate word recognition.”
Kamhi further writes that comprehension “is not a skill. It is a complex of higher-level mental processes that include thinking, reasoning, imagining, and interpreting.” The processes involved in comprehension are dependent on having specific knowledge in a content area. This makes comprehension largely knowledge-based, not skills based.
Important Findings from the Simple View of Reading
Three important findings from research supporting the Simple View of Reading have major implications for providing reading instruction and assessment.
1. Reading comprehension results from skills and knowledge that can be broken into two distinct and identifiable categories: decoding (D) and language comprehension (LC). Although reading is complex, the Simple View of Reading shows that the complexities can be assigned to one of the two categories. A deficit in decoding is related to the student’s ability to read printed words accurately and rapidly. Any deficit in language comprehension is not specific to reading, but related to a knowledge domain or to higher order thinking skills such as reasoning, imagining or interpreting.
2. All reading difficulties fall into one of three general types. The Simple View demonstrates that reading difficulties fall into three basic types:
- Poor at Language Comprehension – Has adequate decoding skills and weak language comprehension skills. The extreme example of this profile is a hyperlexic student (a student with severe language comprehension issues and excellent decoding skills).
- Poor at Decoding – Has adequate language comprehension and weak decoding skills. The extreme example of this profile is a dyslexic student (a student with language comprehension abilities that are at least average and severe decoding difficulties that do not respond to research-based decoding intervention).
- Weaknesses in Both Areas – Has weaknesses in both areas; sometimes referred to as the “Garden Variety” poor reader.
3. Both decoding (D) skills and language comprehension (LC) abilities are necessary for reading, and both must be strong. Strength in one area (D or LC) cannot compensate for a deficit in the other area.
- A student with excellent decoding skills will achieve reading comprehension equal to his language comprehension skills in the subject area being tested. The Simple View shows that for a student with D equal to 1.0, the RC score will be equal to the LC score. For instance, a student with a D score of 100% and an LC score of 50% will have an RC score of 50%, as shown below.
RC = D x LC
.50 = 1.0 x .50
Any improvement in this student’s language comprehension skills will result in an equal improvement in reading comprehension. Improving the LC score to 70% will result in a concurrent increase in RC to 70%.
.70 = 1.0 x .70
When decoding (D) skills are strong, the only limitation to high reading comprehension (RC) is the student’s language comprehension (LC) abilities with regard to the material being read.
- A student with strong language comprehension abilities in the subject area being tested will achieve reading comprehension equal to his decoding skills. For instance, a student with an LC score of 100% and D of 30% will have an RC score equal to 30%, as shown below.
.30 = .30 x 1.0
Any improvement in this student’s decoding abilities will result in an equal improvement in reading comprehension. Improving the D score to 75% will result in a concurrent increase in RC to 75%.
RC = D x LC .75 = .75 x 1.0
When language comprehension (LC) abilities with regard to the subject area of reading are strong, the only limitation to high reading comprehension (RC) is the student’s decoding (D) skills.
- A weakness in one area will be exacerbated by a weakness in the other area. For instance, a student with scores of 75% for both D and LC will have an RC score of 56%, as shown below.
.56 = .75 x .75
Because of the multiplier effect in the Simple View formula, the RC score is significantly lower than either of the component scores. Both D and LC scores will need to improve for this student to achieve high reading comprehension scores.
If the D score improves to 100%, the student’s RC improves only to 75% as shown below:
.75 = 1.00 x .75
Intervention in both D and LC is necessary in order for this student to achieve maximum RC scores.
Practical Application of the Simple View of Reading
The Simple View is an algebraic equation with three variables. Any variable in the equation can be estimated if the other two variables are known. That means that if any two of the three variables (RC, D, LC) are known, the third variable can reasonably be estimated. The equations to estimate each variable are:
RC = D x LC (The Simple View formula)
D = RC ÷ LC
LC = RC ÷ D
Measures of a student’s reading comprehension (RC) abilities are commonly available from high stakes tests or other measures. Therefore, if scores for either decoding (D) or language comprehension (LC) are available, the third variable can be estimated using the Simple View formula. The practical aspect of this is that we need assess only two of the variables, not all three, which saves time spent on assessment.
Using the Simple View of Reading to Analyze Different Responses to Intervention
This section analyzes three 5th grade students. The profiles are composites of actual 5th graders with reading difficulties.
All three students had same RC score at the beginning of the year, which was considerably below the grade level benchmark. In terms of the Simple View formula, these students can be considered to have a low RC score of 20%.
The three students were placed in the same intervention group that focused on improving content knowledge and teaching comprehension strategies. The goal was for students to achieve an RC score of 50% or higher.
Description of Varying Responses to Intervention
After four months of intervention, the three students in the intervention class had different improvement in RC scores. The intervention was successful for one student who exceeded benchmark after intervention. One student almost reached the goal of 50% for an RC score. One student had almost no improvement in comprehension.
Table 1 shows a description of the improvement in RC scores fro each, the increase in RC score, and RC scores before and after intervention for each student.
Pre- and Post- Intervention Reading Comprehension (RC) Scores
| Strong | 50% | 20% | 70% | |
| Minimal | 5% | 20% | 25% | |
| Moderate | 20% | 20% | 40% |
Using the Simple View to Explain Different Responses to Intervention
The Simple View of Reading can explain why the students responded so differently to the same instruction. After intervention, each student’s decoding skills were assessed. We can reasonably assume that their decoding skills were essentially the same prior to intervention because they did not receive instruction in word attack. Table 2 shows the student’s decoding (D) scores.
Decoding (D) Scores
| 80% | |
| 25% | |
| 40% |
Using pre-intervention RC scores and D scores, the Simple View formula will estimate the student’s LC score prior to intervention. With both the D and LC scores, each student can be placed in one of the three types of reading difficulties defined by the Simple View of Reading (see previous section). This placement is based on pre-intervention RC scores.
Table 3 shows the estimated Pre-Intervention LC score for each student, along with actual RC and D scores. Table 3 places each student places into one of the three types of reading difficulties defined by the Simple View of Reading.
Description of Students’ Reading Difficulties Based on the Simple View of Reading
| Poor Language Comprehension | 80% | 25% | |
| Poor Decoder | 25% | 80% | |
| Weaknesses in Both D and C | 40% | 50% |
Explaining Different Responses to Intervention based on RC, D, and Estimated LC Scores
Each of the three students had the same low reading comprehension (RC) score, but responded very differently to intervention. The discussion below views each student’s response to intervention based on the Simple View of Reading.
Student A, Poor at Language Comprehension Student A had the greatest improvement in reading comprehension after the intervention (Table 1). Student A’s post-intervention RC score exceeded the goal of 50%. He has strong decoding skills (Tables 2 and 3).The primary cause of his low reading comprehension was a significant deficit in language comprehension (LC), as evidenced by his low estimated LC score of 25%.Therefore, the intervention targeted Student A’s weakness, and it was successful.
If the original assessment process had provided both RC and D scores, we could have predicted the success of the comprehension instruction. We can use the Simple View formula to estimate Student A’s LC score after intervention.
.875 = .70 ÷ .80
Student A’s LC score improved from 25% to 87.5% after intervention. This student received the instruction that targeted his weakness, and he experienced dramatic improvement to his RC, score from 20% to 70%.
Student B, Poor Decoder The Simple View makes it very clear that the primary cause of Student B’s low reading comprehension (RC) score was very weak decoding (D) skills, with a score of 25%. His language comprehension abilities, at 80%, were quite strong. It follows that his RC scores increased only minimally (Table 1) after intervention aimed at improving language comprehension (LC).
If the original assessment process had provided both RC and D scores, we would have predicted that improving Student B’s language comprehension would not translate to a material improvement in reading comprehension. Indeed, Student B’s RC score increased only minimally from 20% to 25%.
We’ll use the Simple View formula to estimate Student B’s LC score after intervention.
1.0 = .25 ÷ .25
The formula shows that Student B’s LC score improved from 80% to 100%. Improving LC to a perfect score resulted in only a minimal improvement to RC from 20% to 25%.
Suppose the instruction had targeted decoding and the student’s D score had increased by 20%, from 25% to 45%. This results in increasing RC to 36% (holding LC at the original level).
.36 = .45 ÷ .80
A 20% increase in D results in an RC score of 36%.This contrasts with a 20% increase in LC, which yields an RC score of only 25%, demonstrating that the student gets a “bigger bang for the buck” to RC by teaching to the area of weakness.
Student C, Weaknesses in Both Areas Student C has moderate deficits in both decoding and language comprehension. Therefore, the comprehension-focused intervention improved one of his weaknesses, which is reflected in the moderate improvement in his RC score (Table 1). However, Student C still needs to improve his decoding skills before he will realize significant improvements in RC, such as those seen for Student A.
Student C’s RC score of 20% is significantly lower than either his D or LC scores because of the multiplier effect of the Simple View formula. This student needs to improve both D and LC to experience significant improvement in RC. The comprehension-focused intervention did improve his LC skills. Using his post-intervention RC score and his D score, the Simple View formula shows that after intervention Student C’s LC scores increased to 100%.
1.0 = .40 ÷ .40
Student C’s RC will improve even further by raising his D score with instruction focused explicitly on decoding.
It is clear from this analysis that intervention needs to target the student’s weakness, whether it is D or LC. It is also clear that assessment needs to specifically identify the student’s weak area or areas. Teaching to the student’s strength will not raise reading comprehension scores meaningfully, no matter how intensive the instruction is. Students with weaknesses in both decoding and language comprehension must have instruction in both areas in order to maximally improve reading comprehension.
Using only RC scores to assign the students to an intervention is a hit or miss approach. Diagnosis of either D or LC is needed to identify the area of reading weakness and to identify instruction that will be most beneficial. With scores for RC and either D or LC, the unknown score can be reasonably estimated based on the Simple View formula.
Too often it is assumed that older students with low reading comprehension (RC) scores have general comprehension (LC) difficulties, and decoding (D) weaknesses are not considered or assessed. Research supporting the Simple View of Reading shows that decoding weaknesses are a problem even for older students. Both younger and older students with low reading comprehension scores need additional assessment of decoding or language comprehension. Informal assessments of decoding skills are readily available and easy to give, unlike assessments of language comprehension. Therefore, it is generally easier to give decoding assessments and estimate language comprehension than the other way around.
Research Supporting the Simple View Formula
A number of studies support the Simple View of Reading. Aouad and Savage (2009) briefly describe some of the studies that show how variability in decoding and language comprehension is strongly correlated with variability in reading comprehension (p. 184).Two studies are summarized below because they directly validate the Simple View of Reading and its importance to instruction and assessment.
The Simple View of Reading (1990)
Hoover and Gough (1990) first showed the validity of the Simple View of Reading formula. Their study involved more than 250 students. They used multiple assessments to measure students’ development in cognition, language, and reading. Students were assessed annually from 1978– 1985. They were followed from either the beginning of kindergarten or the beginning of first grade through second, third, or fourth grades. (Some attrition of students occurred during the study.)
Decoding (D) was measured by having students read nonsense words (ranging from words such as hin and pame in the lowest list to rhosmic and conspartable in the highest list). To measure language comprehension (LC), students listened to a story, retold the story, and answered questions about it. Reading comprehension (RC) was measured with materials and questions parallel to those used for LC except that students read the story, as opposed to hearing it, before answering questions.
The correlation between the actual RC score and the RC score predicted by multiplying D x LC was higher than 0.8 for each of grades K–4. What exactly does this mean? For studies of this type, a 0.3 correlation is weak and a 0.7 correlation is strong. The correlations of 0.8 and higher are strong validations of the Simple View of Reading.
Language Deficits in Poor Comprehenders: A Case for the Simple View of Reading (2006)
A more recent study that supports the Simple View of Reading was conducted with 8th graders (Catts, Adlof, & Weismer, 2006). Three groups of students were studied: (1) poor comprehenders (57 students with poor reading comprehension and normal word recognition); (2) poor decoders (27 students with poor word recognition and normal reading comprehension; and (3) typical readers (98 students with normal word recognition and reading comprehension).
This study shows that the Simple View of Reading provides an effective classification system to aid intervention for poor readers. The Simple View formula predicts that students who have poor reading comprehension and strong decoding skills will have poor general language skills. As predicted, the students with poor comprehension and normal word recognition uniformly had lower language abilities than the other two groups. They had identifiable deficits in language comprehension and normal abilities in phonological processing. Poor decoders with normal reading comprehension had an almost opposite profile. They generally scored well on tests of oral language comprehension but poorly on tests of phonological processing. (Interestingly, this study also supports the view that poor decoding is correlated with a phonological deficit.)
The Simple View of Reading shows that reading comprehension abilities are dependent on decoding skills and language comprehension abilities. These categories can be taught and assessed separately.
The Simple View of Reading provides clear guidance for necessary assessment of students with reading comprehension scores below grade level expectations. We need more data than just an RC score. We must also have data to understand the student’s decoding skills and language comprehension abilities in order to determine effective and efficient reading intervention.
The Simple View of Reading also is clear about the components of effective reading instruction. At every grade level we must insure that students have sufficient content knowledge and higher order thinking skills to understand what they read. We must provide early reading instruction that insures students become strong decoders because once decoding is strong, the only limit to reading comprehension is the student’s knowledge of the subject he is reading about and his ability to synthesize the information.
Aouad, J. and Savage, R. (2009). The component structure of preliteracy skills: Further evidence for the simple view of reading. Canadian Journal of School Psychology, 24 (2), 183–200.
Catts, H., Adlof, S., and Weismer, S. (2006). Language deficits in poor comprehenders: A case for the simple view of reading. Journal of Speech, Language, and Hearing Research, 49, 278–293.
Gough, P., Hoover, W., and Patterson, C. (1996). Some observations on a simple view of reading. In C. Cornoldi and J. Oakhill (eds.), Reading comprehension difficulties: Processes and intervention (pp. 1–13). Mahway, New Jersey: Lawrence Erlbaum Associates.
Gough, P. and Tunmer, W. (1986). Decoding, reading, and reading disability. Remedial and Special Education, 7 , 6–10.
Hoover, W. and Gough, P. (1990). The simple view of reading. Reading and Writing: An Interdisciplinary Journal, 2, 127–160.
Kamhi, A. (2007). Knowledge deficits: the true crisis in education. ASHA Leader, 12 (7), 28–29. Linda Farrell, Michael Hunter, and Tina Osenga are founding partners of Readsters, LLC.
Marcia Davidson is a professor of special education at the University of Utah.
Reader Interactions

October 4, 2016 at 7:37 pm
Do you have an assessment to give children that will determine which areas are the problem areas? I am an Title I teacher looking for an assessment to determine a deficit with the Language comprehension area. I want to pin point an area instead of trial and error.
Thank you, Anndrea Eubanks

June 8, 2020 at 2:34 pm
Do you know any free resources that teachers can use as a pre-test in the beginning of the year?

August 17, 2020 at 9:57 am
Hi Elise! Please email our Literacy Specialist, Alana Mangham, at [email protected] . She can share some resources with you.
[…] Reading for meaning of course involves more than just reading words, and scientific evidence on reading comprehension has consistently supported the Simple View of Reading: […]
Leave a Reply Cancel reply
Your email address will not be published. Required fields are marked *
Save my name, email, and website in this browser for the next time I comment.
Sign Up for our Newsletter
Follow our progress.
- Employee Portal

- Apr 20, 2023
A Simple Model with a Major Impact: The Simple View of Reading
Over the years, several influential models of reading have significantly shaped the reading research landscape. The Simple View of Reading (SVR), first proposed by Gough and Tunmer in 1986, is one such model. In today’s post, we’ll provide an overview of this model and discuss some implications.

THE SIMPLE VIEW OF READING: AN OVERVIEW
The SVR functions as a formula consisting of three variables: decoding, language comprehension, and reading comprehension. As seen below, the SVR states that reading comprehension is the product of decoding and language comprehension. Since its introduction, hundreds of other studies have used the SVR to demonstrate how decoding skill and language comprehension together can predict reading comprehension.

The decoding piece of the SVR involves word-reading. Decoding refers to the ability to see a string of letters (c-a-t), to connect the letters (or graphemes) to the speech sounds they represent (/k/ /a/ /t/), and to blend these sounds together (“cat”). Students who struggle with decoding may have not yet mastered phoneme-grapheme correspondences and lack fluency and automaticity when reading. Individuals with dyslexia can fall into this category, displaying difficulty with decoding, but often demonstrating strong language comprehension.
LANGUAGE COMPREHENSION
Language comprehension is the ability to make meaning of spoken words, phrases, and sentences. Language comprehension can be impacted by a number of factors including a student’s:
Background/world knowledge
Understanding of syntax, semantics, and other language systems
While language comprehension is often equated to what students can understand when words are spoken aloud, it is important to note the subtle differences between spoken and written language. Written language often incorporates more complex language structures than everyday, conversational language, which tends to be more simplified. These more complex elements embedded throughout written language may serve as a barrier to comprehension and often require explicit instruction.
Fluency in a language is yet another factor to consider. Individuals who are not native English speakers may have strong decoding skills but experience difficulty deriving meaning from the words they have decoded.
READING COMPREHENSION
Reading comprehension is the ultimate goal of reading. Educators often reference the shift that occurs when a student moves from “learning to read” to “reading to learn.” When a student can decode the text in front of them and truly understand what that text means, they have unlocked the potential to learn about anything that interests them. The SVR asserts that reading comprehension occurs when a student has both decoding and language comprehension skills.
THE SIMPLE VIEW OF READING & READING DIFFICULTIES
The SVR also provides a general model for categorizing reading difficulties. Students with dyslexia often have strong language comprehension skills but difficulty decoding words. Students with hyperlexia often have strong decoding skills but difficulty with language comprehension. Some students struggle in both areas. While the diagnosis of reading difficulties is far more complex, having a general understanding of the three variables within the SVR serves as a starting point.
THE SIMPLE VIEW OF READING AS AN INSTRUCTIONAL TOOL
If you think about this model as a math equation, when either component (decoding or language comprehension) is zero, then the product (reading comprehension) is zero as well. (1x0=0).
If a student has strong language comprehension skills but is unable to decode words, they will be unable to comprehend a text. If a student has strong decoding skills but cannot comprehend the words they have decoded, they too will be unable to comprehend a text. In short, both skills are necessary to achieve the ultimate goal of reading comprehension.
We can use this model as an instructional tool after initially noticing a student has a reading comprehension deficit. Through observation and assessment, educators can first determine if a student is struggling with decoding or an aspect of language comprehension. From there, an intervention plan can be developed.
Of course, both decoding and language comprehension can be broken down further, and a deeper analysis is necessary when selecting the specific supports a student needs. In this video linked here , Linda Farrell provides a real-world example involving a class of nine students with varying instructional needs. While seven students needed decoding interventions, two students needed language comprehension support. However, as outlined above, students can struggle with language comprehension for different reasons. The two students referenced in the video required uniquely distinct language comprehension supports. Farrell’s explanation regarding uncovering these differences is worth a listen!
IN CONCLUSION...
The SVR is one of the most well-documented, well-researched models of reading. It provides a framework for us to understand that both decoding and language comprehension are necessary in order for reading comprehension to occur.
If you wish to learn more specifically about other factors and processes involved in reading (e.g., phonological awareness, reading fluency, etc.), be sure to sign up for our email list here . You’ll never miss another post from us and can read along as we explore additional models of reading instruction!
Written by: Taryn Quaytman & Rachel Draper
Copyright © 2023 SparkEd LLC
Farrell, L., Hunter, M., Davidson, M., & Osenga, T. (n.d.) The simple view of reading. Reading
rockets. https://www.readingrockets.org/article/simple-view-reading
Gough, P. B., & Tunmer, W. E. (1986). Decoding, reading, and reading disability. Remedial
and Special Education, 7 , 6-10 . http://dx.doi.org/10.1177/074193258600700104
Moats, L.C. (2020). Speech to print: Language essentials for teachers (3rd ed.). Paul H.
Brookes Publishing Co.
- Reading Models

Science of Reading

Literacy Small Groups

Phonological Awareness

What is the Simple View of Reading?

The simple view of reading has been a big part of the science of reading that is sweeping across educational circles. But what is it exactly, and how can we use it to inform our instruction? It’s no secret that reading problems in students have grown exponentially in recent years. Learning to read is a huge part of any primary student’s journey. Eventually, students need to be able to translate print into meaning.
Read on or click play to learn more about how the simple view of reading plays into this!
We want our students to be able to comprehend what they read, but there are a lot of things that need to happen before that will occur. A psychologist by the name of Philip Gough originally described this simple view of reading in the 1980s along with some of his friends. It started off as the Gough theoretical model and is now commonly referred to as the simple view of reading, which looks something like this.

The simple view of reading states that word reading multiplied by language comprehension = reading comprehension. This shows us that reading comprehension is the product of word recognition along with language comprehension.
So let’s break it down and take a look!
Word Recognition & Language Comprehension
Under word recognition, we have phonological awareness , decoding, and sight recognition of familiar words.

Under language comprehension, we have background knowledge, vocabulary, language structure, verbal reasoning, and literacy knowledge.

These are all skills that develop over time which lead to skilled reading. If any of those areas are weak, then it leads to a breakdown when it comes to reading comprehension. When this occurs, students will not be skilled readers.

As I’ve gone through training on the science of reading, I’ve had several a-ha moments! I want you to take a moment and think back to previous students you’ve had. Or even your current students. Especially the students who are struggling. Think about where their weakness lies….now, this is not to beat yourself up, but I’ve found that looking back helps me as I move forward to help the new students that I will come across! Reflection definitely makes me a better teacher.
I hope that this post has helped to explain what the simple view of reading is, and how it relates to the science of reading! Years later, another researcher came along and we ended up with Scarborough’s Reading Rope, which expanded the simple view of reading. You can read more about the reading rope here.

- Read more about: Literacy Small Groups , Science of Reading
You might also like...

How to Start Literacy Centers in the Primary Classroom
One of the hallmarks of my teaching approach is my dedication to classroom centers and small group activities. These structured environments are important in promoting

Understanding Scarborough’s Reading Rope
Learning to read is a puzzle with many pieces. When it comes to the science of reading, Scarborough’s Reading Rope acts as a map, helping

How to Build Concepts of Print in Primary Grades
The journey to becoming a confident reader starts well before children can sound out their first word. Print awareness, the foundation of literacy development, lays
Join the Newsletter
Get teaching ideas, tips, resources, and freebies sent right to your inbox!
Meet the Author

Hey there! I’m Angela. I’m here to help you create positive learning experiences in your classroom by bringing you research-based strategies and resources.
Let's Connect
Member login.
© 2012-2024 The Daily Alphabet • Website by KristenDoyle.co
Privacy Policy • Disclosure
FREE CONCEPTS OF PRINT LESSONS

Learn how to create positive literacy experiences right from the start!
Reading Matters
Connecting Science and Education
Decoding “The Simple View of Reading”
This is one in a series of intermittent posts about issues that arise in trying to use research in cognitive science and neuroscience about reading, language, learning, development and related topics to improve literacy outcomes. This “post” is more like an article, with footnotes and references. I’m going to post it in three bite-sized pieces, plus supporting materials. Some light summer reading! It expands on issues I raised in my previous post, and in talks and articles over the past few years.
As a scientist who advocates using research to inform instruction, curricula, and teacher training, I think it is important to assess what is being done under the rubric “the science of reading.” The first hurdle, convincing a critical mass of people that reading education could be improved by utilizing basic research, seems to have been cleared. That’s important progress. The next challenge is to develop a research-based approach that is also effective, efficient, and equitable. Connecting research to practice is difficult, and the “science of reading” is a work in progress. If the first step was recognizing what is possible, the next step is doing it well enough to achieve the goal of increasing literacy, especially among people who are usually left behind. That is the focus of these posts.
The “science of reading” approach in education is being carried forward by influencers whose background in cognitive science is limited. I don’t think teachers either want or need the amount of detail I provide here. This level of analysis is highly relevant, however, for the people who are creating curricula, assessments, professional development courses, and policies.
My previous post ended with some concerns about the focus on a small number of classic studies in the “science of reading” (SoR) movement. These include the Simple View of Reading, the National Reading Panel report, the Reading Rope, and a few others. Some of the classic studies are useful for introducing basic concepts and findings to teachers and others who want to learn more. When I spoke to teacher groups about connecting research and instruction ten years ago, people would often say they were surprised to find out that this research even existed. Now many more teachers have heard about it, and in many places they are being required to learn more about it via PD courses.
Here is a conundrum for the SoR: What makes these classic studies good for onboarding teachers–their narrow focus on a few accessible concepts–is what makes them wholly inadequate as the basis for a science-based approach to reading instruction. The problem with these studies isn’t just that they are out of date, although they certainly are: research progress didn’t stop after the NRP report in 2000–in fact, it accelerated. Some of the later work was motivated by the limitations of these classic studies and led to theories and findings that superseded them. The further concern is that these studies simply do not speak to many of the most important issues, such as the impact of children’s experience of language and the world prior to school entry on learning to read, and the roles of different types of learning. This canon of studies is nonetheless being taken as the core science in the SoR and used to justify a variety of practices.
That is a mistake. If these are the findings and concepts you’re working with, you’ll have to make a lot of additional assumptions to link them to the classroom. Such assumptions could be based on other research, but currently they are being decided in an ad hoc way by the people, organizations, and companies that have stepped in to meet the demand for instructional materials and PD activities. New products and approaches are being assessed in terms of their consistency with the “science of reading,” but the studies taken as representing the science are consistent with many approaches to instruction, including ones that would be seen as ill-advised if other research were considered.
In the previous post I conjectured that this is happening because leaders of the SoR movement are themselves newcomers to reading research. Changes in teacher education, curricula, and practices are badly needed. Who is carrying the ball forward? Not the major schools of education. 1 Not the cognitive scientists who conduct research. Mainly, people with expertise in allied areas such as school psychology, teacher education, curriculum and instruction, or software development. That’s different from being a cognitive scientist who reads and contributes to the research literature, understands the methods and data analyses that are used, and can assess evidence and claims appropriately. Teachers aren’t that far behind the people teaching them about the SoR.
The current situation reflects a simple mismatch between supply and demand. The demand for courses and materials based on reading research is high. The supply of quality resources is low, in part because few cognitive scientists look at instructional issues.
We can do better, certainly. Capitalizing on the present opportunity to improve literacy outcomes by incorporating basic research demands that we do so. There is only a problem if we stop asking questions about what we are doing. Recognizing that current practices and materials are only interim solutions is preferable to institutionalizing what happened to be available when the “science of reading” caught fire. I will flesh out these points with a detailed example here. My goal is to make room for highly relevant later research that has yet to enter the discussion.
You may be wondering why I don’t just cut to the chase and tell people what they should do instead of merely analyzing what is going on. In later posts I will describe other strategies for developing research-based approaches to reading instruction, curricula, and teacher education. They won’t be definitive, of course, but they should be helpful. My own contributions aside, it’s important to recognize that translating research into practice is not easy and that developing new ways to teach reading based on cognitive research is a process. This process includes formulating and assessing approaches and materials, lather rinse repeat. That is how we successfully transitioned from Whole Language/Balanced Literacy to the present, and it is how we will progress further.
Journalists such as John McWhorter and Nicolas Kristoff of the New York Times have popularized the view that “we know how reading should be taught,” as though the only challenge is replacing one method with another. It would be more accurate to say we know what is important for learning to read (and what to avoid), and are currently figuring out how best to teach it. Looking critically at new approaches to classroom instruction, teacher education, and curricula is part of the process.
Finally, I view my primary role as teaching people about research, including what has been found and how to develop and assess implications for instruction. I am also trying to enable educators, publishers, and government officials to ask the kinds of questions I’m raising here.
Nobody Doesn’t Like ‘The Simple View of Reading’
Let’s start with the Simple View of Reading, because that’s where the “science of reading” usually starts. I’m reminded here of the discussion of reading to children in my book (p. 113). I didn’t want to ruin anyone’s memories of being read to by grandma or of reading to their children. Reading with young children is great but it’s not sufficient to insure they’ll learn to read, which almost always requires some amount of instruction. The Simple View of Reading is also great but not sufficient to decide important issues about how to teach reading.
I remember hearing about the SVR at a conference at the University of Texas-Austin organized by Phil Gough in 1986. (My talk was about a neural network model of dyslexia.) 2 The SVR was developed in a series of articles published in academic books and journals, starting with Gough & Tunmer (1986), and followed by several others. The SVR was an idea, an observation about learning to read, not a conclusion based on empirical research. I thought the idea was important and discussed the Simple View in my book (p. 118). The SVR says that reading is the product (in the arithmetic sense) of word recognition and language comprehension. Stated in words, the SVR holds that:
1. Reading comprehension can commence if children learn how the printed code represents words they already know from speech. They can then access everything they already know about such words: what they mean; how they combine with other words in sentences; images, actions, and sounds associated with them, and more.
2. Reading comprehension depends on both components being sufficiently developed. You can’t read without knowledge of print; you can’t understand print without knowledge of language.
These points seems obvious–once stated this way. Children do not re-learn language in order to read; rather, they learn how to access knowledge of language and the things we use language to talk about in a new way, from print. Knowledge of both print and language are necessary. 3
Beginning readers need to learn about print, but how? Gough and colleagues argued that it requires instruction. A child has to learn that there is such a thing as reading, that it involves a code that represents spoken language, and how the code works. Compared to learning a first, spoken language it is an “unnatural act,” another of Gough’s pithy expressions, but more about that one soon. 4
The SVR makes a compelling case for instruction to support reading words. It is very useful in debates with people who continue to believe that children will “pick it up” in a “literacy rich environment,” or that print instruction is only for poor readers. Once the basic point has been absorbed, focus can turn to how children acquire these types of knowledge, how instruction can promote progress, what kinds of obstacles can arise, how they can be addressed, and so on.
The SVR doesn’t have much to say about these issues, as the authors were careful to acknowledge. 5 The SVR is like a cake recipe that specifies the main ingredients but not the quantities or the procedures for combining them. It’s useful to have the ingredients spelled out this way; you just can’t bake the cake. Actually, the SVR is more like a cake recipe that specifies “wet ingredients” and “dry ingredients”, because the terms “word recognition” and “language comprehension” can signify many things. What kinds of information and mental computations are involved in each? How are they learned? How do they fit together? Why do learners differ in how they progress? The SVR doesn’t provide much guidance because these questions weren’t the focus of the work.
Teachers nonetheless want to know what SVR says about other instructional issues (I’m paraphrasing actual posts here):
“Print knowledge and language are separate components in the SVR. Does that mean they should be taught separately?”
“Decoding and language comprehension are different components in the SVR. Does that mean I should teach decoding using nonsense words, which don’t involve comprehension?”
“The simple view says that children already know how to comprehend spoken language and need instruction about print. That means they don’t need additional instruction about spoken language, right?”
Such questions are raised repeatedly on social media. Why?
People clearly don’t know that the SVR doesn’t address these issues, probably because they’ve learned about the work via secondary sources that emphasize its importance without mentioning its limitations. They may not be concerned because they’ve been led to believe that this concept, along with a few others, is the science relevant to instruction. Every curriculum or approach inspired by the SVR is therefore consistent with the “science of reading”. People also may have heard that the SVR has been confirmed in over 150 studies, which sounds like it covers a lot of ground. And the SVR does state a fundamental truth: people learn to read by learning how the written code represents spoken language they already know. All of these factors have magnified the expectation that the SVR should also have further implications for instruction. It doesn’t. Let’s look.
This is the first of three parts. Coming up: What’s in the components; are they independent; is the SVR sufficient; the 150 studies supporting the SVR; connecting the SVR to the Reading Rope; where else to look.
I am posting this in piecemeal fashion, but will compile the parts into a PDF along with complete references, footnotes, and acknowledgements. In the meantime, I have to point out that I am by no means the first person to have raised many of the issues discussed in these posts. This article by Hugh Catts and this post by Timothy Shanahan are particularly relevant.
1. Paradoxically, the demand for in-service training in the “science of reading” may allow schools of ed to forgo including this material in pre-service teacher education programs.
2. Seidenberg, M.S. (1991). Dyslexia in a computational model of word recognition in reading. My wife Maryellen MacDonald (whom I had yet to meet) was an undergraduate research assistant in Gough’s lab at the time.
3. Ideas very similar to the “simple view” are discussed by Jeanne Chall In her classic book “Learning to Read: The Great Debate”, who attributes them to Leonard Bloomfield, one of pivotal figures in modern linguistics. Chall wrote that Bloomfield “questioned the initial emphasis on ‘meaning’” in prevailing views of beginning reading and “called instead for making learning of the ‘code’ or the ‘alphabetic habit’ the first step. Since the child comes to school with a considerable command of spoken language, he reasoned, reading instruction should begin by teaching him [sic] the printed equivalents for his oral vocabulary. And since English spelling is irregular, he added, this is best accomplished by teaching those words that are spelled regularly.” (Chall, p. 24) Gough and Hillinger (1980) discussed this work.
4. Gough & Hillinger (1980), “Learning to read: An unnatural act.” Gough was fond of a clever phrase (and probably still is though I’ve had only occasional email contact with him since he retired around 25 years ago). He also referred to the printed code as a “cipher,” as in “breaking the cipher,” but that term is so archaic it didn’t catch on.
5. As Hoover has noted, ”The Simple View is neutral regarding how reading should be taught.” (Reading League Journal, 2021). The discussions of how reading works and children learn in the original SVR articles are thoughtful and nuanced (I only fault them for hijacking the term “decoding”). That nuance is not preserved in illustrations of the theory that circulate widely among educators.
Share this:
- Click to email a link to a friend (Opens in new window)
- Click to print (Opens in new window)
- Click to share on Twitter (Opens in new window)
- Click to share on Facebook (Opens in new window)
5 thoughts on “Decoding “The Simple View of Reading””
What are the titles of the articles you mentioned in paragraph right before the footnotes, the one by Cattas and the one by Shanahan? I would like to read them.
- Pingback: The Simple View of Reading: Getting Started with SoR - Tales from Outside the Classroom
Thank you for this clear explanation of the significant definition of what the SVR is and is not. It makes alot of sense to me and puts some of the ideas which I have been thinking about in order.
For those interesting in studying cognitive science, are there are online programs you’d recommend? I have a PhD in Education so a Masters or Cert would suffice. Is “cognitive science” the term I should be searching?
Thank you for this important series, a timely one for me. I’ve just finished reading Let’s Read: A Linguistic Approach by Barnhart and Barnhart, based on the original work of linguist Leonard Bloomfield, whom you mention in your footnotes. His linguistic approach runs completely counter to what I, as a reading specialist, have come to understand as best practices in reading instruction in order to secure encoding and decoding skills. So Chall’s ideas based on Bloomfield may indeed be similar to the SVR, but how they translate to practice is very different from what most of us do post-balanced literacy. Thanks again!
Leave a Reply Cancel reply
Discover more from reading matters.
Subscribe now to keep reading and get access to the full archive.
Type your email…
Continue reading
The Science of Reading: How to Understand and Apply the Basics
By andy minshew.
- September 27, 2023
Take a Deep Dive into the Science of Reading
Plus, find a variety of upcoming and on-demand video series led by early education experts through the Webinar Library , featuring topics chosen with administrators in mind, like:
- Impactful Family Engagement Made Easy
- Understanding the Six Instructional Strands for Literacy
- Improving Student Outcomes with Professional Services
Teaching students to read is so much more than sitting them down in front of a book. It takes an intentional mix of explicit classroom lessons, individualized support, and family engagement to help children develop strong reading skills. But, how do we know what strategies will work best? Have you ever stopped to think about what brain science says about how children learn to read—and how that might make your teaching even more effective?
Staying up-to-date on the research behind how children learn to read can help you make informed decisions about classroom instruction. Educational research offers valuable insights about the neuroscience of reading and how educators can teach literacy more effectively.
What is the Science of Reading?

The science of reading is not, she says, “a new idea, a passing fad, a preferred viewpoint, or a program.” Instead, the science of reading points to key learning principles and clear building blocks for literacy. These ideas can shape the way your teachers plan instruction.
Why the Science of Reading Matters
Most children naturally learn to talk through exposure to spoken language. However, the same is not true for learning to read. Julie Christensen, Ed.M, notes that, “by contrast, learning to read requires several years of intentional instruction.”[1]
How educators teach during a student’s early years of reading instruction matters for the child’s lifelong academic success. Your teachers can play a key role in giving students a strong start by staying current on literacy development research and using these findings to inform instruction.
How Do Children Learn to Read?
The brain’s reading network is formed in the left hemisphere. Specific areas of the brain process visual information and letter sounds. Other areas of the brain help us retrieve the meanings and pronunciations of words. In non-readers and developing readers, these areas of the brain are not yet connected. The process of learning to read literally changes the brain, forming neural pathways between the areas that must work together to make reading possible.
Two instructional frameworks are helpful in understanding the science of reading. The Simple View of Reading (below) states that proficient reading comprehension is the product of word recognition skills and language comprehension skills.

Scarborough’s Reading Rope (below) expands on the Simple View by outlining sub-areas within both word recognition and language comprehension.[2] Word recognition, for example, pinpoints phonological awareness, decoding and spelling, and sight recognition as important stepping stones. Language comprehension expands in the Reading Rope model to include background knowledge, vocabulary knowledge, language structures, verbal reasoning, and literacy knowledge. These skills are woven together to help a student read automatically and strategically.

A systematic and intentional curriculum for teaching reading will use instructional strands that align with the word recognition and language comprehension elements in the above reading frameworks. For example, Waterford’s curriculum is designed around the following strands:
- Phonological Awareness
- Reading Fluency
- Reading Comprehension and Vocabulary
- Language Concepts
- Communication
These strands are aligned with the Simple View of Reading and with the essential components of reading as identified by the National Reading Panel.[1] Together, they are the key puzzle pieces for literacy development.

Understanding the science of reading helps us see clearly how to foster skill development for students who are learning to read. Frameworks such as Scarborough’s Reading Rope, which illustrates how skills are woven together to produce reading proficiency, point to instructional approaches that align with the way the brain’s reading network operates.
How to Use the Science of Reading in the Classroom
Now that we’ve hit on a few key ideas around the value of the science of reading, let’s discuss how you and educators in your district can stay informed and use that knowledge in your curriculum. Waterford’s Foundations of the Science of Reading virtual summit begins October 18th. Register here to learn how the latest research can guide literacy strategies on a classroom, school, and district level.
Books on literacy development are an accessible way to learn more. Make sure that these books are recommended by experts in the field.
Waterford.org recommends the following books for in-depth study:
- Speech to Print: Language Essentials for Teachers by Louisa Moats
- Essentials of Assessing, Preventing, and Overcoming Reading Difficulties by David A. Kilpatrick
- Reading in the Brain by Stanislas Dehaene
Additionally, search for professional development opportunities on the science of reading (like Waterford’s Science of Reading virtual summit ) including presentations, self-paced courses, or podcasts. This can be a great way to learn the latest strategies from today’s educational researchers in a way that fits your schedule as a busy educator.
Finally, collaborate with other educators. Studying reading science by yourself can be overwhelming. Together, however, you can share what you’ve learned and brainstorm ways to put that knowledge to use. You can start a book club based on one of the recommended titles shared above. Or you can implement a school or classroom strategy together and discuss your progress at a follow-up meeting.
Read Waterford’s full Science of Reading article series and learn how to support your teachers with research-driven strategies as they plan for classroom instruction. Continue learning with the next three articles:
- How to Build Phonological Awareness Skills
- Phonics and Decoding for Elementary Students
- Understanding and Teaching Reading Fluency
1. Christensen, J., Persch, K., & Esser, L. “An Overview of the Science of Reading.”Video from Waterford.org. Nov. 2021.
2. Christensen, J. “The Science of Reading: From Research to Instruction.” Waterford.org, April 2022.
Further reading:
Gough, P., & Tunmer, W. (1986). “Decoding, reading, and reading disability.” Remedial and Special Education, 7, 6–10.
Scarborough, H. S. (2001). “Connecting early language and literacy to later reading (dis)abilities: Evidence, theory, and practice.” In S. Neuman & D. Dickinson (Eds.), Handbook for research in early literacy. New York: Guilford Press.
More education articles

Celebrating Juneteenth 2024: Children’s Books and Activities for Families and Educators
Happy Juneteenth! This American holiday is celebrated annually on June 19th and marks a significant historical moment in Black American heritage. Originating as a Texas

Supporting LGBTQ+ Families in the Classroom
The Waterford.org vision is for every child to reach their full potential through accessible and effective early learning experiences that put them on a meaningful

10 of the Best Elementary Activities for the Last Days of School
The end of the school year can evoke a bittersweet feeling. It marks a moment for celebration as educators contemplate the growth and achievements of

Mental Health Awareness Month 2024: 7 Ways to Nurture Your Child’s Mental Health

MacKenzie Scott’s Yield Giving Awards Waterford.org a $10 Million Grant
Language Arts with Lyn Stone (St Monica's Wodonga)
The simple view of writing.
“Teach to each of the multiple levels of language within each of the four language systems (by ear, mouth, eye, and hand). Each language system has multiple units at which language can be analyzed, learned, and used: subword, word, and multi-word syntax, and text.”
Virginia Berninger (2020), from a presentation entitled Thoughts on Simple and Not So Simple Views of Writing
Just as in the Simple View of Reading, the Simple View of Writing states that there are two critical, separate aspects of fluent writing. They are:
TRANSCRIPTION
Transcription definition
“The process and physical acts of representing sounds to written symbols, including spelling and handwriting skills”
(McCutchen, 2000)
Transcription skills:
- Handwriting
- Keyboarding
Ideation definition:
“The generation and organization of ideas”
(Juel et al. 1986)
Ideation skills:
- Idea generation
- Word choice
- Text structure
To this model, Berninger and Amtmann have added attention, memory and self-regulation.
If we were to break writing down into its separate components, the two critical aspects can be placed on a model much like Scarborough’s Reading Rope, where one side ideally becomes increasingly automatic (transcription) and the other becomes increasingly strategic (ideation).
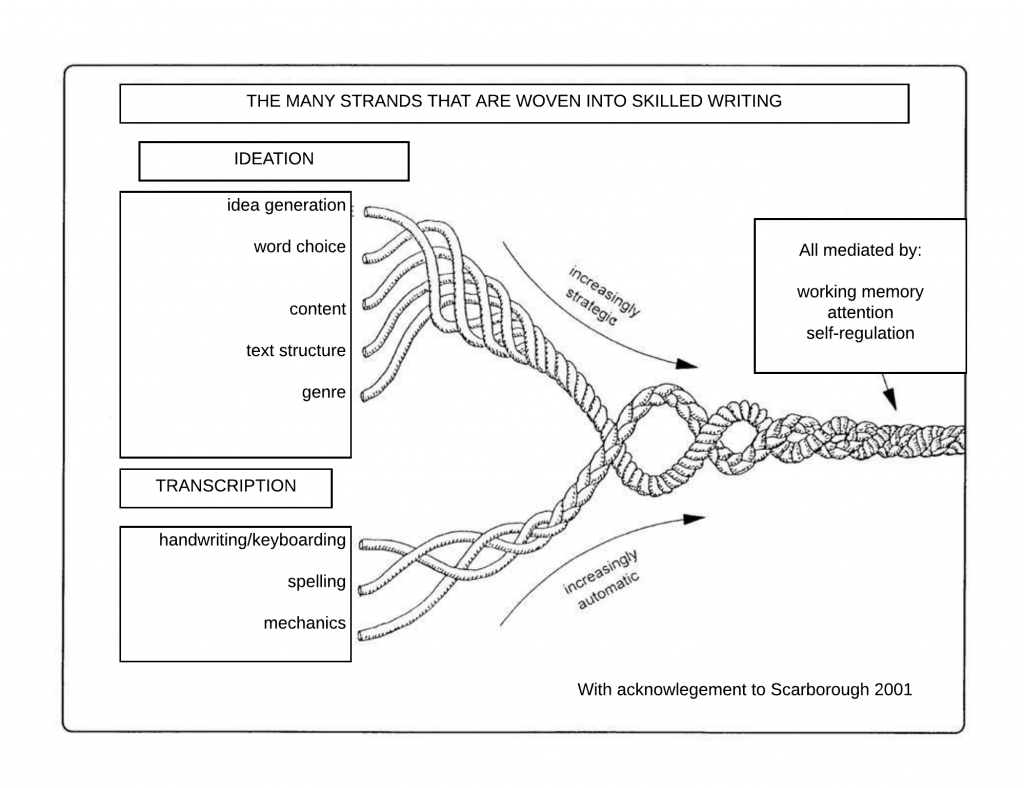
When students struggle with both, this is a strong indicator of dysgraphia.
When students struggle with both, this is a strong indicator of dysgraphia or oral and written language learning disability (OWL LD).
When children struggle with only transcription, this can indicate dyslexia. We will return to these conditions in Module six.
In Language Arts, being able to identify what a child struggles with leads to targeted, effective intervention. Knowing a child’s working memory and attentional capacity alongside their transcription and text generation ability, helps predict response to intervention.
Lesson Resources

- SUGGESTED TOPICS
- The Magazine
- Newsletters
- Managing Yourself
- Managing Teams
- Work-life Balance
- The Big Idea
- Data & Visuals
- Reading Lists
- Case Selections
- HBR Learning
- Topic Feeds
- Account Settings
- Email Preferences
How to Make a “Good” Presentation “Great”
- Guy Kawasaki

Remember: Less is more.
A strong presentation is so much more than information pasted onto a series of slides with fancy backgrounds. Whether you’re pitching an idea, reporting market research, or sharing something else, a great presentation can give you a competitive advantage, and be a powerful tool when aiming to persuade, educate, or inspire others. Here are some unique elements that make a presentation stand out.
- Fonts: Sans Serif fonts such as Helvetica or Arial are preferred for their clean lines, which make them easy to digest at various sizes and distances. Limit the number of font styles to two: one for headings and another for body text, to avoid visual confusion or distractions.
- Colors: Colors can evoke emotions and highlight critical points, but their overuse can lead to a cluttered and confusing presentation. A limited palette of two to three main colors, complemented by a simple background, can help you draw attention to key elements without overwhelming the audience.
- Pictures: Pictures can communicate complex ideas quickly and memorably but choosing the right images is key. Images or pictures should be big (perhaps 20-25% of the page), bold, and have a clear purpose that complements the slide’s text.
- Layout: Don’t overcrowd your slides with too much information. When in doubt, adhere to the principle of simplicity, and aim for a clean and uncluttered layout with plenty of white space around text and images. Think phrases and bullets, not sentences.
As an intern or early career professional, chances are that you’ll be tasked with making or giving a presentation in the near future. Whether you’re pitching an idea, reporting market research, or sharing something else, a great presentation can give you a competitive advantage, and be a powerful tool when aiming to persuade, educate, or inspire others.
- Guy Kawasaki is the chief evangelist at Canva and was the former chief evangelist at Apple. Guy is the author of 16 books including Think Remarkable : 9 Paths to Transform Your Life and Make a Difference.
Partner Center
39 Best Infographic PowerPoint Presentation Templates for 2024 (Giant List)
Find the best infographic slide templates to use for your PowerPoint presentations, and get some useful tips on how to use them.

Do you need to add lots of information to create a great infographic template for PowerPoint? Are you wondering how to make an infographic-rich presentation to capture your audience?
Make the first step in the right direction. It begins with getting quality data presentation templates to work with. Don’t worry—we’ve got you covered with some of the best for 2024.
5 Best Infographic PowerPoint Templates (Video Overview)
Here’s a video preview of some of our best infographic presentation templates. Use it for a closer look at top infographic PowerPoints.
For more information on PowerPoint infographic template PPTs, keep reading the article below for some helpful templates and tips.
Best New Infographic PowerPoint Presentation Templates From Envato for 2024
These are some of the best PowerPoint infographic templates trending now on Envato Elements.
1. Infographic PowerPoint PPT Presentation Template

This infographic PPT presentation template set has 170 professional slide designs. It also comes with creative PowerPoint infographics. The custom vector icons and visual slide designs are ready for you to edit.
2. PPTx Infographics PowerPoint Slides

This modern PowerPoint graphics presentation template set has beautiful slides. Make the most of creative PPT charts, timelines, and icons. Scale and recolor the vector graphics and customize the slide setup.
3. Tech Multipurpose PowerPoint Presentation Deck

With 100 dynamic slides and handmade PPT infographics, this template is ready to rock. It’s made with Slide Master, which makes customization easy. Change colors, edit graphics, or quickly drag and drop your images with just one click.
If you’ve got a presentation soon, grab a PPT template that has everything you need.
4. Sante Infographic Template PowerPoint

If you have no time to learn how to make an infographic in PowerPoint, here’s one of the best PPTs to help you turn ideas into persuasive presentations. This creative infographic template for PowerPoint comes with:
- easy to edit icons
- slide transition animation
- company profile slides
- portfolio slides
5. Eargo Infographic Template PowerPoint

You’ll have all the PowerPoint graphics every startup and business planner needs. Present to investors, key employees, and other stakeholders with confidence thanks to Eargo. This infographic template for PowerPoint comes with:
- over 250 slides
- 30 color themes
- 2000 vector icons
- light and dark backgrounds
Take your business to the next level with this PowerPoint graphics template.
6. Quantum Education Infographic PPT

This infographic template for PPT is fun and easy on the eye. It packs 30 unique slides and loads of useful graphics. You’ll get charts, maps, and device mockups in this infographics PowerPoint template.
You can resize and customize every infographic slide.
7. Infonova Infographic PowerPoint Template

The best PowerPoint presentation templates offer you creative control. This option is no exception. You’ll get a host of customizable infographic slide designs with this download.
This infographic template for PowerPoint is ideal for creative agencies and creators. It comes with free web fonts and it’s based on Master Slides. Just drag and drop your images, it’s that simple!
8. Water Infographic in PowerPoint

Here’s a leading choice for presentation graphics that works for some topics. It comes with minimal white backgrounds and blue, editable charts and graphs. There are 20 infographic slide designs you can customize to suit your presentation.
This infographic template for PowerPoint also has free fonts and so much more.
9. Gets Travel Infographic Template for PowerPoint

This infographic slide template for PowerPoint is great for travel-related presentations. It features stunning graphics with editable colors.
Each of the 50 unique slides in this creative infographic PPT theme is fully editable. Moreover, it comes in both light and dark backgrounds.
10. Foodism Infographics PowerPoint Template

Pitching an idea for a new restaurant? This infographic PowerPoint template is your go-to choice. There are many PPT graphics in this download.
Find 35 infographic slide designs inside. This infographic in PowerPoint also includes two versions with light and dark backgrounds. Few free presentation graphics can say the same.
11. 3D Finance Infographic Template PPT

Deliver dynamic presentations with these great-looking 3D infographics for PowerPoint. This modern template has many PowerPoint infographic examples for financial pitches. Enjoy 35 unique slides in both dark and light versions.
12. Portfolio Infographic Template for PowerPoint

Use this infographic template for PowerPoint to design your next portfolio. It contains 34 well-made, unique infographic slide options. It also features:
- 20+ color themes
- over 4,000 infographics for PowerPoint
- fully editable elements
- drag & drop picture placeholders
- help file and free support service
Play with it and make it your own!
13. Headline PowerPoint Infographic Template

This flat infographic style PPT theme is set up for multi-purpose business presentations. Each infographic slide includes over 4,000 customizable icons. Choose from more than 20 color themes with free fonts used.
14. A New Infographics PowerPoint Template

A New is a great choice if you need an infographic template for PowerPoint. There are over 30 infographic slide designs to put to use. Scroll through the charts and icons, and see what your slideshow needs.
Each of the PowerPoint graphics is customizable and resizable. Instead of free presentation graphics, try out A New.
15. Project Management Infographic PowerPoint Template

PowerPoint infographic templates like this are designed for project managers. Your audience is sure to appreciate your use of infographic slide designs. This set of PowerPoint graphics offers:
- editable graphics
- drag and drop image placeholders
- a help file
16. Pitch-Deck Infographic Template for PowerPoint

Infographic slide designs can help bring ideas to life. PowerPoint infographic templates like this are tools to deliver professional pitches. Change the colors to match your brand and use:
- and so much more!
With a layout based on master slides, this template is easy to edit. You can change the photos by easily drag-and-dropping. Few free presentation graphics for PowerPoint can do that.
17. Business Plan Infographic PowerPoint Template

PowerPoint infographic templates like this help you pitch a business plan. Use this fully customizable, well-organized PPT to show what keeps your team moving. It has loads of features, including:
- 665+ unique layouts
- 4,000+ vector icons
- over 60 premade color themes
- drag and drop image placeholder
- smart object layout & texts
Moreover, it’s regularly updated so you can use it many times and for different purposes!
18. Flanify Infographics PowerPoint Template

Flanify is one of the best new PowerPoint infographic templates available today. It’s got a minimalist design that helps you emphasize your content. There are three dozen unique slides featuring all types of graphics.
You’ll find charts, device mockups, and other icons. This infographic PPT is based on master slides, so it’s super easy to edit.
19. Kopikoe Foodie Infographic Template PPT

This infographic template for PowerPoint has everything you’ll need for a foodie PPT. Audiences react well to infographics because they make advanced concepts easy to understand. This pack includes 30 infographic slide designs for your next project.
With loads of vector icons, you have virtually unlimited creative options. Unlike some free presentation graphics found online, these are professionally designed.
20. Imperial Multipurpose Infographics for PowerPoint

These PowerPoint infographic examples revolve around the health industry. This template includes a full collection of infographics and 30 slides. It features free fronts, a help file, and many other useful tools. You can fully and easily customize every vector icon and image.
21. Juici Foodie Infographic Template PPT

When searching for an infographic template for PowerPoint, aim for high-quality elements. This infographic template PPT gives you that. You’ll also get:
- 100% resizable and editable icons
- drag and drop picture placeholders
- device mockups
If you want a template to pitch about food and drinks, look no further!
22. Inventive Infographic Template for PowerPoint

Premium tech layouts like this go beyond any free presentation graphics online. This creative infographic template PPT bundle includes 35 infographic slide designs. Customize every icon and use the master slides – which help you make bulk edits across the deck in a flash.
23. Osprey Education Infographic PowerPoint Template

Get amazing PowerPoint infographics for your creative business presentation. PowerPoint infographic templates like this give you an array of functional icons. With 30 clean master slide-based layouts, easily edit this PPT as much as you’d like.
24. Edulacti Multipurpose Infographic PPT

This is a creative PowerPoint template for multipurpose business presentation or personal use. This PowerPoint includes 30 infographic slide designs and several icons, such as:
- flow chart infographics
All the included PowerPoint infographic examples are fully editable.
25. Gatzruts Infographics PowerPoint Template

This minimalistic PPT theme is ready to use for many types of presentations. It features a ton of creative, clean infographic slide designs. All these business graphics PowerPoint elements are editable.
As it’s based on master slides, it’s easy to quickly adapt to your needs. Try out this premium choice instead of free presentation graphics for PowerPoint.
26. Mental Concept PowerPoint Infographic Templates

Check out these PowerPoint infographic templates to give a powerful mental concept pitch. These are designed by creative pros with you in mind. It’ll stand out from free infographic templates for PowerPoint.
Make sure to use the various features, including:
- 204 total slides, with 17 unique mental concept slides
- 12 color variations
- 280 fully editable vector icons
- master slides for easy editing
27. Realth Business Infographic PowerPoint Template

It’s important to make a solid first impression right out of the gate. An infographic template for PPT like Realth helps you do just that. In fact, it’s got 30 multipurpose slides built in.
From these, pick and choose to suit your message. The PowerPoint infographic examples help you present:
- growth stats
- pricing packages
- app layouts
- team members
- and so much more
All the graphics are editable, and the used fonts are free.
28. Maps: Set of Infographics for PowerPoint

These PowerPoint infographic templates have a wide variety of clean map designs. Use them to pitch about locations, migration plans, growth stats per region, and so much more. Find 25 unique slides inside, picture placeholders, and over 90 color themes.
29. Puckup Brand Guidelines Infographic PPT

Not sure how to make a branded presentation? Don’t worry, because the PUCKUP infographic template PPT is surprisingly easy to use. All elements are editable with a couple of clicks.
This infographic template for PowerPoint is great for presenting your brand. Easily add your logo, your company’s color palette and typography, and voila! It’s way better than free presentation graphics.
30. Brand Guidelines Infographic PowerPoint Template

Here’s an elegant choice for presenting your brand. Not all infographic PPT options have to be bright in order to be eye-catching. This template is the go-to download for 2024.
This infographic PowerPoint has everything you need to crush your branding proposal:
- 34 unique slides
- picture placeholders
Free presentation graphics may fall short for your brand needs. Choose this one instead!
31. Funnel Infographic Template for PowerPoint

Logistics rule the world in 2024. Are you trying to show the strength of your business’s processes? An infographic template PPT like this is a top choice.
Use each of the professional infographic slide designs to explain things like:
- case studies
- business and marketing plans
32. Nursing PowerPoint Infographic Template

This colorful, creative presentation theme showcases your information and crafts a visual story. It’s an impressive tool for presenting medical-related topics. Unlike most free presentation graphics, it has many unique slides and color schemes.
This infographic in PowerPoint offers:
- light and dark background options
- editable elements
- an icons pack file
33. Mental Health PowerPoint Infographic Templates

This template has several color scheme options and PowerPoint infographic examples. Present with clarity, show your process and progress, and more.
There are easy-to-customize layout options, in both light and dark backgrounds. It also features tons of icons and picture placeholders.
34. Market Research Infographic PowerPoint Template

In need of top PowerPoint presentation graphics for your market research pitch? This one will do. It’s a great pack that includes:
- 15 unique infographic slide designs
- drag-and-drop image placeholders
- easy to change colors
- shapes and other elements
This doesn’t include the images, but everything else is right there. Try this one instead of free infographic templates for PowerPoint.
35. Hot Pitch Deck Infographic PPT

Next up is this stylish and modern infographic slide design. There are over 100 fully animated slides. Moreover, you’ll find:
- 2,000+ vector icons
- 100+ device mockups
- 50+ theme files
- and lifetime updates!
Use the master slides to quickly add a personal touch to this infographic template PPT.
36. Environment Infographic PowerPoint Examples

This infographic PowerPoint template comes with everything you need to create an environmental impact presentation. It comes packed with premium features like:
- 20 education and science slide designs
- .PPT and PPTX. files
- Fully editable and easy to use
- Documentation
37. PowerPoint Infographics Solutions

Work with a PowerPoint infographic template that offers everything you need right out of the box. These infographic PowerPoint examples feature:
- 50 ready-to-use slides
- Over 200 icons (PSD+EPS+AI+JPG+PNG+SVG+PPTX Vector)
- Color themes
- Objects are organized and grouped
38. ECO Infographic Template for PowerPoint

These infographic PowerPoint examples are great for putting together a sustainability infographic presentation. Use the high-quality illustrations and other great features:
- 33 unique slides
- Includes opening and closing slides
- 11 color variations
- Simple line vector icons
- Handmade infographics
39. Infographic PowerPoint Examples

No need to learn how to make an infographic in PowerPoint when you have access to this clean PowerPoint infographics template. Take advantage of its amazing features:
- 80+ unique slides
- 80+ fully animated infographics
- Resizable and editable graphics
- 16:9 widescreen ratio
5 Popular PowerPoint Infographic Slide Design Types
We’ve already established that infographics in PowerPoint are powerful storytelling tools. But let’s go one step further and look at specific examples of the best infographics. We’ll also see how to use them to explain concepts.
1. The Brain Infographic
Some dedicate their whole lives to studying the human mind, and yet there’s always something to learn! The value of a brain infographic is that it’s an intuitive way to show thoughts and ideas and how they connect.
Use an infographic and this tutorial to create a brain graphic that shows the pieces of a thought.
2. The SWOT Infographic
Strengths, weaknesses, opportunities, and threats: every business situation has them. You need a way to show them in your presentation. That’s where the classic SWOT infographic makes its impact.
When you lay out all four components, you’re likely to find insight while creating a strategy.

3. The Puzzle Piece Infographic
You’re probably familiar with putting together puzzle pieces in the real world. Don’t miss out on using this concept as an infographic! As a PowerPoint visual, puzzle pieces can show how the parts of an idea join into a cohesive whole.
Use this article to see how to use puzzle pieces. The best graphic PPTs often use them to tell a story of how everything fits together.
4. The Gantt Infographic
When you’re running a project, you need a way to show that many tasks are running side-by-side. That’s the purpose of a Gantt chart. It’s a special infographic that’s beloved by the best project managers.

Use our tutorial to see Gantt infographics in action . You’ll learn how to use them to plan a project and the resources you need to succeed.
5. The Funnel Infographic
A funnel is yet another infographic you can leverage in PowerPoint to explain a concept. Funnels show inputs, how they progress, and what they ultimately lead to.
Funnel infographics are common in explaining sales processes. They’re easy to build in PowerPoint with templates. Make sure to check out our tutorial on how you can use PowerPoint funnel infographics .
How to Customize an Infographic PowerPoint Template (Fast!)
So far, we’ve looked at powerful PowerPoint infographic templates. But you might be wondering how to use them to design infographic slides of your own.
Let’s learn how to customize three separate slides to build excellent infographics. We’ll use the PPTx Infographics template to rapidly build our infographic slides.
Let’s look at five example slides. These show how easy it is to customize a PowerPoint infographic:
1. Performance Gears

The best PowerPoint templates include abstract designs to build infographics for PPT. Use a little imagination, and there it is! These infographic PowerPoint slides might be perfect for expressing your idea.
Take this turning gear icon slide. In the updated version below, I’ve shifted the elements to show how teams at my company work together.
Simple drag-and-drop actions and grabbing icons from other slides brought this slide to life. Then, I updated the text to match my intent in this infographic template for PowerPoint.

2. Hierarchy Charts

If you work in a corporate environment, I’m certain that you’ve seen org charts before. These exist to show off the company’s reporting structure.
In this case, it’s as simple as typing in the placeholder boxes to update the names and titles. I’ve also added a photo in my example to really “put a face with a name” in my organization. This chart uses SmartArt, a built-in PowerPoint feature that’ll adjust the graphic as you adjust the text.

Learn more about SmartArt PPT infographics .
3. Brain Infographic

Brain charts are infographics that you’ll find in the best PowerPoint templates. They can show how you divide your thinking and showcase the “parts of the whole” that make up your strategy.
In the example below, I’ve left the same basic structure intact. I just updated the descriptions and some of the colors and icons. It’s a simple tweak that shows what my creative agency spends its time on.

Brain infographics are very popular, so we created a resource to teach you how to customize them. Check out our screencast to learn more.
4. Sales Report

PowerPoint infographic templates help you tell stories with your data. Slide 15 in our template is a great choice for creating a data-focused slide.
To edit a PowerPoint chart, edit the data that feeds it. Right-click on the chart and choose Edit Data. You’ll see an embedded version of Excel, Microsoft’s data powerhouse. Just type over the data placeholders, and your chart will update in real time.

Learn more about working with data in this PowerPoint tutorial .
5. The Conclusion Slide

It’s a mistake to think that the last slide is the end of your presentation. Instead, it helps to see it as the start of a conversation with your audience.
You know what’s the best part of PowerPoint infographic templates? Yes, that they include other useful slides. Slide 50, the conclusion slide, is perfect for every presentation. That’s because it can help you continue the conversation by sharing your details.
To update this slide, type over the placeholders. That adapts the slide to your brand-specific details.

For even more ideas and to learn how to create a conclusion side, don’t miss out on our tutorial .
Common PowerPoint Template Questions Answered (FAQ)
You’ve already seen infographic templates for PowerPoint. But you might still have questions about how to use PowerPoint to your advantage.
PowerPoint is an advanced app. It’s easy to use, but there are many professional-grade features. Let’s look at five common questions you might have as you level up your presentation skills:
1. Does PowerPoint Support Custom Fonts?
Every graphic designer is trying to gain an audience’s attention when presenting. It helps to use custom design options in PowerPoint. That sets the presentation apart from those who only use the built-in, standard fonts.
Try out custom fonts with the help of this tutorial .
2. What Size Should I Choose for My Infographic Slide?
The goal for your PowerPoint presentation is to use the full-screen space. You’ve got to set your infographic template PPT to the proper dimensions. Don’t waste any pixels!
Using pre-built PowerPoint infographic templates gives you several size options.
3. How Much Does PowerPoint Cost?
Microsoft has pivoted its business models in recent years. Once upon a time, businesses and power users would buy a license for the latest version of the app every few years. Now, it’s all about subscriptions.
Many users choose Office 365, a monthly subscription package to keep apps up to date. Another option is the free, browser-based version of the app.
4. Can You Create PowerPoint Infographics From Scratch?
Infographic templates for PowerPoint are perfect for creating interactive visuals. But you can also create PowerPoint graphics with the help of a feature called SmartArt.
5. What’s the Best Way to Present Data in PowerPoint?
Presentation graphics can include data. It’s far better to use a chart than to show data in a table or a wall of numbers that are hard to interpret. With the help of presentation graphics and charts, it’s much easier to explain trends and data.
Grab a Fresh PowerPoint Template With Great Infographic Slide Designs
Any of the best PowerPoint presentation templates from Envato Elements will help make your points clear. Choose the best format for your info. Put together just the right PowerPoint infographic slides that tell your compelling story.
Related Articles

UK general election live results 2024: By the numbers
Keir Starmer’s Labour Party has secured a landslide victory in the UK election.

Labour leader Keir Starmer has officially become the UK’s new prime minister with his party winning more than 400 of the 650 seats in the House of Commons – the lower house of Britain’s parliament.
Here is how all the parties performed:
Keep reading
France ‘pushed into the hands of the far left’ says leader of far right, french prime minister gabriel attal offers resignation, tokyo governor declares win after exit polls show her clinching third term, france exit polls project left-wing coalition victory, previous election results.
In 2019, Boris Johnson’s Conservative Party secured a majority by seizing seats from the Labour Party in its traditional heartlands in the north and midlands.
The Conservatives won 365 seats with a net change of +49, while Labour had 203 seats, a net change of -60 from the prior election. The SNP gained 13 seats, bringing the total number of seats in parliament to 48. The Liberal Democrats had 11 seats, a net change of -2 since the last election. The Greens maintained their only seat.

Which are the main parties in the race?
There are several political parties in the UK, however, the two that have dominated the political arena in the 20th and 21st century are the Conservatives and Labour.
- The Conservative Party , also known as the Tories, is a centre-right to right party, currently led by Rishi Sunak, who took over from Liz Truss in October 2022.
- Labour is a centre-left party, led by Keir Starmer. They were last in power between 1997 to 2010 under Tony Blair and Gordon Brown.
- Liberal Democrats , centre to centre-left aligned, led by Ed Davey. In power from 2010 to 2015 in coalition with the Conservatives under David Cameron and Deputy Prime Minister Nick Clegg, then leader of the Liberal Democrats.
- Greens , left-wing ecopolitics, led by Carla Denyer and Adrian Ramsay.
- Reform UK , right-wing party led by Nigel Farage.
- SNP , Scottish National Party, centre-left party led by John Swinney.
- Plaid Cymru , centre-left to left-wing Welsh party, led by Rhun ap Iorwerth.
- DUP , Democratic Unionist Party, centre-right Northern Irish party, led by Gavin Robinson.

How does voting work in the UK?
Voters in 650 constituencies across the UK will elect members of parliament to the lower chamber, the House of Commons, via the first-past-the-post system. To win each constituency and gain a seat in the House, candidates need to receive more votes than any of their competitors.
A party needs to win at least 50 percent of the seats – 326 – to secure a majority in the House of Commons and be asked to form a government by the monarch, King Charles III. The members of parliament’s upper chamber, the House of Lords, are appointed rather than elected.
If no party wins a majority, there is a hung parliament.

The UK’s outgoing parliament
Before parliament closed on May 30, the House of Commons was represented by 13 parties and 17 independents, including:
- The Conservatives – 344 seats (52.9 percent)
- Labour – 205 seats (31.5 percent)
- The Scottish National Party (SNP) – 43 seats (6.6 percent)
- The Liberal Democrats – 15 seats (2.3 percent)
The remaining 43 seats were held by nine other parties and independents.

IMAGES
VIDEO
COMMENTS
A student with excellent decoding skills and strong language comprehension in the subject area of the text will achieve a strong reading comprehension score. The Simple View shows that for a student with both D and LC equal to 100%, the RC score will be 100,% as shown below. RC = D x LC. 1.0 = 1.0 x 1.0.
A great deal of evidence supports a simple equation as the most basic model of what it takes to read. Known as the "simple view of reading," this shows us that reading comprehension is the product of two key skills: the ability to decode written text and the ability to. comprehend oral language.
When resources are limited and teachers have minimal to no background in how to teach reading, the Simple View provides a useful and powerful framework. The Simple View addresses the fundamental issues in early reading acquisition in a clear and useful way. It teaches individuals 1. How to read (decode) words, and 2.
The Simple View of Reading. Bruce Rosow, Ed.D. March, 2013. I. Setting the Stage:. National Report Card: NAEP PISA: International Student Assessment The Simple View of Reading Learning to Read Decoding Comprehension. NAEP Reading: National Results. NAEP Reading: National Results.
The simple view of reading provides teachers with a tool to understand how students are progressing with the 2 key factors of success: reading accuracy and language comprehension. This understanding means that individual learners can be better supported in differentiated ways to become successful readers. Reading is a complex cognitive process.
Myths and Misconceptions #3. Skilled reading requires using syntactic and semantic cues to guess words; good readers make many mistakes as they read text. Good readers rely heavily on the information contained within words themselves (letter/word cues) to read words quickly and automatically. Context is used only to grasp word meaning.
Learning to read consists of developing skills in two critical areas: (1) Reading each word in texts accurately and fluently and (2) Comprehending the meaning of texts being read. This is known as the Simple View of Reading. To read words accurately and fluently, students need strategies to read words they have never seen before in print as ...
College students' views on the use of Classroom-based PowerPoint presentations. Jonalou S Labor. PowerPoint presentations (PPT) are measures of the technological capacity of the teacher inside the classroom. Students even expect their teachers to be knowledgeable of the design and delivery of the said tool in order to better teach the students.
According to Farrell, Davidson, Hunter, and Osenga (2020), the Simple View of Reading is based on the widely accepted view that reading has two key components: word recognition (decoding) and comprehension. The Simple View formula, presented by Gough and Tunmer in 1986, is: Decoding (D) x Language Comprehension (LC) = Reading Comprehension (RC)
The Simple View, developed by Philip B. Gough and William E. Tunmer in the 1980s, identifies two key areas of proficiency for literacy development: word recognition and language comprehension. [1] When these two factors work in tandem, reading comprehension is the result.
The Simple View of Reading is supported by scientific research. Definitions. For purposes of the Simple View of Reading, skilled decoding (D) is defined as "efficient word recognition" (Hoover & Gough, 1990). This definition goes beyond the traditional definition of decoding as the ability to sound out words based on phonics rules.
Simple View of Reading . Language Comprehension. Reading Comprehension. Gough and Tunmer (1986) Decoding. Word recognition. To Know: The Simple View of Reading is a formula demonstrating the widely accepted view that reading has two basic components: word recognition (decoding) and language comprehension. To Say: Let's recap on what we read ...
Over the years, several influential models of reading have significantly shaped the reading research landscape. The Simple View of Reading (SVR), first proposed by Gough and Tunmer in 1986, is one such model. In today's post, we'll provide an overview of this model and discuss some implications.THE SIMPLE VIEW OF READING: AN OVERVIEWThe SVR functions as a formula consisting of three ...
The Importance of the Simple View of Reading in Literacy Instruction. The Simple View of Reading model plays a pivotal role in literacy instruction. This model is instrumental in identifying potential difficulties in reading at an early stage. By focusing on the two core components - decoding and linguistic comprehension - educators can ...
Teaching Reading Is Rocket Science. Use Page 5 in your Participant Handout as you review two sections of Teaching Reading Is Rocket Science. 29. 30. "Within his brain, the child is literally building the neural circuitry that links. the sounds of spoken words, the phonemes, to the print code, the letters. that represent those sounds.".
It started off as the Gough theoretical model and is now commonly referred to as the simple view of reading, which looks something like this. The simple view of reading states that word reading multiplied by language comprehension = reading comprehension. This shows us that reading comprehension is the product of word recognition along with ...
Abstract. A simple view of reading was outlined that consisted of two components, decoding and linguistic comprehension, both held to be necessary for skilled reading. Three predictions drawn from ...
The simple view of reading is a scientific theory that a student's ability to understand written words depends on how well they sound out (decode) the words and understand the meaning of those words. Specifically, their reading comprehension can be predicted by multiplying their skill in decoding the written words by their ability to understand the meaning of those words.
The SVR was an idea, an observation about learning to read, not a conclusion based on empirical research. I thought the idea was important and discussed the Simple View in my book (p. 118). The SVR says that reading is the product (in the arithmetic sense) of word recognition and language comprehension. Stated in words, the SVR holds that:
The Simple View of Reading 1. Poor at language comprehension 2. Poor at decoding 3. Weak in both areas • RC scores will not be at average of D and LC skills. • "When one variable is strong, the RC will be equal to the weaker variable". (Farrell et al., 2022) RC=DxLC .50=1.0x.50 "When neither variable is strong the RC score will be lower than the variables".
Article. The simple view of reading (SVR) was introduced by Gough and Tunmer over 30 years ago in a short paper in this journal (Gough & Tunmer, 1986). At the time, it was unlikely that the authors had any appreciation of the impact their rather simple but insightful conceptualization would have on the field of reading.
In a presentation with Waterford.org, Julie Christiansen reaffirmed that the science of reading is "the body of research from neuroscience and education that helps us understand how the brain learns to read and how to deliver instruction that helps students learn to read most effectively. ... These strands are aligned with the Simple View of ...
The Simple View of Writing. "Teach to each of the multiple levels of language within each of the four language systems (by ear, mouth, eye, and hand). Each language system has multiple units at which language can be analyzed, learned, and used: subword, word, and multi-word syntax, and text.". Virginia Berninger (2020), from a presentation ...
Summary. A strong presentation is so much more than information pasted onto a series of slides with fancy backgrounds. Whether you're pitching an idea, reporting market research, or sharing ...
Find the best infographic slide templates to use for your PowerPoint presentations, and get some useful tips on how to use them. ... keep reading the article below for some helpful templates and tips. ... creators. It comes with free web fonts and it's based on Master Slides. Just drag and drop your images, it's that simple! 8. Water ...
Labour leader Keir Starmer has officially become the UK's new prime minister with his party winning more than 400 of the 650 seats in the House of Commons - the lower house of Britain's ...