IELTS Academic Writing Task 1 Samples
Prepare for the IELTS Academic Test by using this collection of IELTS Academic Writing Task 1 practice samples. This collection is a great way to gain insight and practice for the exam.

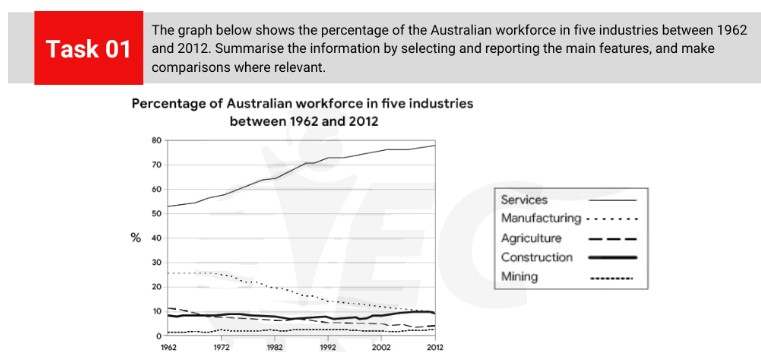
The bar chart shows the percentage of the total world population in 4 countries in 1950 and 2002, and projections for 2050. Summarise the information by selecting and reporting the main features and make comparisons where relevant.

The provided bar chart depicts the changes in the percentage of overweight males and females in Australia over a thirty-year period, from 1980 to 2010.

The bar chart below shows the percentage of Australian men and women in different age groups who did regular physical activity in 2010. Summarise the information by selecting and reporting the main features, and make comparisons where relevant.

The diagram below shows the manufacturing process for making sugar from sugar cane. Summarise the information by selecting and reporting the main features, and make comparisons where relevant.

The graph below shows the average monthly change in the prices of three metals during 2014. Summarize the information by selecting and reporting the main feature, and make comparisons where relevant.

The chart below show the changes in ownership of electrical appliances and amount of time spent doing housework in households in one country between 1920 and 2019.

The bar chart shows the number of visitors to three London Museums between 2007 and 2012. Summarize the information by selecting and reporting the main features, and make comparisons where relevant.

The charts show participation in sporting activities at RT college over a 35-year period and the number of cyclists at this college in 1995

The graph below shows the average closing prices of selected precious metals from 2013 to 2021. Summarise the information by selecting and reporting the main features and make comparisons where relevant.

The graph below shows the quantities of goods transported in the UK between 1974 and 2002 by four different modes of transport. Summarise the information by selecting and reporting the main features, and make comparisons where relevant.

The pie charts below show usage share of desktop browsers in 2019 and 2021. Summarise the information by selecting and reporting the main features and make comparisons where relevant.

The graph below gives information about the number of people who smoked cigarettes in the UK between 2011 and 2021. Summarise the information by selecting and reporting the main features and make comparisons where relevant.

The line graph shows the number of books that were borrowed in four different months in 2014 from four village libraries, and the pie chart shows the percentage of books, by type, that were borrowed over this time. Summarise the information by selecting and reporting the main features and make comparisons where relevant.

The line graph shows the number of books that were borrowed in four different months in 2014 from four village libraries. Summarise the information by selecting and reporting the main features and make comparisons where relevant.

The two maps below show road access to a city hospital in 2007 and in 2010. Summarise the information by selecting and reporting the main features, and make comparisons where relevant.

The graph below shows the number of tourists visiting a particular Caribbean island between 2010 and 2017. Summarize the information by selecting and reporting the main features, and make comparisons where relevant.

The line graph shows the past and projected finances for a local authority in New Zealand. Summarize the information by selecting and reporting the main features and make comparisons where relevant.

The graph gives information about male and female gym membership between 1980 and 2010. Summarise the information by selecting and reporting the main features, and make comparisons where relevant.

Task 1 The graph below shows the number of tourists visiting a particular Carribean island between 2-10 and 2017. Summarise the information by selecting and reporting main features, and make comparisons where relevant.

The graph below shows the average monthly change in the prices of three metals during 2014.

The graphs below show the numbers of male and female workers in 1975 and 1995 in several employment sectors of the Republic of Freedonia Summarise the information by selecting and reporting the main features, and make comparisons where relevant.

The graph below shows the number of shops that closed and the numer of new shops that opened in one coutry between 2011 and 2018.

The chart above give information about different types of waste disposed of in one country in 1960 and 2021.

The graph below gives information about the percentage of the population in four Asian coountries living in cities from 1970 to 2020, with predictions for 2030 and 2040.

The charts below show the percentage of water used for different purposes in six areas of the world. Summarise the information by selecting and reporting the main features and make comparisons where relevant.

The chart below show the percentage of households in owned and rented accommodation in England and Wales between the 1918 and 2011. Summarize the information by selecting and reporting the main features, and make comparison where relevant.

The charts below give information about different types of waste disposal of in one country in 1960 and 2011. Summarize the information be selecting and reporting the main features, and make comparisons where relevant.

MamadjonovSamandar: The graph below shows four countries of residence pf overseas students in Australia. Summarize the information by selecting and reporting the main features, and make make comparisons where relevant

The bar chart shows the top ten countries for the production and consumption of electricity in 2021. Summarize the information by selecting and reporting the main features, and make comparisons where relevant.

The pie charts below show the different types of courses, which were followed by the students during the years of 1984, 1994 and 2004

The diagram shows how instant noodles are manufactured. Summarize the information by selecting and reporting the main features, and make comparisons where relevant.

The graph below gives information about the preferred leisure activities of Australian children.

The pie charts below show favourite social media channels from 2011 to 2013. Summarize the information by selecting and reporting the main features, and make comparisons where relevant.

The graph below shows the number of shops that closed and the number of new shops that opened in one country between 2011 and 2018. Summarise the information by selecting and reporting the main features, and make comparisons where relevant. Write at least 150 words. Task 1

The graph below shows the changes in maximum number of Asian elephants between 1994 and 2007. Summarize the information by selecting and reporting the main features and make comparisons where relevant.

The maps below show the changes in a town after the construction of a hydroelectric power dam from 1990 to 2010.

The chart below shows the total number of hours per month from 1980 to 2015 that people in the USA used modern technology divided into four categories. Summarise the information by selecting and reporting the main features, and make comparisons where relevant.

The maps below show the changes in a town after the construction of a hydroelectric power dam

The given line graph compares the proportion of domestic waste recycling in the UK, France and Germany from 2005 to 2015. Overall, the recycling rates in the UK and Germany increased over the period while it actually decreased in France.

The maps below show the changes in the art gallery ground floor in 2005 and the present day. Summarize the information by selecting the main features, and make comparisons.

The graph below gives information about the percentages of the population in four Asian countries living in cities from 1970 to 2020, with predictions for 2030 and 2040.

The bar chart shows the results of a survey, in which people in Europe and the USA were asked what they consider to be the most important factor in the success of a business. Summarise the information by selecting and reporting the main features, and make comparisons where relevant.

The chart below gives information about how families in one country spent their weekly income in 1968 and in 2018. Summerise the information by selecting and reporting the main features, and make comparisons where relevant.

The chart below gives information about how families in one country spent their weekly income in 1968 and in 2018.

the chart below shows the value of one country's exports in various categories during 2015 and 2016. The table shows the percentage changes in each caterogry of exports in 2016 compared 2015. Summarise the information by selecting and reproting the main features and make comparisons where relevant.

The diagram below shows how the Australian Bureau of Meteorology collects up-to-the-minute information on the weather in order to produce reliable forecasts. Write a report for a university lecturer describing the information shown below. » You should write at least 150 words.

The map below shows the development of the village of Ryemouth between 1995 and present. Summarise the information by selecting and reporting the main features and make comparisons where relevant. Write at least 150 words.

The diagrams below show the water supply system in Australia present and in future. Summarise the information by selecting and reporting the main features and make comparisons where relevant.

The charts below show what UK graduate and postgraduate student who did not go into full-time work did after leaving college in 2008. Summarise the information by selecting and reporting the main features, and make comparisons where relevant.

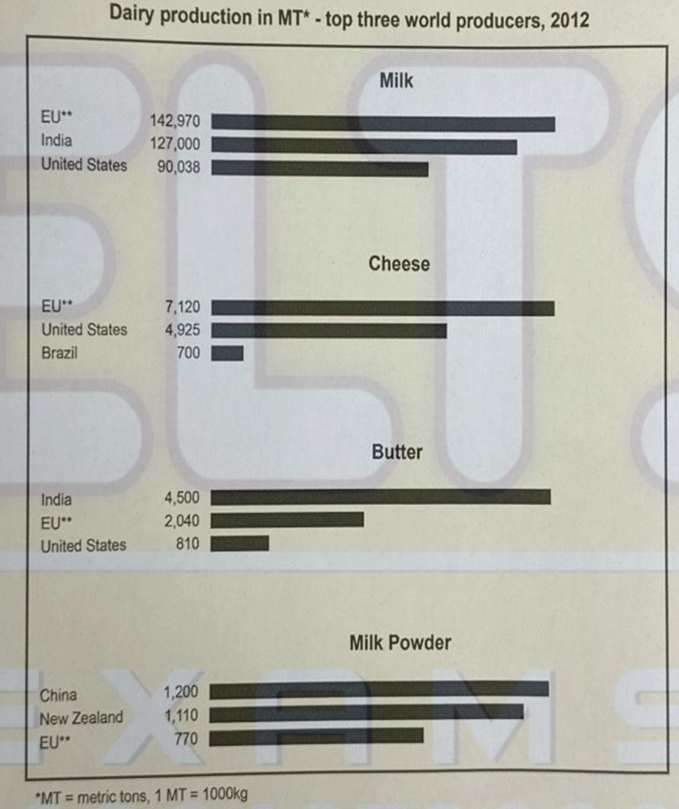
The charts below give information about the world's top three producers for four different dairy products (milk, cheese, butter, milk powder) in the year of 2012.

The graph below shows the average number of Vietnamese students studying in France, Russia and America between 2000 and 2015. (million students). Summarise the information by selecting and reporting the main features, and make comparisons where relevant.

The graph below gives information on the numbers of participants for different activities at one social centre in Melbourne, Australia for the period 2000 to 2020.

The tables and charts below give information on the police budget for 2017 and 2018 in one area of Britain. The table shows where the money came from and the charts show how it was distributed

The chart below shows the value of one country’s exports in various categories during 2015 and 2016. The table shows the percentage change in each category of exports in 2016 compared with 2015. Summarise the information by selecting and reporting the main features, and make comparisons where relevant.

MamadjonovSamandar: The graph below shows four countries of residence of overseas students in Australia. Summarize the information by selecting and reporting the main features, and make make comparisons where relevant

The chart below show the average percentage in typical meals of three types of nutrients, all of which may be unhealthy if eaten too much. Summarise the information by selecting and reporting the main features and make comparison where relevant

The chart below shows the expenditure of two countries on consumer goods in 2010.

The graph below shows the number of overseas visitors to three different areas in a European country between 1987 to 2007

The pie charts give information about enegy consumption between 2015 to 2040.

The charts below show the main methods of transportation for people of one university for work or study in 2004 and 2009. Summarize the information by selecting the main features and comparisons where relevant.

The given line graph compares the proportion of domestic waste recycling in the UK, France and Germany from 2005 to 2015. Overall, the recycling rates in the UK and Germany increased over the period while it actually decreased in France

The map below is of the town of canterbury. A new school (s) is planned for the area. the map shows two possible sites for the school. summarize the information by selecting and reporting the main features, and make comparisons where relevant.

The chart below shows global sales of the top five mobile phone brands between 2009 and 2013. Write a report for a university, lecturer describing the information shown below. Summarise the information by selecting and reporting the main features and make comparisons where relevant.

The maps below show the changes that have taken place at the seaside resort of Templeton between 1990 and 2005. Summarise the information by selecting and reporting the main features, and make comparisons where relevant.

Chorleywood is a village near London whose population has increased steadily since the middle of the 19th century. The map below shows the development of the village.

The charts below show the percentages of volunteers by organizations in 2008 and 2014.

You should spend about 20 minutes on this task. The map below shows three proposed sites for a new supermarket (A, B and c) in the city of Ellington. Summarise the information by selecting and reporting the main features, and make comparisons where relevant. Write at least 150 words

The graph below shows average carbon dioxide emissions per person in the United Kingdom, Sweden, Italy and Portugal between 1967 and 2007. Summarise the information by selcting and reporting the main features.

The chart below shows how frequently people in the USA ate in fast food restaurants between 2003 and 2013.

The maps below show an industrial area in the town of Norbiton, and planned future development of the site.

The graph below gives information about the price of bananas in four countries between 1994 and 2004. Summarise the information by selecting and reporting the main features, and make comparisons where relevant.

The table below shows local catches and imports of fresh fish into Perth, Australia for the years 2004 - 2014. Summarise the information by selecting and reporting the main features, and make comparisons where relevant. You should write at least 150 words.

The table below shows local catches and imports of fresh fish into Perth, Australia for the years 2004 - 2014. Summarise the information by selecting and reporting the main features, and make comparisons where relevant.

the pie charts give information about enegy consumption

the graph gives information about changes in the birth and death rates in. new zeland between 1901 and 2101

The map below is of the town of Garlsdon. A new supermarket (S) is planned for the town. The map shows two possible sites for the supermarket. Summarise the information by selecting and reporting the main features, and make comparisons where relevant. You should write at least 150 words.

The graph belw shows theb percerntage of female workers and workers aged 50 or above in the workforce. summarise thevinformaion by selecting and reporting the main features, and make comparisons where relevant.

The graph shows data on the manufacture of passenger cars in 2015. Summarise the information by selecting and reporting the main features, and make comparisons where relevant. Write at least 150 words.

The bar chart below illustrates five different industries’ percentage share of Brazil’s economy in 2009 and 2019 with a forecast for 2029. Summarise the information by selecting and reporting the main features, and make comparisons where relevant. Write at least 150 words.

The chart below shows the amount of leisure time enjoyed by men and women of different employment status. Summarise the information by selecting and reporting the main features, and make comparisons where relevant.

The two line graphs below show New Zealand import figures from Australia and Japan in the years 1994 - 2004. Summarise the information by selecting and reporting the main features, and make comparisons where relevant. You should write at least 150 words.

The graph and chart give information and forecast about the vehicle and CO2 emission in England and Wales between 2000 and 2020.

The chart shows components of GDP in the UK from 1992 to 2000. Summerize the information by selecting and reporting the main features and make comparisons where relevant.

The diagram below shows the floor plan of a public library 20 years ago and how it looks now. Summarise the information by selecting and reporting the main features, and make comparisons where relevant.

The chart below shows the number of households in the US by their annual income in 2007, 2011 and 2015. Summarise the information by selecting and reporting the main features, and make comparison where relevant.

The diagram shows the process for labelling shellfish for the international market. Summarize the information by selecting and reporting the main features.

- Unlimited Task 1 checks Get all the feedback you need to keep improving your charts and letters.
- Unlimited Task 2 checks Practice and perfect your skills with essays.
- Personalized suggestions Know how to boost your score.
- Detailed mistakes analysis Get instant feedback. Spot every mistake.
- Topic ideas generator Get topic-specific ideas to enhance your writing.
- Vocabulary helper Get the right words for any topic.
- Progress tracking Track your writing improvements.
- Preparing for IELTS
- Practice tests
- Free online IELTS Writing practice tests
- Free online IELTS Academic Writing practice tests - paper
IELTS practice Academic Writing test - Task 1
How to approach academic writing task 1.
In the IELTS Academic Writing test, you will have one hour to complete both of the two set writing tasks. Keep an eye on the time it takes you to complete practice Tasks 1 and 2 to make sure you don’t go too far over, and to use as a benchmark for how long you can expect each task to take you.
In the actual test, you will move from the first to the second task without a break. However, while practising, you may wish to reflect on the outcomes of practice Task 1 using the model answer provided before moving on to practice Task 2. Or you may wish to complete them both before looking at the model answers to give you a more accurate sense of timing.
An easy reminder…
Q: How long should I spend on IELTS Writing Task 1?
A: We suggest 20 minutes – saving 40 minutes for Task 2.
Q: How many words for IELTS Writing Task 1?
A: 150 words is about the right length, but don’t be afraid to go a little over.
Q: Should I be formal or conversational in style?
A: You should write in a formal style, suited to an academic environment.
Q: What are the do’s and don’ts in IELTS Writing task 1?
A: Do pay attention to time - task 1 is worth one third of the total marks (while task 2 is worth two thirds), Don’t let nervousness stop you from trying your best.
Get more tips to help you prepare for the writing tasks
Task 1 – Take a look at the chart below and perform the task as outlined:
This graph shows the proportion of four different materials that were recycled from 1982 to 2010 in a particular country.
Summarise the information by selecting and reporting the main features, making comparisons where relevant.

What should I do next?
Once you’ve finished, you can download the model answer for Writing Task 1 and see how your work compares.
This sample offers a useful guide for how to structure your answer for IELTS writing task 1, as well as the style of writing expected. A good way to improve is to reflect on how your answer compares to the model answer – and, of course, keep practicing.
If you want to see an example of an actual answer sheet for the IELTS Academic Writing test (‘on paper’ version), you can download a sample copy below.
- IELTS practice Academic Writing test - Task 2
IELTS Preparation with Liz: Free IELTS Tips and Lessons, 2024

- Test Information FAQ
- Band Scores
- IELTS Candidate Success Tips
- Computer IELTS: Pros & Cons
- How to Prepare
- Useful Links & Resources
- Recommended Books
- Writing Task 1
- Writing Task 2
- Speaking Part 1 Topics
- Speaking Part 2 Topics
- Speaking Part 3 Topics
- 100 Essay Questions
- On The Day Tips
- Top Results
- 50% DISCOUNT
IELTS Writing Task 1 Tips, Model Answers & More
Useful IELTS writing task 1 tips, answers, lessons & videos for success achieving a high score. This page contains all the information and help you need to do well. Learn about the IELTS marking criteria, paragraphing, vocabulary and much more. This page has tips for Academic writing task 1 and GT writing task 1 (see bottom of page).
IELTS Writing Task 1 Information
- IELTS recommend you spend no more than 20 mins on writing task 1. However, the time is yours to manage as you wish.
- You should write over 150 words.
- IELTS writing task 1 is worth only about 33% of your total writing marks.
- Task Achievement (25%)
- Coherence & Cohesion (25%)
- Vocabulary (25%)
- Grammar (25%)
- : IELTS Writing Task 1 Band Scores
- Academic writing task 1 is a report on a chart (bar chart, line graph, pie chart, table, map, diagram/process). See below for practice charts, model answers, tips etc.
- General Training writing task 1 is a letter only. GT letter writing tips can be found towards the bottom of this page. Click here for Information about GT Writing Differences. There are tips for letter writing, further down this page.
- All words will be counted and all numbers count as one word. See this page: How Words are Counted
- For more information about IELTS test rules, tips etc, see this page: IELTS Test 1 FAQ
IELTS Writing Task 1 Practice Charts
A collection of useful IELTS writing task 1 practice samples to develop your writing at home.
IELTS Charts for Practice : Academic Test Only
- Academic students may get bar charts, tables, line graphs, pie charts, maps and diagrams (processes).
IELTS Letters for Practice : GT Test Only
- GT students will only be given letters for task 1. GT students can find more tips lower down this page.
IELTS Writing Task 1 Tips & Free Videos
Free IELTS writing task 1 tips and videos for the right techniques and understanding the test more clearly.
- Essential Tips : How to Prepare for Writing Task 1
- Tips : How Many Words Should you Write?
- Tips: What tense to use in writing task 1?
- Tips : Penalty for Under the Word Count
- Video: How to write an introduction paragraph
- Video : How to Describe a Bar Chart with model answer
- Video : Map Language: 1
- Video : Conclusion or Overview Tips
- Video : Vocabulary for Accurate Data
- Video : How many Paragraphs
- Video : Official Writing Answer Sheet Tips
- Video : Line Graph 4 Main Sentences
IELTS Bar Chart Video
Learn how to describe a bar chart in IELTS writing task 1. You can find a model answer for this lesson here: Model Answer .
Writing Task 1 Model Answers
IELTS model answers for charts, graphs, diagrams, maps and tables.. Each sample answer is estimated band score 9.
- Diagram Model Answer
- Bar Chart & Pie Charts Model Answer
- Table Model Answer
- Map Model Answer
- Line Graph Model Answer
- Bar Chart Model Answer
- Pie Chart Model Answer
- Bar Chart of Age Groups Model Answer
- Table Future Form Model Answer
- Line Graph & Bar Chart Model Answer
- Practise at Home: IELTS Sample Practice Charts
IELTS Writing Task 1 Practice Lessons
IELTS writing task 1 free practice lessons to help you develop skills and understand about the requirements of task 1 academic. More lessons will be added over time.
- Table & Pie Charts
- IELTS Diagram Rainwater
- Two Line Graphs: Exercise & Model
- IELTS Diagram Paragraphs and Organisation
- IELTS Life Cycle Diagram: Model & Gap Fill
- Bar Chart of Change over Time
- IELTS Line Graph Gap Fill Exercise
- IELTS Diagrams: Practice Exercise
- IELTS Line Graph: Vocabulary List
- IELTS Line Graph: How to Describe Guidelines
- IELTS Line Graph: Exercise & Model
- Task 1 Improving Line Graph Introduction Paragraph
- IELTS Map: Comparison Exercise
- IELTS Two Charts Practice: Pie Chart & Bar Chart
- IELTS Bar Chart: Practice Exercise
- IELTS Diagram Water Supply
- Grammar Accuracy: Practice & Tips
- IELTS Bar Chart: Introduction & Overview Practice
- IELTS Pie Chart: How to Describe a Pie Chart Step by Step
- IELTS Frog Diagram: Introduction & Overview Practice
- Introduction Paragraph: Correcting Errors
- IELTS Bar Chart Sample Answer
IELTS General Training Letter
The following links are for IELTS candidates who are preparing for the General Training Writing Test. Your task will be asked to write a letter. You will not be writing a report as in the Academic Test. Use the links below to help you prepare:
10 Essential Tips for IELTS Letter Writing
How to Improve your IELTS GT Letter
Differences between GT & Academic Writing
General training model letters and practice exercises:
- Apology Letter: Model Answers Formal & Informal
- Amendment Letter: Model Answer 2017
- Complaint Letter: Model Answer
- Complaint Letter: Error Correction
- Letter to a Friend: Model Answer
- Invitation Letter: Model Answer
………………
FREE SUBSCRIBE: to g et new lessons & posts by email
Type your email…
Advanced IELTS Lessons & E-books

Recent Lessons
50% discount: advanced ielts lessons & e-books, ielts writing task 2 essay topics 2024, introduction paragraph for ielts writing task 1, ielts speaking part 2 topic water sports: vocab & model answer, ielts liz personal update 2024.
Click Below to Learn:
- IELTS Test Information
Copyright Notice
Copyright © Elizabeth Ferguson, 2014 – 2024
All rights reserved.
Privacy Policy & Disclaimer
- Click here: Privacy Policy
- Click here: Disclaimer
Return to top of page
Copyright © 2024 · Prose on Genesis Framework · WordPress · Log in
IELTS Exam Preparation: Free IELTS Tips, 2024
Ielts sample charts (ielts writing task 1).
The Writing Task 1 of the IELTS Academic test requires you to write a summary of at least 150 words in response to a particular graph (bar, line or pie graph), table, chart, or process (how something works, how something is done). This task tests your ability to select and report the main features, to describe and compare data, identify significance and trends in factual information, or describe a process.
Exam Preparation
Ielts preparation, ielts sample letters (ielts writing task 1).
The purpose of this section is to help you with the Writing Task 1 of the IELTS General test. In Task 1, candidates are asked to respond to a given problem with a letter requesting information or explaining a situation. It is suggested that about 20 minutes is spent on Task 1, which requires candidates to write at least 150 words. Depending on the task suggested, candidates are assessed on their ability to:
- engage in personal correspondence - elicit and provide general factual information - express needs, wants, likes and dislikes - express opinions (views, complaints etc.)
IELTS Writing Task 2 (IELTS Sample essays)
IELTS Writing Task 2 requires you to write at least 250 words. You will be presented with a topic and will be tested on your ability to respond by giving and justifying an opinion, discussing the topic, summarizing details, outlining problems, identifying possible solutions and supporting what you write with reasons, arguments and relevant examples from your own knowledge or experience. The assessment of Task 2 carries more weight in marking than Task 1. Writing scripts are marked by trained and certificated IELTS examiners, who all hold relevant teaching qualifications and are recruited as examiners by the test centres and approved by British Council or IDP: IELTS Australia.
SHARE THIS PAGE
The reading, writing and listening practice tests on this website have been designed to resemble the format of the IELTS test as closely as possible. They are not, however, real IELTS tests; they are designed to practise exam technique to help students to face the IELTS test with confidence and to perform to the best of their ability.
While using this site, you agree to have read and accepted our terms of use, cookie and privacy policy.
Dear readers,
This is to inform you that we have moved to a new domain, https://www.ielts-writing.info/EXAM/ .
Our old domain, https://www.ielts-exam.net/ will remain active till the time we migrate all our content to the new domain.
We look forward to your continuing support.
IELTS Writing Task 1 – Sample Questions and Practice Resources

On the IELTS Academic exam, Writing Task 1 requires you to look at an informational graphic and describe the contents of the graphic in writing. In this post, we’ll look at different IELTS Writing Task 1 samples to prepare you for test day. In addition to advice and practice, you’ll also get our IELTS Writing Task 1 Examples PDF with Answers for portable prompts and model answers.
IELTS Academic Writing Task 1 Samples With Answers PDF
If you want a print-friendly version of the IELTS Writing Task 1 samples in this post, click below to access the IELTS Writing Task 1 examples PDF!

Note that all the IELTS Writing Task 1 samples are model essays for a band 9 IELTS score. The line graph sample prompt includes a detailed scoring explanation. You can learn more about scores for IELTS Writing Task 1 by consulting the official IELTS rubric .
- Take a good look at our guide to IELTS Writing Task 1 paragraph structure . The guide tells you everything you need to know about how Writing Task 1 essays and paragraphs should be structured, with an example question and model essay.
IELTS Writing Task 1 Samples: The Major Question Types
Below are questions for each common infographic in IELTS Writing Task 1: bar charts, pie charts, line graphs, process diagrams, and maps.
IELTS Academic Writing Task 1: Line Graph with Model Answer and Scoring Explanation

[/threecol_one_last]
IELTS Academic Writing Task 1: Bar Chart With Model Answer

Pie Chart with Model Answer

Process Diagram with Model Answer

IELTS Academic Writing Task 1: Map with Model Answer

IELTS Academic Writing Task 1: Two Different Types of Graphics

| TOWN | AVERAGE ANNUAL RAINFALL (1971-2000) |
|---|---|
| Kainaliu | 138.38 |
| Opihihale | 97.53 |
| Holualoa | 110.48 |
[/threecol_two][threecol_one_last]
Additional Resources for Writing Task 1
Now that you’ve seen some models for how this task is done, you should be ready for some real practice! Here are some resources from Magoosh that should help.
- Practicing using these common IELTS Writing Task 1 and Task 2 linking words .
- Familiarize yourself with the test with IELTS Academic Writing Task 1: Ultimate Guide video , and use a Writing diagnostic quiz to assess your current strengths and weaknesses.
- Use study schedules to help you find time to study and stay motivated. To help you organize your time, use this IELTS study schedule if you only have a week to go before you will take the IELTS. If you have a month, this one month IELTS study schedule offers more extended practice.
- Find high-quality study materials. We offer a huge collection of study reources for the whole IELTS Writing seciton ! Don’t forget about Magoosh IELTS Prep which includes lessons on IELTS Writing Task 1 (and all other sections of the exam!) to help you prep smarter. In addition to many video lessons and practice essays, the 6-month plan allows students to get feedback and scoring on four practice IELTS Writing essays; the 1-month plan includes feedback on one essay. You can also browse more recommended books and resources !

David is a Test Prep Expert for Magoosh TOEFL and IELTS. Additionally, he’s helped students with TOEIC, PET, FCE, BULATS, Eiken, SAT, ACT, GRE, and GMAT. David has a BS from the University of Wisconsin-Eau Claire and an MA from the University of Wisconsin-River Falls. His work at Magoosh has been cited in many scholarly articles , his Master’s Thesis is featured on the Reading with Pictures website, and he’s presented at the WITESOL (link to PDF) and NAFSA conferences. David has taught K-12 ESL in South Korea as well as undergraduate English and MBA-level business English at American universities. He has also trained English teachers in America, Italy, and Peru. Come join David and the Magoosh team on Youtube , Facebook , and Instagram , or connect with him via LinkedIn !
View all posts
More from Magoosh

Leave a Reply Cancel reply
Your email address will not be published. Required fields are marked *
- Skip to primary navigation
- Skip to main content
- Skip to primary sidebar
- Skip to footer
IELTS Advantage
IELTS Preparation Courses
IELTS Writing Task 1: Everything You Need to Know
Ielts writing task 1 in 6 simple steps.

Academic Writing Task 1 Strategy
- Understand how the test is marked. Knowing the marking criteria will allow you to give the examiner exactly what they need.
- Paraphrase the question. It is best to paraphrase the question in the first paragraph. You can do this by using synonyms.
- Write the overview. To write your overview , pick 3 or 4 of the main features and write about them generally without referencing any data.
- Support the main features. In a new paragraph, support the key features with the data in the information given to you.
- Check your work. Check your report for spelling and grammar mistakes. Make sure that the data you mentioned is also accurate!

Essential Writing Task 1 Skills
- How to Write an Overview Paragraph
- How to Paraphrase
- How to Write a Complex Sentence
- How Many Words?
- Task 1 Charts Checklist
- Task 1 Tips
- The Danger of Synonyms
- 6 Common Mistakes
- Paragraphing and Editing
Writing Task 1 Full Lessons
- Writing Academic Task 1 in 5 Easy Steps
- Charts Lesson
- Maps Lesson
- Multiple Charts/Graphs
- Process Lesson

Academic Task 1 Sample Answers

- Bar Chart Sample Essay (Cars in Asia)
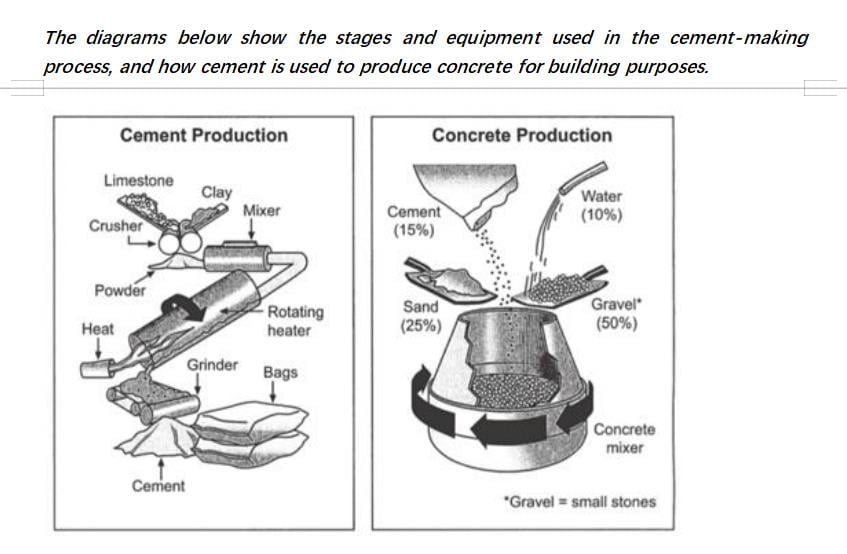
- Process- Cement and Concrete Production
- Pie Chart (Italy and Yemen Populations)
- Process Question
- Bar Chart Question (UK Telephone Usage)
- Line Graph (US Consumption of Energy)
- Bar Chart Sample Answer (International Students)
General Training Writing Task 1

General Training Writing Task 1 in 5 Simple Steps
- Understand how the test is marked. Knowing the marking criteria is the best way of giving the examiner exactly what they need and nothing else.
- Decide whether the letter is formal or informal. This part is easy. If the question asks you to write to a ‘friend’, it should be an informal letter. If the question asks you to write to anyone else, it should be a formal letter. It is that simple!
- Discuss each bullet point from the question. Make sure to take a new paragraph for each bullet point. This will make your letter easy to read and understand.
- Sign off your letter. Don’t overcomplicate this part. Include a sign-off suitable to your letter’s tone and write your name beneath.
- Check your work. Make sure your letter doesn’t contain any grammar or vocabulary mistakes.
- Letter Writing Tips
- How to Write an Informal Letter
- How to Write a Formal Letter
General Training Essential Writing Task 1 Skills
- Task 1 General Training Writing Strategy
- Task 1 General Training Writing Guide
Sample Answers
- Formal and informal sample letters.
Writing Task 1 Essential Information
- People doing the Academic test will write a report on a data set, map, or process. People doing General Training will write a letter.
- You must write 150 words or more.
- You should spend around 20 minutes on this part of the test.
- Task 1 is worth 1/3 of your total mark on the Writing test.
- You will be assessed in four areas: Task Achievement (25%) Coherence and Cohesion (25%) Lexical Resource (25%) Grammatical Range and Accuracy (25%)
- The most important thing is that you can demonstrate that you can clearly communicate in English.
- The key to doing well is to know exactly what the examiners want and give it to them.
- Grammar and Vocabulary Guide

- Top 10 Grammar Mistakes
IELTS Writing Task 1 FAQs
How can i improve my writing.
You will find all the resources you need on our Writing Task 1 page. Click the link below:
Writing Task 1
If you need serious help or personalised feedback, you should check out our online course. There is a waiting list, but you can add your name here:
How can I get a Band 7, 8 or 9?
The answer to this question is different for every individual IELTS student, as it depends on a number of factors, including your work ethic, English skills and exam strategy. You'll find a guide to answering this question in this article
If you need serious help with improving your IELTS scores, you should check out our online writing course. There is a waiting list, but you can add your name by clicking the link below:
Can you correct my writing?
Please click the link below and it will give you all the information you need about our writing correction service:
Writing Correction Service
Do you have any sample answers?
Yes, you will find them at the link below:
Task 1 Sample Answers
Will using 'high level' or 'academic' words help me improve my score?
Probably not.
Read my recent article about IELTS vocabulary here:
5 Things You Need to Know about IELTS Vocabulary
How many paragraphs should I write?
Introduction
You can put the overview at the end if you'd like.
Can I use idioms?
No, you should typically avoid using idioms in Writing Task 1.
The only time this is acceptable is if you are taking the General Training test and must write an informal letter.
Should I write a conclusion for Task 1 Academic?
No. A conclusion is a summary of YOUR ideas and your opinion. Task 1 is simply reporting what you see, so there shouldn't be any of your ideas or your opinion.
Instead of a conclusion, you should write an overview.
The reason lots of people get confused about this is that some teachers, books and even one British Council website call the overview a 'conclusion'. It's not a conclusion, it's an overview.
Finally, it does not matter where you put the overview paragraph. We teach our students to put it after the introduction, but it is also fine to have it as your final paragraph.
How many words should I write?
You must write at least 150 words in Writing Task 1 (yes, the examiners will count them!)
I would suggest that you aim to write around 160-170 words for Task 1. Aiming for 20-30 words more than the required amount makes you more likely to reach the word limit without setting an unrealistic goal.
Will I lose marks if I don't write enough words?
Yes. If you don't write the required number of words, you will lose marks in 'Task Achievement' for not answering the question fully. Read more here .
Can I use contractions?
No, should not use contractions when you are writing an academic essay or formal letter. However, it is fine to use contractions in an informal letter.
When should I write formally?
There are a few signposts that indicate when you should write formally or informally. Watch our video lesson to find out what they are:
IELTS Writing Task 1 General Training: Formal or Informal Letters?
Latest IELTS Writing Task 1 2024 (Graphs, Charts, Maps, Processes)
by Dave | Sample Answers | 147 Comments

These are the most recent/latest IELTS Writing Task 1 Task topics and questions starting in 2019, 2020, 2021, 2022, 2023, and continuing into 2024.
You can find all the most recent IELTS writing task 2s here and the general training questions here .
I also have recorded all the IELTS speaking questions here .
Learn here about how to write an IELTS general overview for task 1.
If you are able, please consider supporting my efforts (and receiving exclusive IELTS Ebooks!) by signing up for my Patreon here .
Enjoy and comment any questions/writing that you have!
Read my sample for the process below here.
Read my sample for the pie chart below here.

Read my sample answer for the map below here.

Read my sample answer for the Cambridge 19 line chart below here.

Read my sample for the line chart below here.
Read my sample answer for the chart below here.
Read my sample for the table below here.
Reported on IELTS November 27th
Read my sample for the bar chart below here.
Reported on IELTS November 5th

Read about the line chart below here.

Read about the pie charts below here.

Read about the chart below here.

Read about the bar chat below here.
Read about the map below here.
Read about map below here.
Read my essay for the bar chart below here.
Read my essay for the charts below here.

Read my essay for the line chart below here.

Read my essay for the table below here.

Read my essay for pie charts below here.

Read my essay for the process below here.
Read my essay for the map below here.

Read my essay here.

Read my essay or the process below here.

Read my sample answer for the bar chart below here.

Read my essay about this line chart here.
Read about this map here.

Read my essay for the bar chart and pie chart below here.

Read my essay for the combined pie chart and table below here.

Read my sample for the pie charts below here.

Read my sample for the chart below here.

Read my answer for the chart below here.

Read my answer here .

Read my sample answer for the table below here.

Read my sample answer for this process here.

Read my sample answer for this chart here.
Read my sample answer for the process below here.
Read my sample answer here.
Read my sample for this bar chart here.

Read my sample answer for this line chart here.

Read my sample answer for the floor plan below:

Read my sample answer for the new bar chart below here.

Read my sample answer for this table here.

Read my sample answer for this mine map below:

My Ebook for this (really difficult!) chart is only available on Patreon.

Read my sample answer for this question here.

Check with my sample answer here.

Read my sample answer for this (unusual) task 1 here.

Read my sample answer for this topic here.
The bar graph shows the total manufacturing production in percentages Asia, Europe, and the rest of the world.

| 10.3 | 11.6 | 13% | |
| 7.9 | 12.7 | 61% | |
| 6 | 5 | -17% | |
| 5.5 | 4 | -27% | |
| 2.3 | 5.1 | 122% | |
Read my sample answer for the floorplan below here.

| in 2009 | in 2010 | % Change | |
| France | 76 | 76 | 0 |
| USA | 66 | 67 | 1.5 |
| Spain | 55 | 56 | 1.8 |
| UK | 55 | 57 | 3.6 |
| Italy | 44 | 45 | 2.3 |
| Turkey | 32 | 46 | 33 |
| China | 22 | 34 | 55 |
| Germany | 10 | 24 | 109 |
| Hong Kong | 10 | 9 | -11 |

I want to make some simple suggestions for how you can use these recent graphs to practice.
To be honest, students get too obsessed with the most recent questions.
You can practice with a question from years ago and a question from yesterday – it makes absolutely no difference.
What makes an actual difference is how you study.
Here is what I recommend:
- Practice writing about a graph in 20 minutes, in test conditions.
- This is your ability. Now, check it by underlining the vocabulary, grammar, data. Are there many grammar mistakes? Do you use the same words over and over? Do you include all the data?
- Now that you know your weaknesses, you can also sign up to have them marked by me here .
- Write about another one focusing on your mistakes. Don’t worry about timing. Take as long as you need to make it perfect.
- Repeat this process over and over until your start to notice your writing improving.
Hope that works for everyone!
Recommended For You

Recent IELTS Writing Topics and Questions 2024
by Dave | Sample Answers | 342 Comments
Read here all the newest IELTS questions and topics from 2024 and previous years with sample answers/essays. Be sure to check out my ...

These are the most recent/latest IELTS Writing Task 1 Task topics and questions starting in 2019, 2020, 2021, 2022, 2023, and continuing into 2024. ...

Find my Newest IELTS Post Here – Updated Daily!
by Dave | IELTS FAQ | 18 Comments

Recent IELTS Speaking Topics and Questions 2024
by Dave | Model Answers | 74 Comments
These are IELTS speaking topics and questions in 2024 - if you want the current reported ones on IELTS, you can find them here. ...

New IELTS General Training Writing Topics and Questions 2024
by Dave | General Training | 93 Comments
Enjoy all the newest IELTS questions and topics from 2024 for the general training exam - as well as ones from past years that may come ...
Submit a Comment Cancel reply
You must be logged in to post a comment.
147 Comments

The bar graphs compare the rate of girls and boys between 5-14 years old who were engaged in cultural activites and sports in Australia in the year 2003. Overall, dancing was by far the most practiced activity among girls and the least for boys. Although practicing a sport was quite popular for both gender, it was noticeable higher for male children.
To begin, dancing was the most coveted spare activity for girls, a stunning 25% of them practicing it that year, whilst roughly 3% of boys did it. Playing a musical instrument, on the other hand, attracted a 15% and 10% of boys and girls, respectively, becoming the most popular for male children and adolescents. Drama and singing shared a similar rate, around 5% of all children were enganged in such programs, standing up as the least practiced, with the exception of dancing among boys.
With respect to sports, as expected, the proportion was by far higher for boys than for girls, 70% and 50%, respectively. In comparison with cultural activities, practicing sports definitively was the most predominat type of recreational activity among all children.

Great work! Your overview is clear enough for band 7+! Some small corrections ‘both genders, most common spare time, of boys participated, attrached 15%, being the most, being the least practiced, (take out the as expected bc it is too close to opinion)’
Merci beaucoup! I did not expect an answer, I just was practicing my ability to write a decent report in less than 20mnts. Thanks so much for your feedback, it is of great help. I’m using your site for self-preparation. Your explanations are clear, straightforward and appropriate. Hopefully, with your help (website, videos, blogs), I will hit my desired score. Great day! God bless you!
You’re welcome! What is your desired score? I can give you some more detailed feedback to help you get there…
I’m chasing a 7 in each skill.
You are close! Be careful with prepositions, make sure that your language isn’t too informal and small mistakes with grammar (infinitives, irregular past simple) might bring down your grammar score.
The given maps depict the changes that had taken place on a museum over a 60-year period, starting in 1957 to 2007. Overall, the museum grew in size and the majority of trees were removed in favor of that.
In 1957, there were a bunch of pine trees along the road and also on the museum’s surroundings. The museum facilities were made up just by a storeroom, a local history room and a national exhibition on the top center. Likewise, a straightforward path from the road leaded to the entrance hall.
By 2007, the museum witnessed several striking changes. Firstly, to built up a spacious car park, the path was bricked down and all the trees on the bottom (left-right) were cut down. Secondly, the building itself was enlarged on the north, and a completely new room was erected on the bottom left corner side, where the shop and main entrance were attached. With the exception of local history room , which was relocated on the center, the storeroom and national exhibition were eliminated. These changes allowed the introduction of a reception and cafe on the southern area, and a special exhibition and education center rooms on the north. Finally, the garden was the only element that remained untouched.
Good work again! Some corrections: The given maps depict the changes that took place in a museum over a 60-year period, starting in 1957 and ending in 2007. Overall, the museum grew in size allwoing for more customer focused shops and the majority of trees were removed.
In 1957, there was a grouping of pine trees along the road and also on the museum’s perimeter . The museum facilities were made up of just a storeroom, a local history room and a national exhibition on the top center. Likewise, a straightforward path from the road led to the entrance hall.
By 2007, the museum witnessed several striking changes. Firstly, to erect a spacious car park, the path was removed and all the trees on the bottom (left-right) were cut down. Secondly, the building itself was enlarged on the northern side , and a completely new room was erected in the bottom left corner, where the shop and main entrance are not located . Although the local history room was relocated to the center, the storeroom and national exhibition were eliminated. These changes allowed for the introduction of a reception and cafe on the southern area, and a special exhibition and education center rooms in the north. Finally, the garden was the only element that remained untouched.
Merci beaucoup monsieur! You’re right, after sending my draft I realized I had made quite a few grammar mistakes. To be honest, I always fight against preposition, specially those indicating “place”. I cannot identify when I need to use: IN, ON, TO when it comes to giving directions. As you can see: I used “on the north” instead “in the north” , or use the adjective “northern” without a noun. Please, suggest us a good grammar book to follow . Salut!
Sometimes prepositions are more like vocabulary than grammar. We always say ‘in’ not ‘on’ the north – just something to memorise! You can try this website: https://grammar.yourdictionary.com/parts-of-speech/prepositions/rules-for-prepositions.html
I also suggest keeping a list from my sample answers of the correct prepositions and using the list when you practice until you feel you have memorised them and no longer need the list. Good luck!
The given bar graph illustrates the levels of water in reservoirs in five Australia’s cities in 2009 and 2010. The data is measured in percentages.
Overall, the levels of water witnessed a significant decrease in city A, B and D, whilst city C and F showed a slight rise throughout the period.
In 2009, cities B, C, D and E shared a similar water levels around 70%. By contrast, city A stood out as that with the lowest levels at 50% and city F showed the highest ones at just above 80%.
With the exception of city E, which remained the same at 80%, all cities’ water reservoirs experienced changed by 2010. City C and F levels went up to just above 82% and approximately 99%, respectively. On the other hand, city D levels went down significantly from almost 70% to approximately 52%. The same occurred to city A and B, whose water rates dropped nearly 20%
Nice job again! The most important part is to be sure that you give some kind of overall ranking in terms of your overview as well.
Here are some small edits: “The given bar graph illustrates the levels of water in reservoirs in five of Australia’s cities in 2009 and 2010 in percentages . Overall, water levels witnessed a significant decrease in city A, B and D, whilst city C and F showed a slight rise throughout the period. City F had the highest water levels throughout while City A was consistently the lowest.
In 2009, cities B, C, D and E shared similar water levels at around 70%. By contrast, city A stood out as that with the lowest levels at 50% and city F showed the highest ones at just above 80%.
With the exception of city E, which remained the same at 80%, all cities’ water reservoirs experienced changes by 2010. City C and F levels went up to just above 82% and approximately 99%, respectively. On the other hand, city D levels went down significantly from almost 70% to approximately 52%. The same occurred to city A and B, whose water rates dropped nearly 20% a piece.
Thanks so much for your helpful feedback. I will soon sit the test, hopefully I will hit a high score.
I really hope you do well on it! Be sure to write me a message to let me know how it turned out!

The rendered bar graph illustrates the information about the organisation A-E those spent billions of euros on machinery , building,staff training and research section. One glance is enough to say that maximum euros was spent on staff training while the minimum euros was spent on research activity. It is evident from the graph that organization A was spent 1 billion euros on machinery . This value increased substantially at 16 billion euros by organization c then organization D and E invest less euros on machinery and it was reached at approximately 0.8 billion euros. Moreover ,on building had been spent 1.3 billion euros by organization A and there was non-noticeable decrease on building almost 1.4 billion erros by organization B . After that organization C,D and E had spent equal amount that is 1 billion euros on building area. Moving further, staff training was invested the highest amount that is 1.9 billion euros by organization B. There after , this value was declined by organization C ,D and E. However, organization B had invested nearly 1.6 billion euros on research section whereas , organization D and E was spent least amount on research area that is 0.7 billion euros.
Great work Navneet!
Some corrections:
The rendered bar graph illustrates information about organisations’ A-E spending in euros on machinery , building,staff training and research . One glance is enough to say that maximum euros was spent on staff training while the minimum euros was spent on research activity. (That phrase is too informal – better to say ‘Overall’, your overview must also touch on all areas and have a little more detail to get at least band 6 for task achievement.)
It is evident from the graph that organization A was spent 1 billion euros on machinery . This value increased substantially at 16 billion euros by organization c then organization D and E invest less euros on machinery and it was reached at approximately 0.8 billion euros. Moreover ,on building had been spent 1.3 billion euros by organization A and there was non-noticeable decrease on building almost 1.4 billion erros by organization B . After that organization C,D and E had spent equal amount that is 1 billion euros on building area. (This graph does not show increase or decrease over time. It just shows 1 time period so try to compare the data and forget about it going up or down.)
Moving further, staff training was invested the highest amount that is 1.9 billion euros by organization B. There after , this value was declined by organization C ,D and E. However, organization B had invested nearly 1.6 billion euros on research section whereas , organization D and E was spent least amount on research area that is 0.7 billion euros. (Good working describing most of the data but remember to compare for this type of graph, not show increase/decrease.)
Read more about graphs with no change over time here: https://howtodoielts.com/ielts-writing-task-1-analyse-tables-not-over-time/

Sir, can u check my sentence formation in this task because if i realize my mistakes then i will continue this….
The rendered bar garaph illustrates the information about the percentage of women age in Australia since they gave birth to their first child in 1966,1985and 2006. Overall,the maximum percentage of women was observed in younger age while ,the minimum percentage was calculated at older age in the whole period. It is vivid from the graph that 19 and under aged women gaved the birth of 33%of chlid in 1956 wheras, this percentage decreased to 25% and 18% in 1986 and 2006 respectively.
Overall,the maximum percentage of women observed were younger age while the minimum percentage was calculated at older ages over the whole period. It can be seen in the graph that… gave birth to…
Good start!
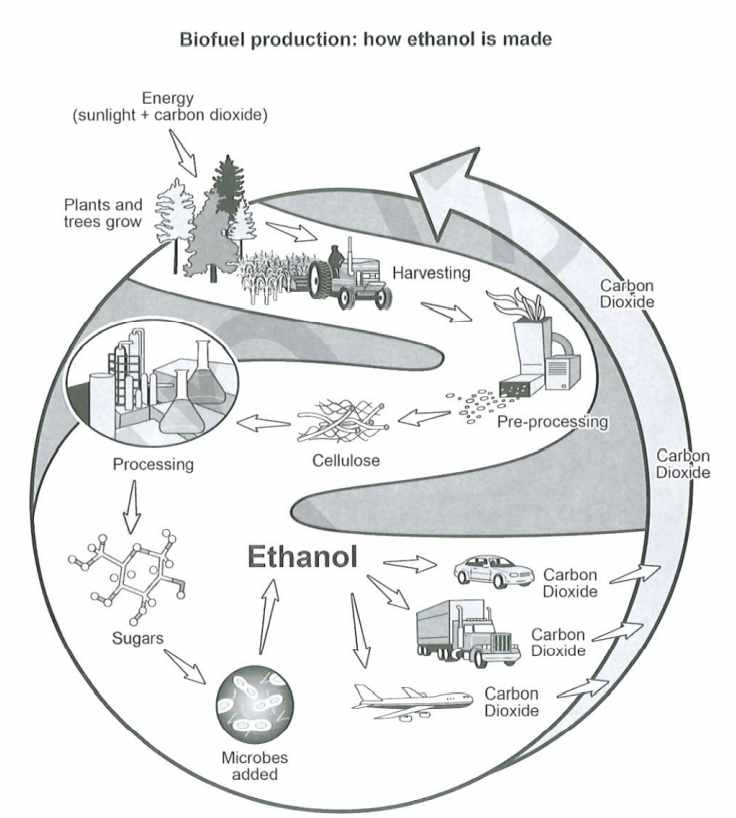
The given diagram illustrates the process, and its different steps, to produce ethanol fuel from raw corn. Overall, there are eight stages involved in the production of this renewable fuel, starting with corn storing and ending with its transportation to the public market.
First, the process initiate with having enough raw material (corn) for the ethanol production purpose. This corn is stored for a while, then it is milled profusely. Without delay, the milled corn is immediately mixed with water, to be then cooked it for exactly four hours. Shortly after, it is kept sealed in containers for up to 48 hours, allowing it ferments sufficiently.
Once the fermetation have finished, the liquid and the solid by-product are neatly separated, and the former undergone a purified procedure for five long hours. The ending product is purified ethanol, which is stored for an undefined time. Finally, the ethanol fuel is ready to be transported to its different destinations.
Good work again! Some correctins: ‘The given diagram illustrates the process, and its different steps, to produce ethanol fuel from raw corn. Overall, there are eight stages involved in the production of this renewable fuel (don’t need to include the number of steps in your overview), starting with corn storage and ending with its transportation to the public market.
First, the process initiates with having enough raw material (corn) for the ethanol production. This corn is stored for a while then it is milled before being mixed with water, to be then cooked it for exactly four hours. Shortly after, it is kept sealed in containers for up to 48 hours, allowing it ferments sufficiently.
Once the fermetation has finished, the liquid and the solid by-product are neatly separated and the former undergoes a purified procedure for five long hours. The ending product is purified ethanol, which is stored for an undefined amount of time. Finally, the ethanol fuel is ready to be transported to its different destinations.
A couple things: stay away from opinion/speculation like profusely, immediately, etc.
For your overview, try to group and define the stages – don’t need to say the number of stages.

The graph illustrates the percentage of women in different age groups in years 1966, 1986 and 2006. The first age group of 19 and under was the highest in year 1966 at 35% and the lowest in year 2006 at 15%. In year 1966, the percentage of women who were 20-24 years old was 60%, which is more than both in 1986 and 2006. The age group of 25-30 years was 50% in 1986 and it was higher than both 1966 and 2006. The percentage of women in the age of 30-34 years has been increasing steadily since 1966. It was 15% in 1966, 20% in 1986 and 45% in 2006. Its rise is opposite to 20-24 age group, which declined between 1966 and 2006. Another age group that has been on the rise is the 34-39 years, as it was 5% in 1966, 15% in 1986 and 30% in 2006. Both age groups of age 30-34 and 34-39 have grown in percentage between 1966 and 2006. The last group of women aged 40 and above has remained the lowest among all the age groups.
Well done! Some corrections:
Your grammar is very accurage but it is a little mechanical because you don’t compare and most importantly there is no general overview so your maximum score is band 5 for task achievement even though all the data is accurate!
https://howtodoielts.com/ielts-writing-task1-band-7-overview/

Hi Dave, thank you so much for your feedback man!! I gave the test and got a 7 on written, and 8 overall. thank you so much for you help 🙂 have a great year ahead!! lovepreet
Thanks for letting my know – congrats on your score!

The given bar graphs depict the proportion of 5-14 males and females’ age group joined the cultural activities and sport in Australia in the year 2003. Overall, it is clear that most boys were more athletic and played a musical instrument, while girls were fond of dancing than boys. Boys were more attracted to a sporting event, at 70%, while the figure for girls who participate was just above 50%. However, when it comes to cultural activities, female dancers recorded the highest percentage in the graph at 25%, compared to a marginal number of males at just 3%. Almost identical figures for both genders can be seen in singing and drama with only 5% of them participated in these categories. Playing a musical instrument is the category that the same genders had the interest to do. Most participants came from a group of boys at 15%, compared to just 10% for girls.
Thanks for commenting!
Here are some corrections:
The given bar graphs depict the proportion of 5-14 males and females’ age group joining cultural activities and sport in Australia in the year 2003. Overall, it is clear that most boys were more athletic and played a musical instrument, while girls were fond of dancing than boys. Boys were more attracted to a sporting events, at 70%, while the figure for girls who participated was just above 50%. However, when it comes to cultural activities, female dancers recorded the highest percentage in the graph at 25%, compared to a marginal number of males at just 3%. Almost identical figures for both genders can be seen in singing and drama with only 5% of them participated in these categories. Playing a musical instrument is a category that interested both genders. Most participants came from a group of boys at 15%, compared to just 10% for girls.
Good work! Did you mention all areas on the graphs in your overview?
Yes, I mentioned it all. Sorry, this is my first time practicing a timed task. What would be my possible score if you will base in my answer? Thanks!
Your score is in the band 6.5/7 range in terms of language ability. What score are you going for on the exam?
My target is above 6.5 in writing. Hoping that I can achieve that band score. Thank you!
Keep up the hard work!
The diagram reveals the way of producing ethanol fuel from corn. Overall, it is clear that there are eight stages in the process, beginning with the corn harvest, fermentation and transition of corn into a liquid, to the transportation of the product made.
In the first stage of making purified ethanol is storing the corn before it undergoes milling. The milled corn is then added by water and cooked for 4 hours. After that stage, corn will be fermented for 48 hours. Separation of solid to liquid is the next step. While the solid by-product is not needed after the transition process, the melted corn is then kept.
In the subsequent stage, the melted corn product goes through a purification process. This process takes 5 hours to be able to produce purified ethanol. Storing of the made ethanol fuel product is the next step. Finally, ethanol fuel is transported to its destination.
Good overview Jessica!
Really good accuracy with your passive verbs – you are well within your target band scores range!
Thank you so much! Im a bit confused if what kind of tense should I use in diagram task?
For a diagram it should be mainly in the present and present passive, maybe some present perfect!

The bar graph give information on percentage of water level in reservoirs in six different Australian cities in October 2019 and 2010. Overall, the greatest water level always was in city B and city F and increased , moderate for for city B and city D where decreased and for city E, where remainded the same, while the lowest for city A where decreased over the year. Water level in city F and city C in 2009 was at 90% and 80% respectively and grew for both by 10% in 2010. On the second position in case of resevoired water in 2009 was city B and city D with the figure of 80% which diminished to 65% and 50% respectively in 2010. Although water level of city E was similar in 2009 to those of in city B and city D, it remained on the same level in 2010. The modest water level was in city A. For this city we can spot a drop from 60% in 2009 to 45% in 2010.
Well written, Iza!
Be careful with helping verbs. You don’t need to say ‘was increased’ just ‘increased’
Good work describing the full trend for your overview!
You need clearer paragraphs though – take a look here to see some examples: https://howtodoielts.com/category/writing-task-1/academic/
Keep working hard!

Hii Dave.. I really want your possible score on this writing task 1..
Hi Saini/Iza, this essay is in the band 5 range at the moment.

But do you think it deserves 7 band?
The given bar graph illustrates that in the year 2003,the proportion of Australian boys and girls aged 5-14 participates in cultural as well as sports activity.. Overview the dancing activity was most favorable cultural activity shown by girls in comparison to boys.. The boys preferred more sports, although it was quite popular in both the gender…. To begin with, it can be clearly seen that, the percentage showed big difference in dancing activity, which was 25% girls participate in it, whereas there was less than 5% boys in same activity.. By contrast, the proportion of boys were 70% in sport which was highest rates… Probing further, the drama as well as singing activity received the similar percentage 5% by both the gender in the year 2003, respectively.. Moreover, in the play musical instrument ,one in ten girls participated which was 5% inclined by boys in the Australian… Thanks.. Dave I really want your response on this
Good work Saini!
Try copying some expressions from my sample answers more closely such as ‘Overall,’ instead of ‘overview.’
Don’t use … – that is too informal. Just use a period.
You are experimenting with a lot of new grammar and vocabulary which is good but you need to focus more on accuracy as it is quite hard to understand at times. Keep it up!

Thank you for your response.. What score I can get according to you on this task 1
This answer is i nthe band 5 range at the moment.
The table shows the details of five different kinds of vehicles registered in Australia in the years 2010, 2012 and 2014. Overall, it is clear that all types of vehicles increased in percentile over the given period in which the percentage for motorcycles had jumped most. It could be noticed also that passenger vehicles got the highest numbers while light trucks were the lowest.
A glance at the graph reveals passenger vehicles started from 11,800,000 units in 2010, rose almost a million over 2 years, then climbed to 13,000,000 in 2014, accounting for 10.2% over the period. Similarly, commercial vehicles uplifted to 17.4% from 2010 to 2014. In the first year, 2,300,000 were recorded, increased to 2,600,000 in 2012, before reaching 2,700,000 in 2014.
A most striking positive change can be seen in the proportion of motorcycles which is 30.8%. It started from 540,000 registered motorcycles in 2010 then rose dramatically to 680,000 and 709,000 in 2012 and 2014 respectively. Meanwhile, an almost identical positive trend can be seen in the numbers of heavy and light trucks. A marginal upward movement from 384,000 to 416,000 at 8.3% over 4 years for heavy trucks can be considered while a significant escalation at 23.5% is remarkable in the number of light trucks.
given period and the, motorcycles jumped the most, it can also be seen that, had the, commercial vehices grew to, increating to 2,600,000, can be observed while
Keep it up!

The bar chart provides data on the water levels of reservoirs in six Australian cities from 2009 to 2010. Overall, city F recorded the overall highest levels, closely followed by city C and E, while the percentages of city A were the lowest in both Octobers. some cities, such as F and C recorded higher water levels in 2010 compared to 2009, whereas the remaining cities showed a reversed pattern except city E with both numbers leveling up.
Looking in more details, city F stood at 90 per cent in Oct, 2009 and climbed to nearly 100% in 2010, which was the highest among all. Likewise, city C experienced a considerable growth from just over 80 per cent to approximately 91% in the next year. In contrast, city B and D showed a decline in water levels, from identically 80% to around 62% and 50% respectively. Figures of city A also dropped considerably from 60% to about 45% by 2010. The water level of city E was just above four fifths in 2009, and this number remained unchanged in the following year. (180 words)
Really nice writing again, Jing!

The chart presents data on the percentages of Australian children aged between 5 to 14 who join cultural activities and sports in 2003. Overall, sport was way more popular than cultural activities for both genders, while boys were more active than girls. A Lot less children participated cultural activities though the number of girls who danced stood out. Except for those who play musical instrument, the remaining culture activities only attracted a minimal amount of children. Looking in more details, over half of female students joined sports, however the percentage of active boys was even higher at as much as 70%. Likewise, there were more boys who played musical instrument than girls, at 25% and 10% respectively. In contrast, Dancing was substantially more popular within girls, attracting a quarter of females compared to merely approximately 3% of males. Besides, both boys and girls showed least interest in drama and singing with only 5% in turn of either gender group did those activities. (162 words)
Good work Jing!
Be careful with your tenses, prepositions and fixed expresssions: Looking in more detail…

The line chart compares the priced of fresh fruits and vegetable, sugar and sweets as well as carbonated drink from 1979 to 2009. Overall, even though all categories started off at broadly identical prices, the growth in fresh fruits and vegetables overweighed consumer-price index by a massive margin, while the rest displayed a much slower upward trend. Looking in more details, sugar and sweets closely following consumer-price index, showed a slow yet steady growth throughout the thirty-year period. The price of soft drinks, however, remained stable after a surge in 1984 at around 115 until 1999, when the price rose again slowly. In contrast, there was a substantial growth in the price of fresh fruits and vegetables over the given period, which, despite a dip to about 90 in 1984 and some fluctuations, rose significantly from just above 50 in 1979 to nearly 350 by 2009. In fact, the price only levelled out temporarily between 1990 and 1992 and again from 2000 to 2001. (164 words)
drinks, outweiged, followed, showing, inclue more data in the second paragraph!, levelled off

The line graph provides information on the number of middle-aged citizens in three countries over a 50-year period between 1950 to 2000. Looking from an overall perspective, this particular age group had grown at a broadly comparable pace in China and India, with Chinese midyear crowd continuously outnumbering that of the India’s, while the midyear population in USA also increased, but by a comparatively small margin over the years. Looking in more details, Chinese mid-aged population started off the highest among three countries at just below 600 million in 1950, which outnumbered that of India by about 200 million, and USA by 400 million. Despite a short period of stability at approximately 620 million from 1960 to 1965, the number of China surged as rapidly as India’s. By the end of the period, the figures of China and India had reached 1200 million and 1000 million respectively. The increase of the US mid-agers, on the other hand, was relatively gentle. By 2000, the number of USA had risen slightly to only about 280 million, which was almost lower than the leading country’s by 1000 million. (185 words)
You tend to overuse past perfect when you could just use past simple: grew
You use it correctly in your last sentence though!
Smaller margin, among the, numbers for China, US middle-aged residents

dear admin i would like to express my great appreciation for your hard work in collecting and answering all these samples, good job! i found your sample answers highly useful as well as being professional. please proceed with your work in assembling the latest task 1 questions.
Thanks so much, Homa – I really appreciate that!
I wish I could publish the task 1 essays as regularly but it is much harder for students to remember the graphs from the exam.
But I will continue to publish any task 1s that I get reports on!

Thank you very much for your efforts and your time to help all the students who are preparing themselves for the IELTS. I do really appreciate that. I’ve just started preparing myself for the IELTS exam and this is my first writing attempt.
The graphs illustrate the rate of boys and girls who participated in organized sports and cultural activities aged 5-14 in 2003 in Australia.
Overall, girls participation showed an upward trend in the cultural activities,while boys showed a dwonward in many activities. Both boys and girls participation experienced some fluctuations in both activities, although boys had initially a lower participation percentage, but they outraced girls in the end.
Boys rate was less than 5 percent in drama activities which was so close to girls rate, then it kept decreasing to almost 3 percent in Dancing activities which is the lowest rate of all activities. the rate showed a gradual increase in singing activities by approximately 2 percent, and it showed a significant raise to 15 percent in playing musical instrument. Eventually boys outraced girls in sports activities hitting a high-point of 70 percent, which is the highest perentage of all the period.
percentage of girls who participated in drama was as low as the percentage of girls who participated in singing activities, then the rate showed a significant increase of 25 percent in dancing activities, it decreased by 15 percent in play musical instrument. and it kept increasing to almost 52 percent in sports activities which is the highest percentage of all acitivities.
Thanks for saying that Madjid!
Careful of some informal words like outraced and try to be a little more accurate: significant rise, musical instruments, which was, etc.
Some simple mistakes but a great first effort!
Your overview is good too – keep working hard!
The bar graph compares the proportion of people living in households in the UK between 1981 and 2001. Overall, it is clear that households consisting of more people deteriorated while homes with fewer persons increased. The percentages for the two middle groups oppositely changed by the same margin.
A glance at the graph reveals that proportions for 1 and 2 people households both escalated by 3%, at 26% and 36% in 2001 respectively. These figures were the highest over the given period. An identical trend can be seen in the percentage of 4 people houses, it jumped from 12% to 15%.
On the other hand, the proportion of houses with 6 or more people plummeted from 6% to 2%, and 5-people homes percentage just dropped a quarter, from 8% to 6%. These two figures with the lowest percentages in 1981 remained at their place in 2001. Similarly, the figure for 3 people houses also fell by 3% over 20 years.
Well written Jessica!
‘Deteriorated’ has a negative connotation so I wouldn’t use that word.
Really nice linking and comparison in your writing!
The diagram illustrates the filtration process of drinking water in a single town in Australia. Overall, there are four main stages as is presented above, beginning with the rainwater collection, water filtration and treatment, to the distribution of drinking water to households. The entire process is controlled by the plumbing system.
In the first stage, rainwater is collected through roof gutters and downspouts of townhouses. The gathered water undergoes filtration through the pipe before being deposited in the storage tank.
In the subsequent stage, water from the storage tank then transferred by a pipe to the water treatment tank. At this stage, the removal of contaminants is being done by placing chemicals in the water treatment tank. After the purification process, the potable water is then finally distributed to townhouses. And, the treated water is regulated by faucets in every household and is now safe to drink.
Well written!
Really nice overview – it should be band 7+ for task achievement.
Careful with your singular/plural – through the pipes.
And your helping verbs: is then transferred…
The maps illustrate the development of a museum between 1957 and 2007. Looking from the overall perspective, it is clear that significant changes had been made over the period. The most noticeable improvements were the size of the building which had been expanded and a car park which was created.
In 1957, there was a pathway from the main road to the museum. The entire building of the museum had only four parts, beginning with the entrance hall, local history room, museum store-room, and the national history exhibition. The garden was located in the northwest. Also, several trees were planted along the road and surrounding the building.
Over 50 years, a major transformation could be seen on the map. The pathway connecting the road and the museum was demolished, and trees in front of the building were cleared to make way for a car park. A number of trees circling the museum also removed for its expansion. Rooms in the building had been removed except for the local history room. Cafe, museum shop, reception, special exhibitions, and education center section were added. However, the garden in the northwest remains unchanged.
Good job Jessica!
from an overall… were made… which was expanded
Careful confusing past perfect, present perfect and past simple in your answers!

The Chat Represent the survey regarding people’s coffee and tea buying and drinking habits in five Australian cities.
The bar chart shows drinking habits in 5 Australian cities as a relate to coffee and tea on the last 4 weeks .Overall,the half population in all cities except Adelaide went to a cafe for coffee or tea, while buying coffee was also popular and buying fresh coffee generally less normal.
See, first of all at going to cafes,it was more merits of Melbourne and Hobart at 64% and after that 63%.Sydney was comparably high over 60%, followed by Brisbane at over 55%, and Adelaide at under 50%.Further more the Hobart, instant coffee purchases at 54%, Brisbane at 52%, Melbourne at 48% and lastly Sydney just over 45%.
So, the last i sum up according to all information,fresh coffee was below 45% for all cities and basically Sydney 44% and Melbourne 42%, Hobart was next at 39%,Adelaide and Brisbane were much lower ratio produced .
Good Nisha!
as they relate to… over the last … less common … Looking first of all at cafes… higher at over… Furthermore… at just over
Good but be careful with your accuracy!

The table illustrates the percentage of tourist visited in 9 countries between 2009 and 2010. Overall, it can be seen that the amount of visitors visit in France and USA stand out the most in both years and both Hong Kong and Germany are more than 100 percent.
According to the data the number of visitors in France remain the same by 76% while both USA and Spain has a slightly change by less than 2 percent. As for UK and Italy has a small change by less than 4 percent in both years.
However, both Turkey and China has a considerable change by less than 60 percent but more than 30 percent which cause them to rank the sixth and seventh out of nine countries. While, Germany has a huge change by more than 109 percent of visitors but Hong Kong was the lowest visitors by 10 percent in 2009 and in 2010 it
Great work Jane!
You should mention all categories in the overview (at least partially) to get above band 5 for TA.
Careful with your tense!

The pie chart below reveals the types of works do Anthropology graduates did after finishing their undergraduate course and the table records the salaries of Anthropology graduates for 5 years of work. It can be seen that most graduate students work as a full time and follow by part time workers unemployed full time postgrad study not known workers and part time with postgrad studies. Also the average of salaries of Freelance consultants is much higher than Government sector and Private companies.
Most graduate students were working as full time workers by more than half percent, follow by part time workers by 1\5 of the students and for the unemployed are less than a quarter just 12%. While, both full-time postgrad study and unknown workers have 8% of students. As for students occupation as past time with postgrad study has 5% of them.
However we can see that from $25000-49999 and $50000-74999 private company pay scale was the highest by 10% and 35%. While, government sector pay scale was the highest with the amount of $100000+ by 50%.
Another good one Jane – a really tricky one to do the overview for so I wouldn’t worry too much about this one.
Be careful with plurals, tense, and subordinate clauses/linking words.
The graph below illustrates the number of tourists visiting Caribbean island as well for visitors staying on cruise ships staying on island and total number of visitors between 2010 and 2017. Overall, it can be seen that total visitors rose considerably follow by visitors staying on island and overtaken visitors staying on cruise ships.
Visitors staying on island remained the same from 210 to 2011 by 1.75 millions of visitors and it rose particularly in 2011 to 2013 and it remained the same for the next 2 years by 1.5 millions of visitors. It fluctuated between 2015 and 2017 by 1.5 millions of visitors. While number of visitors staying on cruise ships fluctuated between 2010 and 2013 by 0.25 to 0.5 million visitors. Then, it rose considerably for the next 5 years and reached its peak by 2 million visitors.
However, the number of total visitors from 2010 until 2015 rose significantly and it had not change in 2015 and 2016 but it reach it peaked by 3.5 million visitors by 2017.
Keep up the hard work with all these graphs, Jane!
Good overview for this one and better accuracy with your tense and grammar.

You’re welcome!

The graphs below illustrate the proportion of people who are smoker and consumer of alcohol in the USA, JAPAN, TURKEY and HOLLAND from 1960 to 2000. Overall, it can be seen, USA people had a substantial percentage in smoker and utilizing of alcohol during the specific years. At first graph, the USA in 1960 60 percent of people were smoker and this amount had remained unchanged until 1970 whereas, in 1980 its number had noticeably declined to 46 percent and finally this flow stayed at 40% in 2000. Also, in JAPAN we are witnessed gradual decrease around 10 percent from 1960 to 2000 which same as the USA had stopped at 40%. On the other side, in the second graph, there is a wide difference in TURKEY and two other countries. In HOLLAND in 1960 per person only drank 4 litres and this number had remarkably soared to 11 litres in 1980 and to 2000 had a slight drop to 11 litres. By contrast, in TURKEY at 1960 per person had consumed only1 litre and this line moved upward to 2 litres in 2000.
Great Mahsid!
There is some informality in your writing but otherwise easy to follow!

Thanks Dave for the study material.
You’re very welcome!

sorry, are these below corrections done for free?
The comments I post below are free, yes, Sima.
I don’t always have time to give detailed feedback.
You can consider the paid ones here: course.howtodoielts.com/band-scores-corrections

The pie chart above details the usage of water in Australia in 2004 by various sectors, while the bar chart expands on the residential use of water as it is apparent to be the highest compared to rest of the variables. Generally looking, residential houses took more than the half of the pie, this is followed with Industrial, residential apartments and business which are almost sharing similar percentages. On the other hand, the bar chart shows the peak in the bathroom figure and the most decline in the kitchen’s one. To further analyze this into details, the pie chart presents residential houses as the major consumer of water by approximately 60%. Residential apartments come next by almost a quarter (20%). Business and the Industrial groups both have similar portions of the pie by almost 15% each. Water is less used in the Governmental sector by 10%, while other unidentified usage channels take less than 5%. The bar chart dives deeper into residential usage of water. Bathrooms took more than a quarter (26%), while gardens are almost 24%. This is followed by washing cloths 20%, toilets 15% and finally the kitchen 10%.
Sorry for the late reply Aala, I think your essay is strong overall and you describe the data well. Be careful with your special and punctuation though!
hello Mr. Dave, can check my essay on task 1, the last thing uploaded in the comments, I really need your feedback
I’ll try to get around to it tomorrow, Aala!
The pie chart above details the usage of water in Australia in 2004 by various sectors, while the bar chart expands on the residential use of water as it is apparent to be the highest compared to rest of the variables. Generally looking, residential houses took more than half of the pie, this is followed with Industrial, residential apartments and business which are almost sharing similar percentages. On the other hand, the bar chart shows the peak in the bathroom figure and the most decline in the kitchen’s one. To further analyze this into details, the pie chart presents residential houses as the major consumer of water by approximately 60%. Residential apartments come next by almost a quarter (20%). Business and the Industrial groups both have similar portions of the pie by almost 15% each. Water is less used in the Governmental sector by 10%, while other unidentified usage channels took less than 5%. The bar chart dives deeper into the residential usage of water. Bathrooms took slightly less than a third (26%), while gardens are even less by 24%. This is followed with washing cloths 20%, toilets 15% and finally the kitchen 10% only.
Replied on the one above Aala! You can also check here: course.howtodoielts.com/band-scores-corrections

Very good orginized
Thanks, Shakha!

Given are two maps of an unnamed cinema illustrating changes that have been done from 1980 till now. A glance at the figures provided reveals that the number of cinema halls upgraded from two to five being able to screen five different movies simultaneously; also noteworthy is the fact that on the lower-left corner of this place, which used to be a hall number1, a relax room and buffet which star to serve food as well as drinks, are constructed. In the place of the buffet of 1980, in which only drinks could be found, a DVD shop is opened. One particularly interesting fact highlighted by the figure is that in 1980, the cinema was associated with a car park, which is now replaced with two other cinemas. The only similarities that can be found are the places of male and female toilets as well as ticket shop which remains on the right side of the main entrance. Looking from an overall prospect, besides the increased number of cinema halls, not only a relax room and DVD shop are added but also an option of purchasing food as well as drinks are provided.
Well written! That have taken place since – don’t use glance because it is too informal.
The overview is also a bit too specific and careful with tense.

The diagram explains the modification of cinema according to the time from 1980 till date. From an overall perspective, it can be readily apparent that the same area has been customized with a variety of services than before.
Two cinema halls are replaced with five and the car park has been completely removed from the area. Back in 1980, the right side of the entrance was occupied with cinema 1, whereas it has been replaced with food and drinks and relax room. Similarly, on the left-hand side of the entrance, drinks have been replaced with a DVD shop while the ticket counter is at a previous place.
Moving forward from the entrance, on the right-hand side, there used to be a toilet; now toilet occupies the area between cinema 1 and cinema 2. On the opposite side, cinema 3,4,5 can be seen now, replacing cinema 2 previously.
Nice writing, Sushma!
There are a lot of mistakes with fixed expressions though so try to study my sample answers more closely and use the same phrases.
The overview needs work or you will be limited to a 5 for TA!

Can someone please mark the mistakes and evaluate the IELTS BANDS for me?
The given diagram illustrates the changes of a cinema from 1980 until now.
Overall, The cinema complex changes a lot throughout time, if we take the basic changes such as the number of theaters and different conveniences such as a Relax room and a DVD shop.
In the terms of cinema theaters right now in the complex, there are 5 theaters rather than 2 in 1980, during the time our world becoming more modern and especially digital so, that’s why there is a DVD shop where you rent and buy the latest movies and daily shows. And for the conveniences now there is a Relax room where you can enjoy and spent time.
But, there is the same thing which is still the same such as the number and position of toilet and ticket counter. There are some more changes but those changes are not that big such as position and list of the menu of the restaurant now it’s on the right side and now you can buy food also, And there is something which is missing now like car parking, Overall the feeling is still the same when we visit the cinema complex
Hi Sifar, you can find out your band score here: course.howtodoielts.com/band-scores-corrections
What score are you aiming for?

Australian water consumption in different sectors and the percentage of its usage in apartments or houses in 2004 are depicted in the pie chart and the graph. In general, it is salient that most of the utilisation of water was from residential sector.
To begin, the proportion of water consumption was relatively unbalanced. This is because the biggest contributor for water consumption in Australia was home owner with more than half of the total chart. Then, it was followed by apartments owner and business which had a similar proportion. Moreover, industry and goverment took the fourth and fifth place, consecutively. Lastly, with the least contributor of the chart was other.
Furthermore, the high percentage of residential water consumption in 2004 was specified into its bathroom, toilet, washing clothes, kitchen, and garden usage. Bathroom came in the first place with around 27%, which then followed by garden with a slight gap of approximately 2%. The third place belonged to washing fabrics which had about 20%. The utilisation of toilet was at 15%, which was 5% higher than kitchen.
Dear Dave, I hope you can give me some feedback on Task 1. Thank you in advance!
Nice effort, Rifqu!
You need to cover all areas in your overview or it is an automatic band 5 for TA!
The rest of the details are good though there could be more data. Keep working hard!

The diagram below illustrates the changes cinema has undergone starting from 1980 to the present. Overall cinema center has modified such that there are more number of cinema screens and scope to eat and relax increased at the expense of car parking. Figure of cinema screens has increased from two to five. car parking was removed and that place was used to accommodate cinema screens two and three,whereas cinema screen two was further divided into two different screens four and five.cinema one was moved beside to toilet and that place was used to construct relaxation room and foods and drink store. Places which has retained their positions are toilet,ticket center and entrance,Parking was totally eliminated.In place of drinks, DVD shop was developed
Good effort, Madhuri!
Careful of opinion words like ‘relax’ and work on your grammar!

The given diagram compares the changes in cinema structure from 1980 till present. Overall, It can be seen that, the number of cinema hall significantly increased over time.Also,recreational room and DVD shop were installed whereas car parking was completely removed as a part of redevelopment. With regards to cinema hall, three new theaters were added thus making the count to increase from two in 1980 to five in present day.Moreover, car parking which took majority of space in 1980, was demolished later and readjustment of theaters were made in the available space. In addition to cinema halls, recreational room and DVD shop were also introduced for people visiting theaters in current day as opposed to no relaxation room and DVD shop back in 1980.Additionally,Foods were also included along with drinks.
Nice writing Poonam!
Careful with your punctuation though!

The two Theatrical plans depict outlay of 1980 and current times , indicating that cinema outlets have become more than double and shops diversified with toilet remaining the same and parking zone disappearing altogether . In 1980 every corner was occupied with cinema houses , servicing shops and a toilet ,whereas current times show the optimum utilization of spaces. While cinema houses have grown over the double , ,so have the variety of myriad servicing shops too have extended . The new shops erected on displaced theatres are now catering to variety of novel uses of entertainment to the viewers who can enjoy variety of snacks , relaxation and entertainment under one roof . Toilets and Parking zone have either remained the same or have been wiped out altogether . Earlier one zone which was allocated for car parking has now totally disappeared . Similarly the toilets too have remained unchanged over the time .
Nice work, Swati!
Only capitilise proper nouns and be careful with your adjectives.
The given map represents the current and proposed plan of a civic center of the 23/1 Mainland China. Overall, It can be seen that although the layout of the civic center has no change in the future, there has been quite significant modification in the area blocks. The North of the current plan contains two blocks for car parking at the ends of the North Avenue which is proposed to be replaced by a cafe in the top left corner and hostel and restaurant in the top right corner. The cinema which is present in between the car parking is planned not to be changed. Moreover, the IELTS speaking and writing corner in the center of the area is expected to be completely removed in the future. Moving towards the South of the proposed plan, the council offices have been shifted to the corner facing the High Street which was is in between the exhibition center and town hall. Next to the council offices, an underground library is an addition to the civic center. Additionally, an underground car parking is also expected along with the town hall. Although the shopping center is expected to remain unchanged, the library is supposed to be replaced by an exhibition center in the bottom right corner next to the Smith Street.
Nice writing Poonam – sorry about the watermark – that’s not part of the map…
Nice writing otherwise though be careful with your definite articles!

The bar chart illustrates the proportion of older people residing in Canada, Germany, and the UK during 1980 to 2030.
Overall, we can deduce that there is a gradual rise in the ratio of elderly individuals staying in these three countries.
In 1980, we can see that there was a slight difference of around 1% between the UK and Germany in terms of elderly residents of these countries. While, Canadian elderly consisted only 10% of the total population in that year. Whereas, in the year 2000, there was a marked increase of 20%, which could be seen in the percentage of elderly native of Germany compared to the equal percentile of the rest two countries that was 15%. In contrast, in the year 2030 Canadian elders made more percentage than the UK elderly by roughly 2% of the total, but Germany still remained the highest one among the other 2 countries in all the 50 years that was 25% of the total percentage.
Nice writing again, Archana.
Your overview needs a bit more detail as well – did any of the countries overtake the others?
We also don’t use ‘whereas’ to start a sentence.
The process chart describes the ways by which cocoa products are manufactured for the commercial use. Overall, there are three steps in this process from collecting to dispensing the products.
During the initial stage, cocoa beans are collected by the worker from the cocoa field as a whole bean covered with shells. Then, these entire beans with shells are dried before sending it for pressing and draining the cocoa liquor. Afterwards, some cocoa liquor is passed on to the further pressing to get the components for the preparation of cocoa cake and cocoa, rest cocoa liquid is transferred to the industries for the refining purpose for making chocolates by adding sugar and cocoa.
Then, these cocoa cakes are grinding to make cocoa powder and industrial cake drinks. Also, industrial chocolate, which was made in the subsequent step is refined further and processed before releasing it for the commercial purpose and finally, these products like cocoa powder, cake drinks and chocolates reach the market.
Good, but try to define the stages a bit more in your overview, Archana, otherwise you’ll be stuck at band 5 for task achievement.
Good use of linking words!

The two diagrams provide information on how the design plan of Mainland China’s Civic centre will undergo a change from now to coming days.
Overall In future new coffee shop, commercial building and food shops will be introduced in the place of parking lots in the side of North Avenue while the Victoria Avenue side will be more or less same with relocation of council office, library and exhibition centre between the High street and Smith street.
As the time passes the movie theater and markets will be in the same place with no change at all. The parking areas will be shifted underground from North Avenue towards Victoria Avenue on which the town hall will stand like before. There will be an interchange of places among the council office, library and exhibition centre.
The council office has tend to move just beside the High street with a new larger library built beneath the ground level along side. Unlike the library the Exhibition gallery will be smaller in size in the coming days and will replace the present library behind the malls just at the edge of Smith street.
Great work, Mafruha!
Where did you get that map from by the way?
Careful with words like ‘tend’.
Thankyou I just took a screen shot

The map represents the layout of a museum in 1957 and 2007 . It can be clearly seen in a glance ; there where significant changes made to by 2007 in comparison to 1957.
The museum initially was centered around a garden. In 1957, the national history exhibition was a long room ,the entrance from the road directed to the national history exhibition . The local history room and museum store room where on the either sides of the entrance hall. The museum was parallel to the road .
In the year 2007,the museum has been expanded . In addition to other amenities . The national history exhibition is replaced with the local history room , in the top left corner is special exhibition and on the top right is the education center . The local history in 1957 was replaced with the reception in 2007 and the museum store room was replaced with a cafe.The entrance is relocated to an adjacent room that is newly constructed which is a museum shop.
From an overall perspective, it is readily apparent that there are some radical changes that took place over half a century from 1957 and 2007
Great work Lois!
You need to group and define your changes for the overview to be above band 5 though!

The Picture illustrates various changes till now from year 1980 in Cinema. Overall, numerous cinemas have been built within the region. Alongside, new rooms and shops have been set up with removal of car parking in the North . From year 1980 to year 2020, new cinemas have been constructed within the premises, with only 2 cinemas in first year to total of 5 cinemas in the current year. The car parking has been permanently removed and it is now replaced by two cinemas numbered 2 and 3, one of which is relocated to the top right corner from its previous middle right position. Moreover, cinema numbered 1 has been repositioned to middle left just below the toilet. On the other hand, new shops of refreshments and DVD’s are set up near the entrance replacing cinema number 1 and drinks shop respectively. Furthermore, A leisure room is also made available near the entrance for people to relax. The toilet room, ticket section and entrance position is kept the same over the given time period of four decades.
Great writing Aashish but be careful with punctuation and capilisation especially!

U r awesome buddy, thnx alot for this mind-blowing stuff

please review my writing for task 1 regarding the civic centre!

The maps illustrate a civic center at present and proposed changes for the future. Overall, it can be seen that the space occupied by car parking areas will be replaced by eateries, and both the car parking and the library will be shifted below the ground level.
Presently, along the North Avenue, there is a cinema hall in the middle with two parking lots at its both sides. The future plan delineates that a cafeteria will be built in place of a car park situated at the north west of the center, while hotel and restaurant will occupy the north east parking space.
The Victoria Avenue, which is located in the south of the civic center has an exhibition at the south west corner, close to the high street. Next to it, are council offices and then a town hall. Moving further to the east, in close access to the smith street, is shopping center and a library. In the future, council offices will be shifted to the bottom left, whereas exhibition will be moved to the bottom right of the center. Construction of an underground library will take place where there are council offices at present, and a new parking space will be provided below the town hall.
Nice writing but be careful with subject/verb agreement and using articles.
The overview is also a bit specific.
Keep working hard though!

The map demonstrates the modification that took place in cinema hall over two-year period from 2010 to 1012.
Overall, it is seen that the area of movie theater was planned to expand its area with new facilities like restaurant, showers and coordination. All rooms were made bigger in size.
one of the key changes over two years was overall extension of area of cinema hall. Dressing room was replaced by coordination hall and shifted to top left corner of the hall. Similarly, storage room was converted into admin office. Stage and auditorium were expanded to larger in size. Likewise, ticket office was shifted to the room where there used to be café which was upgraded to a bigger restaurant replacing admin office and ticket office with some extension.
Showers were the facility that was added in 2012 which can be accessed on the south of the dressing room. The space immediately after main entrance was utilized for restaurant.
Nice writing, Roshna!
Modification isn’t a word we would use for this kind of map though.
Also be careful with your articles especially.

The above map delineates the present condition of a civic centre and its future expansion plan. From an overall perspective quite a few changes are planned for the future along with some extra facilities.
At present the cinema hall is in the North of the map with car parking in Northwest and Northeast. The position of the cinema hall would remain unchanged but the parking in Northwest would be replaced by a café while a hotel and a restaurant are planned to replace the parking in Northeast. The exhibition center is in the Southwest west direction which would be replaced by council offices, and exhibition center would take place of library located in Southeast. The position of townhall would not be changed, but an underground parking would be developed under it. The library which would be replaced by exhibition centre would be moved underground next to car parking. The place where the shopping centre stands will remain unchanged in the future.
Good work, Shweta!
Careful with your use of would – try using the passive voice: is planned/projected to.

how to write this in report form
You can click on the sample answers to see…

The chart given illustrates the relation between the abroad student and local student from in Australian universities between 2011 and 2010. The line graph is given illustrate the midyear population per million in China, India, and the USA between 1950 and 2000. Overall, the USA was stand steady throughout the whole time. However, India and china registered a significant increased population. Firstly, the population of the USA was less than two hundred million in 1950. And after fifty years it become about 300 million in 2000, which is less than India and China in 1950 Secondly, India showed a rapid growth between 1950 and 2000, which it has started in under 400 million to more than double the number at the end (1000 million). Also, china started in approximately 600 million, then maintained the same level from 1959 to 1962). Finally, from 1963 china population sharply rise until the population reached about 1300 million.
See my other comment, Muna!
The chart given illustrates the relation between the abroad student and local student from in Australian universities between 2011 and 2010.
The line graph is given illustrate the midyear population per million in China, India, and the USA between 1950 and 2000. Overall, the USA was stood steady throughout the whole time. However, India and China registered a significantly increased population.
Firstly, the population of the USA was less than two hundred million in 1950. And after fifty years it becomes about 300 million in 2000, which is less than India and China in 1950
Secondly, India showed a rapid growth between 1950 and 2000, which it has started at under 400 million to more than double the number at the end (1000 million). Also, china started at approximately 600 million, then maintained the same level from 1959 to 1962). Finally, from 1963 china’s population sharply rise until the population reached about 1300 million.
Nice writing, Muna!
Careful with your helping verbs and main verbs and your subject/verb agreement!

The rendered pie chart and table illustrates job opportunities for Anthropology graduates after completing their undergraduate degree course from a university and salaries of Anthropology graduates after 5 years of work respectively.The data is calibrated in percentage.
Looking from an overall perspective, it is evident that majority of Anthropology graduates are employed on full-time basis. Whilst only a small fraction of student graduates work part-time and continue their postgraduate study. A large number of graduates receive average salaries when employed in private companies wheres the highest wages are acquired in government sector.
To commence with, about 52% of Anthropology graduates work on full-time basis, followed by 15% of students engaged in part-time jobs. Out of total graduates 12% of them are unemployed. Anthropology graduates continuing full-time postgraduate study and those whose data is not known are equal at about 8%. A minimum ratio of about 5% students continue to work part-time along with their post graduate study.
Furthermore, $25,000-50,000 salary is given to 5% graduates by both freelance consultants and in government sector whereas, private companies offer such range of salary to about 10% students after 5 year’ work. Fraction of graduates getting salary between half a million and a million is 15-40% in freelance consultants, about 15-30% in government sector and 35-25% in private companies. 50% of Anthropology graduates receive salary of more than a million dollars while in freelance consultants and private companies it is 40% and 30% respectively.
Nice work though a little bit on the long side – aim for about 175 words!
It is a tough one. Try to add in some more commas on your complex sentences as well.

how much band score would you give to the task?
You can sign up here to find out: Patreon.com/howtodoielts

The displayed bar graph spell out the information pertaining about the total time spent on phone calls in UKin three different categories during the time frame from 1995 to 2002.
Beginning with local calls it is evident from the graph that the figures ascend by leap and bounds from the year 1995 to 1999.Morever, the striking feature of the graph was in the year 1999 with the highest minutes accounting upto 90 billion.However, the figures plunged and the ratio continued to decrease till the end of the period with 72 billion in 2002.On the contrary, if talked about national and international calls ratio it can be highlighted that the ratio began with the lowest i.e. around 38% but saw a considerable growth during the end of the period which means to reach a peak of 60 billion in 2002.
Meanwhile, all calls ratio witnesses a modest increase continuing till 2002. In addition, the ratio started with 5 billion and saw a slight rise till 1998. Afterwards, the figures boosts up and reaching to almost 45 billion.
Thus to wrap up it can be finally commented that national and international calls ratio rose steadily.Similarly, all calls ratio also rose gradually.

How much band score would u give to this report .
Nice work, Richard!
There are too many informal phrases though like ‘leaps and bounds’.

Sir how much band score I can achieve?

Discuss about 2 task

The line graph depicts the French and English teacher’s employment ratio in Ontario starting from 2001 and ending 6 years later in 2007. At first glance, it can easily be seen that while the figure for French-language teachers showed an upward trend, the percentage of English-language teachers declined. Although, French-language teachers initially had a lower rate. it outraced the English-language teachers at the end of the period. In 2001, the English-language teachers’ recruitment rate was about 72%, being a bit higher than the French-language teachers’ one by approximately 3%. Then, it declined drastically until 2003, accounting for 40%. However, the figure showed a gradual increase to about 45%, over the next 2 years. After 2005, it continued to decrease, reaching its lowest point at about 28% at the end of the period. The employment ratio of French-language teachers was 70% in 2001 and over the next year decreased to about 52%. Then, the figure rose steadily to almost 70% in 2003 and continued to gradually grow until 2005, when it slightly dropped to about 68%. After that slight drop, it continued to increase, reaching its peak at about 72% in 2007. In summary, it is obvious that in Ontario French-language teachers were employed more than the ones who teach English. Word count: 214

I had a doubt in task 1. If you could please help. Is it a rule that we are not suppose to write ing form of words in writing task 1. Eg: looking ( looking from overall perspective) Fluctuating. Considering. Etc ?

please where is topics for task 1 2023

I’m sorry to ask ,but what is your Writing task 1 score for each of the sample writings here?
Exclusive Ebooks, PDFs and more from me!
Sign up for patreon.
Don't miss out!
"The highest quality materials anywhere on the internet! Dave improved my writing and vocabulary so much. Really affordable options you don't want to miss out on!"
Minh, Vietnam
Hi, I’m Dave! Welcome to my IELTS exclusive resources! Before you commit I want to explain very clearly why there’s no one better to help you learn about IELTS and improve your English at the same time... Read more
Patreon Exclusive Ebooks Available Now!
IELTS Writing Task 1
Share on Whatsapp
Share on Email
Share on Linkedin

Limited-Time Offer : Access a FREE 10-Day IELTS Study Plan!
“Explore this comprehensive guide on IELTS Writing Task 1 and learn how to improve your writing skills and avoid common mistakes to achieve that band score! “
Interpreting visual data and summarizing information accurately is a vital skill for higher education and global communication and this skill is evaluated in IELTS Writing Task 1 exam. It is, thereby, a crucial component of both the Academic and General Training modules.
In this comprehensive guide, we will examine all aspects of IELTS Writing Task 1, exploring its different formats, question types with IELTS exam examples, tips for success, and common mistakes to avoid.
Understanding IELTS Writing Task 1
Task 1 of IELTS Writing assesses the candidate's ability to interpret and present information in a clear and coherent manner. It requires candidates to describe visual information or frame a letter in a minimum of 150 words in 20 minutes.
The key skills tested in Task 1 include:
- Understanding Visual Data or Prompts: Candidates must accurately interpret the visual data provided or prompts for letters and convey the main trends, comparisons, and significant points accurately.
- Organizational Skills: Structuring the response effectively is essential, including introducing the topic, providing an overview or a purpose, and presenting key details logically.
- Language Accuracy: Candidates are evaluated on their ability to use a range of vocabulary, grammatical structures, and cohesive devices to express ideas precisely.
IELTS Writing Writing Task 1 Question Types
You have to keep in mind that Task 1 differs for both IELTS General and Academic purposes. So, the different types of questions in these two types of IELTS exam are given below.

IELTS Academic Writing Task 1
You will be required to represent data relevant to an academic context that are shown in one or more figures, such as graphs, charts, tables, diagrams, or processes in Task 1 of IELTS Academic .
There are typically seven types of questions in IELTS Writing Task 1 Academic:
- IELTS table chart
- IELTS bar chart
- IELTS Writing Task 1 - Line graph
- IELTS pie charts tips and strategies
- IELTS Map Diagram
- IELTS Process diagram
- Combination (Mixed) charts
For a deeper comprehension of the subjects, it is crucial to regularly practice using the IELTS writing task 1 practice tests with answers.
IELTS Academic Writing Task 1 Samples
Check out the recent Writing Task 1 topics with IELTS Writing Task 1 sample answers:
- Village of Stokeford in 1930 and 2010- Map
- Paradise Island Map – IELTS Academic Writing Task 1 Answers
- IELTS Academic Writing Task 1 Example 4 : Development of the village of Rye mouth – Map
- IELTS Academic Writing Task 1 Topic: The development of cutting tools in the stone age – Diagram
- IELTS Academic Writing Task 1 Example 3: Civic Centre – Map
- Changes in Modes of Travel in England Between 1985 and 2000- IELTS Writing Task 1 (Table)
- IELTS Academic Writing Task 1: Main Reasons why Agricultural Land Becomes Less Productive
- Cinema Viewing Figures for Films by Country, in Millions- Table
- Number of Medals Won by the Top Ten Countries in the London 2012 Olympic Games- Table
- IELTS Academic Writing Task 1 Topic 12: Internet use in six categories by age group – Table
- IELTS Academic Writing Task 1 Topic : Annual pay for doctors and other workers – Bar chart
- Division of Household Tasks by Gender in Great Britain- Bar Graph
- IELTS Academic Writing Task 1 Topic 11: Different methods of waste disposal in four cities – Bar Chart
- Amount of Leisure Time Enjoyed by Men and Women of Different Employment Statuses- Bar Chart
- Number of Computer and Internet users in Different Arab Countries- Bar Graph
- The Changes In Ownership Of Electrical Appliances And Amount Of Time Spent Doing Housework In Households – IELTS Writing Task 1
- IELTS Academic Writing Task 1 Topic : The Percentage of Female Members of Parliament in 5 European Countries
- IELTS Writing Task 1 – The graph below shows different sources of air pollutants in the UK Sample Answers
- IELTS Academic Writing Task 1 Topic: Price changes for fresh fruits and vegetables – Line Graph
- Demand for Electricity in England- Line Graph and Pie Chart
- Average Household Expenditures in a Country in 1950 and 2010- Pie Chart
- Methods of Transportation for People Traveling to a University – Pie Chart
- Percentage of Water Used for Different Purposes in Six Areas of the World- Pie Chart
- Online shopping sales for retail sectors in Canada – IELTS Writing Task 1 Pie chart
- IELTS Academic Writing Task 1 Topic 09 : Consequence of deforestation – FlowChart
- Academic IELTS Writing Task 1 Recycling process of wasted glass bottles Sample Answers
- Water Cycle Diagram – IELTS Academic Writing Task 1 Answers
- IELTS Writing Task 1 Process Chart 2024 – Process Diagram with Sample Answers
- Percentage of Food Budget the Average Family Spent on Restaurant Meals- Pie Chart + Line Graph
- Amount of Money Per Week Spent on Fast Food in Britain- Bar Graph + Line Graph
- Water use Worldwide and Water Consumption- Line Graph and Table
IELTS General Writing Task 1
The candidate must compose a letter outlining details from IELTS GT Writing Task 1 or providing an explanation of a circumstance.
There are three types of letters for IELTS General writing task 1:
- IELTS General Writing Task 1 Sample Formal Letters
- IELTS General Writing Task 1 Sample Semi-Formal Letters
- IELTS General Writing Task 1 Informal Letters
Candidates are assessed on their ability to engage in personal contact, elicit and offer general factual information, express needs, likes, and dislikes, as well as their opinions, in the IELTS general writing task 1.
IELTS General Writing Task 1 Samples
Here are some latest Writing Task 1 topics with sample answers for IELTS General Training:
Formal Letter
- Formal Letter to Change Hostel Room- IELTS Writing Task 1
- You Have Seen an Advertisement for a Community College- Formal letter
- Last Week You Were on a Flight to London- Formal Letter
- One of Your Friends Wants to Apply for a Job- Formal letter
Semi Formal Letter
Informal Letter
Evaluation Criteria for IELTS Writing Task 1
The purpose of the IELTS Writing Task 1 question is to assess a candidate's writing abilities.
- Four criteria are used to assess a candidate's IELTS score: Task Achievement, Coherence & Cohesion in IELTS Writing , IELTS Lexical Resource and IELTS Grammatical Range & Accuracy.
- For IELTS Writing Task 1, each component is worth 25% of the candidate's final score.
Therefore, these are standardized measures that a student needs to follow throughout their answer to achieve their desired IELTS band score . Check the table given below:
| 9 | ||||
| 8 | ||||
| 7 | ||||
| 6 | ||||
| 5 |
Top Tips for Success in IELTS Writing Task 1
Candidates must follow some IELTS preparation tips in order to master IELTS Academic writing task 1 and IELTS GT writing task 1. So, given below are some top tips to structure your answers for IELTS Writing Task 1.
- Understand the Task Requirements: Read the instructions carefully and identify the main features and key trends in the visual data.
- Plan Your Response: Spend a few minutes organizing your ideas before you start writing. This will help you structure your response effectively.
- Use a Variety of Vocabulary: Demonstrate your lexical range by avoiding repetition and employing synonyms to describe the data accurately.
- Focus on Significant Details: Highlight the most important information and avoid including unnecessary details that do not contribute to the overall understanding of the required details.
- Practice Time Management: Allocate enough time to each task and aim to complete Writing Task 1 within the recommended 20 minutes.
- Use Synonyms - Don't just copy words from the prompt. Paraphrase with your own vocabulary.
- Include Units of Measurement - Use measurement units like millions, percentage, tons, dollars. This shows attention to detail and highlights obvious contrasts or similarities between data trends to make logical comparisons.
- Use Linking Words - IELTS Writing Task 1 Connectors add like "while", "in addition", "on the other hand" connect your ideas and show cohesion.
- Stick to Plain English - Don't try to sound overly complex. Keep your language clear and concise.
Common Mistakes to Avoid in IELTS Writing Task 1
While analyzing visuals or framing the letter might seem straightforward, Task 1 can trip you up if you're not careful. Here are some key mistakes to avoid:
- Misinterpreting Data/Prompts: Ensure that you accurately understand the information presented in the visual data before attempting to describe it.
- Ignoring Task Instructions: Pay attention to the specific requirements of each task and avoid straying from the given topic.
- Overlooking Grammar and Spelling: Proofread your response carefully to eliminate grammatical errors and spelling mistakes.
- Lack of Coherence and Cohesion: Ensure that your response is well-structured and cohesive, with clear connections between sentences and paragraphs.
The IELTS Writing Task 1 test may seem challenging, but with dedication and the right strategies, you can conquer it. Remember, consistent practice, a focus on improvement, and a clear understanding of the format are key to achieving your desired band score. If you need any sort of guidance, feel free to interact with our IELTS experts or be a part of IELTS webinars . So, take a deep breath, pick up your pen, and embark on your journey to IELTS writing mastery!
Frequently Asked Questions
What is the format of IELTS Writing Task 1?
How much time should I spend on IELTS Writing Task 1?
Do I need to include my opinion in IELTS Writing Task 1?
Should I include an introduction and conclusion in IELTS Writing Task 1?
How can I improve my vocabulary for describing visual data in Task 1?
Where can I find practice materials for Task 1?
What should I do if I don't understand the visual data in Task 1?
Should I include every detail from the visual data in my response?
Is there a specific paragraph structure I should follow in Task 1?
How can I practice for IELTS Writing Task 1?
Practice IELTS Writing Task 1 based on report types
Recent articles.

Kasturika Samanta

Janice Thompson

Raajdeep Saha

IELTSMaterial Master Program
1:1 Live Training with Band 9 Teachers
4.9 ( 3452 Reviews )
Our Offices
Gurgaon city scape, gurgaon bptp.
Step 1 of 3
Great going .
Get a free session from trainer
Have you taken test before?
Please select any option
Email test -->
Please enter Email ID
Mobile Band 9 trainer -->
Please enter phone number
Application
Please select any one
Already Registered?
Select a date
Please select a date
Select a time (IST Time Zone)
Please select a time
Mark Your Calendar: Free Session with Expert on
Which exam are you preparing?
Great Going!
Free IELTS lessons signup

- Academic practice
- General practice
- Task 1 Academic
- Task 1 General
- Task 2 (essay)
Task 1-A samples with tips and answers
Sample 1 Pie chart
Sample 2 Diagram
Sample 3 Line graph
Sample 4 Bar chart
IELTS Academic Writing Task 1
In this task you will be presented with a graph, table, chart or diagram and asked to describe, summarise or explain the given information.
How to answer IELTS Academic Task 1?
1) Analyse the graph
Firstly, you need to get an overview of the graph/chart/diagram you will describe. Look for general trends, changes and key features to get an idea of how you will structure the information.

- Car was the most popular type of transport in all countries, except for Germany.
- In Great Britain and USA, there are big differences between percentages of people who choose some kind of transport.
- In Germany, percentages of people who choose car and bicycle are roughly the same.
- In France, percentages of people who choose motorcycle and bicycle are nearly equal.
- Motorcycle was the least popular type of transport in all countries, except for the USA.
- Overall, car is the most chosen transport, bicycle is on the second place and motorcycle is the least chosen transport.
2) Write an answer with the following structure:
| : Introduce the graph. |
| : Group the given data by some feature. Then describe each feature in a separate paragraph. |
| : Give a short conclusion. |
Once you've thought out all patterns on the graph, you can start writing your answer.
| Introduce the graph (ideally 1-2 sentences). | |
| ||
General overview | In this paragraph you should describe main trends. | Specific features | Group the given data by some feature. Then describe each feature. Use paragraphing! Usually, there should be 1-3 paragraphs in the body part. |
You can learn more about how to answer Writing task 1 .
Don't forget to use special vocabulary to describe graphs and linking structures . Also use words from academic wordlist .
Don't worry if you think there is too much or not enough information!
Remember that the purpose of Academic Task 1 is to test your ability to distinguish and describe the changes and trends you see on the graph.
If you think that there is not enough information on the graph to write 150 words: don't panic! Write in detail about every single alteration and support your writing with a lot of data.
If you think that there is too much information on the graph: also don't panic! Don't ornately depict each change on the graph, but try to see a few main trends instead.
- A Beginner’s Guide to IELTS
- Common Grammar Mistakes [for IELTS Writing Candidates]
Writing Correction Service
- Free IELTS Resources
- Practice Speaking Test
Select Page
How to Structure IELTS Writing Task 1 Essays
Posted by David S. Wills | Aug 24, 2020 | IELTS Tips , Writing | 1

I have written many times about structure on this website, but mostly I have focused on task 2 . Today, however, I am going to take some time to show you how to structure IELTS writing task 1 essays . This often seems like a mystery but in fact it is quite simple and you can usually follow a pretty basic template.
I am going to divide this lesson into two parts. First, we will deal with the IELTS Academic exam and then we will look briefly at the IELTS General exam because these require different structures. Also, keep in mind that IELTS academic writing includes line graphs, pie charts, bar charts, maps, and more, so each of these might require some changes to the essay structure.
IELTS Academic Writing Task 1 Structure
When you do IELTS academic writing task 1, you may find yourself presented with one (or more) of the following:
- Process diagram
These require quite different language but generally you can apply a similar essay structure to all of them. Whether you are writing about a line graph or a table, you can pretty much use this IELTS writing task 1 template :
| Paragraph #1 | Explain the basic facts of the image Describe the general trend |
| Paragraph #2 | Describe the first group of information |
| Paragraph #3 | Describe the second group of information |
Let’s establish what “group of information” means
When you are doing IELTS Academic writing task 1, you need to examine the data and then describe it. To do this, you cannot just take a random approach and write about the different features of the data. Instead, you need to highlight the important parts.
This can be difficult, so let’s take an example.

In this line graph, we only have two lines to write about. Clearly, we could write one paragraph about men and one paragraph about women. Easy! Our structure would look like this:
| Paragraph #1 | It’s a line graph about smoking rates Men increase; women decrease |
| Paragraph #2 | Describe the trend for men |
| Paragraph #3 | Describe the trend for women |
To be honest, that is a very, very easy graph to describe so it was not a challenge. Let’s choose something more difficult to explore:

This is not a terribly difficult line graph to describe, but it presents a challenge for our IELTS writing task 1 structure template. How should we group these three lines?
One option is to structure it like this:
| Paragraph #1 | It’s a line graph about tourism They have opposite trends |
| Paragraph #2 | Describe the trend for visitors on the island |
| Paragraph #3 | Describe the trend for visitors on ships |
Another option is to break the information down according to time:
| Paragraph #1 | It’s a line graph about tourism They have opposite trends |
| Paragraph #2 | Describe the data during the first few years |
| Paragraph #3 | Describe the data during the final years |
Grouping by Time vs Grouping by Type
The easiest way to group data for IELTS writing task 1 is to put them into different types. For example, in this line graph about a Caribbean island, we could potentially describe the number of people who stayed on the island in one paragraph and then the people who stayed on the ships in another paragraph.
But is this the best way?
When you write an essay with that structure, it becomes harder to compare the data. Remember that your question will always say “make comparisons where relevant.”
This suggests that grouping by time is better for one major reason: You can compare the different types of data over time. In this case, we can see the two sets of data are opposites, which gives us a great chance to make comparisons.
Sample Essay
Here is my sample essay about the Caribbean island.
The line graph displays the numbers of tourists that visited an unnamed Caribbean island between 2010 and 2017. The tourists are divided into two groups – those staying on cruise ships and those staying on the island itself – and these had a loosely inverse correlation. The total number of visitors, however, rose more or less continuously throughout the eight-year period. In the first year recorded, which was 2010, there were about twice as many tourists staying on the island as those staying on cruise ships. A year later, the number staying on cruise ships doubled to a half million, but this dropped back to around a quarter million in 2012. When the figures for tourists on cruise ships dropped, the number staying on the island rose quickly and over the coming few years, as this sudden increased levelled off, the number of people who stayed onboard their ship continued to grow again. Between 2012 and 2017, there were more and more visitors staying on cruise ships. From just a quarter million, this rose to two million, while the figures for those on the island levelled off at just one and a half million and then dropped slightly in the penultimate year, before finishing at one and a half. This meant that, for the final two years, more tourists stayed on cruise ships than on the island.
Can you write more than 3 paragraphs?
I would like to make clear that there is no such thing as the correct IELTS writing task 1 essay structure. It is possible to write a great essay with 2 paragraphs, but it is also possible to do it with 4 paragraphs. I would not recommend writing more than 4 paragraphs and I would certainly not recommend writing just 1! This would show a total lack of understanding of Coherence and Cohesion.
(P.S. – Read all about the number of paragraphs for IELTS writing task 2 here .)
Anyway, let’s look at an example of an essay that might be best described with 4 paragraphs:

For this task, we have to decide how to group the data. I personally find that the trend for burglary is more interesting than the others because it has much more of a change, which tells me that it should be described first. You could definitely write a paragraph that grouped car thefts and robberies together, but one is much more common than the other, so it might not work well.
I would take this approach:
| Paragraph #1 | It’s a line graph crime rates Burglary most common at start, but overtaken by car theft. |
| Paragraph #2 | Describe the trend for burglary |
| Paragraph #3 | Describe the trend for car theft |
| Paragraph #4 | Describe the trend for robbery |
Of course, writing this much could mean taking a long time and potentially not finishing your essay. I have written an article about how many words you should write for IELTS, which you can read here .
Sample Essay – 4 Paragraphs
Ok, let’s look at the essay I wrote about crime rates in Newport.
The line graph shows changes in crime rates over a ten-year period in the city centre of Newport. Three types of crimes are listed, two of which ended the period at roughly similar levels to where they began, and one experienced a major drop. In 2003, which was the beginning of the recorded period, burglary was the most common type of crime in Newport, with just under 3,500 cases reported. This rose slightly the following year, before entering into a long downward trend, reaching a low of about 1,200 in 2008. After this, the number of burglaries reported fluctuated until 2012. The number of car thefts was about 2,800 in 2003, and ended the period slightly lower, at 2,700. During the decade-long period, it fluctuated, reaching low points in 2006 and 2008. Car theft was the second most common type of crime in 2003, but the fall in burglaries meant that from 2008 onwards, they were the most common crime in Newport. Robberies were the least common crime and followed a somewhat similar trend to that of car thefts, starting and ending the period with around 700 incidents. It fluctuated only slightly during the ten-year period.
IELTS Writing Task 1 Pie Chart Structure
The previous examples were both line graphs because these are the most common type of IELTS academic writing task 1 question. However, in order to ensure you understand fully, I will also include a pie chart and show you how to structure your essay.
This is actually the most difficult IELTS writing task 1 question I have ever seen!

So how could we produce an IELTS writing task 1 essay structure to fit this?
The obvious choice seems to be writing 3 paragraphs, with 1 paragraph for each of the pie charts. That’s sensible, right?
Well, personally I think that would make it harder to draw comparisons between these data. Instead, I will group the data in terms of meals . I will look at the main meals in one paragraph and then snacks in a final paragraph. This allows me to compare all 3 nutrients!
My structure would then look like this:
| Paragraph #1 | There are 3 pie charts about nutrients 2 pie charts are the same; 1 is different |
| Paragraph #2 | Talk about breakfast, lunch, and dinner, comparing the various nutrients |
| Paragraph #3 | Talk about snacks |
**Please note that this is a quite advanced structure and it is difficult to do. I am including it to show you how it is possible to take various approaches and produce a great essay.
Sample Answer
This is my answer to the very difficult question about nutrients:
The pie charts show information about three different kinds of nutrients and their prevalence in typical American meals. There are four kinds of meal mentioned, including snacks. The figures for sodium and saturated fat are loosely similar, but for added sugar they are quite different. Sodium and saturated fat are both extremely common in typical American dinners. According to the pie charts, 43% of sodium is consumed at dinner time as well as 37% of saturated fat, but just 23% of added sugar is found in American dinners. Almost a third of sodium eaten by Americans is consumed at lunch, alongside more than a quarter of saturated fat. Breakfasts contain the lowest amount of these potentially unhealthy ingredients, at 14% sodium and 16% for both saturated fat and added sugar. The figures for snacks look quite different. More than four tenths of the added sugar consumed by Americans came from snacks, which also contained a fifth of the saturated fats and about a sixth of sodium.
IELTS General Training Writing Task 1 Structure
When you take the IELTS General Training (GT) writing test, you will see that task 1 requires you to write a letter. As such, there is no “recommended essay structure” that you can use.
Instead, you should aim to write a letter that follows typical letter-writing conventions and to use paragraphs logically to guide your reader.
How can you structure an IELTS general writing task 1 letter?
I would strongly recommend this sort of approach:
| Paragraph #1 | Say why you are writing |
| Paragraph #2 | Explain the issue |
| Paragraph #3 | Say what you want the other person to do |
Of course, I will say here that you should not take this as a 100% perfect letter template . It is merely a suggestion and you should pay close attention to the actual task you are assigned. This template can usually be adapted to make a good letter, but sometimes you need to add or combine paragraphs. Also, we might have a short paragraph at the start and/or end of the essay to give some friendly greeting or send some kind regards.
For one thing, sometimes you need to give much more weight to one part of the question, which could require using two paragraphs for that and one for the other parts. An example would be:
| Paragraph #1 | Say why you are writing |
| Paragraph #2 | Explain the issue |
| Paragraph #3 | Continue explaining the issue |
| Paragraph #4 | Say what you want the other person to do |
How to Adapt an IELTS General Writing Task 1 Format Structure
The people who score band 8 or 9 in IELTS writing are not the ones who memorize structures and vocabulary, or who attempt to predict the questions they will encounter. Instead, these are people who can learn from others but create their own essays and letters by adapting good ideas to the present situation.
Let’s look at an example question from IELTS GT writing task 1.
A large company in your area has decided to spend a certain amount of money, either to sponsor a local children’s sports team for two years, or to pay for two open-air concerts. It has asked for feedback from the general public. Write a letter to the company. In your letter, – describe the benefit of sponsoring the sports ream – summarise the benefits of paying for the concerts – say how you think the company should spend the money
How can we structure a reply to this task?
I am going to use the IELTS general writing task 1 format structure that I suggested above, with two paragraphs of explanation in the middle because there are two sides to the issue. My structure would look like this:
| Paragraph #1 | Say why I am writing |
| Paragraph #2 | Explain the benefits of sponsoring a sports team |
| Paragraph #3 | Explain the benefits of paying for a concert |
| Paragraph #4 | Give my opinion – the sports team is a better option |

Here is my sample answer to the above question:
Dear Sir or Madam, I am writing in response to your request for input on the decision about either spending money on a sports team or for two open-air concerts. Firstly, if you were to sponsor the children’s sports team, it would obviously be a great investment in the community. Nothing is more important to us than our children’s health and happiness. If you decided to sponsor the football team, this would mean a tremendous amount to many families. The concerts would also be beneficial in bringing the community together in a big event. This would foster some positive experiences and allow people to have fun together doing something they don’t normally do. It might also be good for local businesses. It is my opinion that you invest the money in the sports team as I think this would have the greatest benefit. For two whole years, parents would be able to watch their children play sports, and that is much better than going along to two concerts. Sincerely, David Wills
More Resources
This is a massive topic to cover and so I suggest that you continue reading once you are finished with this article. I have countless lessons on this website about IELTS writing task 1 (both academic and general) that you can read. I also have an IELTS writing task 1 template PDF file here .
More articles about structure:
- How to Describe a Bar Chart
- 7 Steps to Structuring an IELTS Essay
- How to Describe a Process Diagram
About The Author

David S. Wills
David S. Wills is the author of Scientologist! William S. Burroughs and the 'Weird Cult' and the founder/editor of Beatdom literary journal. He lives and works in rural Cambodia and loves to travel. He has worked as an IELTS tutor since 2010, has completed both TEFL and CELTA courses, and has a certificate from Cambridge for Teaching Writing. David has worked in many different countries, and for several years designed a writing course for the University of Worcester. In 2018, he wrote the popular IELTS handbook, Grammar for IELTS Writing and he has since written two other books about IELTS. His other IELTS website is called IELTS Teaching.
Related Posts

Describe a Memorable Holiday
June 12, 2018

IELTS Speaking Partners
August 30, 2018

How to Pass the IELTS Listening
June 17, 2017

IELTS Writing: What the Examiners Want to See
April 7, 2017

I liked the course very much. It extended my knowledge about IELTS task 1 essay writing. This article is very insightful, points well explained and use of tutorials and examples to give a more clear picture of how task 1 essay should be tackled. Thanks for the great post! I liked how detailed and helpful it is.
Leave a reply Cancel reply
Your email address will not be published. Required fields are marked *
This site uses Akismet to reduce spam. Learn how your comment data is processed .
Download my IELTS Books

Recent Posts
- Exams vs Continual Assessement [Model Essay]
- British vs American Spelling
- How to Improve your IELTS Writing Score
- Past Simple vs Past Perfect
- Complex Sentences

Recent Comments
- Raza Aamir on IELTS Speaking Partners
- David S. Wills on Writing Correction Service
- kenji on Writing Correction Service
- Pop Pop on Straw No More, by Molly Steer
- Francisca on Adverb Clauses: A Comprehensive Guide
- Lesson Plans
- Model Essays
- TED Video Lessons
- Weekly Roundup
IELTS Writing Task 1 – Process Example Essay 1
There are so many questions written each year, you may find you practice answering various questions on different topics. It is best practice to learn how to answer each one of the various types of writing task 1 questions , from bar charts, line graphs, maps, process etc.
Take a look at the IELTS Writing Task 1 Academic essay example below >>
Overall, it can be observed that there are eight phases in the life cycle of a salmon, beginning with laying fertilized eggs by mature salmons in the river and ending with producing its own sets of fingerlings in the same river.
Word count 159 / Band score 8
The best way to keep up to date with posts like this is to like us on Facebook , then follow us on Instagram and Pinterest . If you need help preparing for the IELTS Test, join the IELTS Achieve Academy and see how we can assist you to achieve your desired band score. We offer an essay correction service, mock exams and online courses.
Related Posts
In what ways has technology affected the types of relationships people make | ielts writing task 2, 8 tips to score 7+ in ielts academic writing task 1 essay., leave a comment cancel reply.
IELTS Mentor "IELTS Preparation & Sample Answer"
- Skip to content
- Jump to main navigation and login
Nav view search
- IELTS Sample
20 Recent IELTS Graph samples with answers
The chart below shows how much money is spent in the budget on different sectors by the uae government in 2000..

The charts below show the growth in the population in some of the world’s largest cities as well as the population distribution in urban and rural areas.

The average prices per kilometre of clothing imported into the European Union from six different countries in 1993 and 2003 are shown in the bar chart below.

The bar charts below show the number of hours each teacher spent teaching in different schools in four different countries in 2001.

The line graphs below show the production and demand for steel in million tonnes and the number of workers employed in the steel industry in the UK in 2010.

The bar charts and line graph below show the results of a survey conducted over a three-year period to discover what people who live in London think of the city.

The pie charts below show the online sales for retail sectors in New Zealand in 2003 and 2013.

The number of tourists visiting Malaysia and Dubai from 1995 to 2003 is presented below.

The bar chart below shows the estimated sales of jeans for two companies next year in Turkey. The pie chart shows the projected market share of the two companies in jeans at the end of next year.

The graph below shows a survey result of 4000 participants who expressed what important aspects they have learned from the internship they have completed.

The graph below shows the top priorities by business companies in the USA in 2016.

The graphs below show the average monthly expenditure on children’s sports and participation in different sports in the UK from 2008 to 2014.

The pie charts below show the online shopping sales for retail sectors in Australia in 2010 and 2015.

The bar chart below shows Scotland’s exports to the rest of the UK and the rest of the world for the year 2014.

The chart below shows the changes in sales of four different types of books from 2002 to 2012.

The diagram shows the procedure for university entry for high school graduates.

The chart below shows Morocco’s income from different economic sectors in 2003 as well as its income from fishing from 1982 to 2003.

The bar chart below shows the proportions of English men and women of different ages who were living alone in 2011. The pie chart compares the numbers of bedrooms in these one-person households.

The diagram below shows the life cycle of a salmon, from egg to adult fish.

The table below shows the worldwide market share of the notebook computer market for manufacturers in the years 2006, 2007 and 2014.

- Academic Writing Task 1
IELTS Materials
- IELTS Bar Graph
- IELTS Line Graph
- IELTS Table Chart
- IELTS Flow Chart
- IELTS Pie Chart
- IELTS Letter Writing
- IELTS Essay
- Academic Reading
Useful Links
- IELTS Secrets
- Band Score Calculator
- Exam Specific Tips
- Useful Websites
- IELTS Preparation Tips
- Academic Reading Tips
- Academic Writing Tips
- GT Writing Tips
- Listening Tips
- Speaking Tips
- IELTS Grammar Review
- IELTS Vocabulary
- IELTS Cue Cards
- IELTS Life Skills
- Letter Types

- Privacy Policy
- Cookie Policy
- Copyright Notice
- HTML Sitemap
- IELTS Scores
- Life Skills Test
- Find a Test Centre
- Alternatives to IELTS
- General Training
- Academic Word List
- Topic Vocabulary
- Collocation
- Phrasal Verbs
- Writing eBooks
- Reading eBook
- All eBooks & Courses
- Sample Essays
IELTS Sample Essays
Here you will find IELTS Sample Essays for a variety of common topics that appear in the writing exam.
The model answers all have tips and strategies for how you may approach the question and comments on the sample answer.
You can also view sample essays with band scores on this page.
Looking at IELTS essay topics with answers is a great way to help you to prepare for the test.
These IELTS sample essays have been categorised in a way that makes it easy for you to see how certain essay question types require you to provide certain responses to ensure the question is fully answered.
Specifically these are:
- Agree / Disagree
- Discuss Two Opinions
- Problems and Solutions
- Advantages and Disadvantages
- Other Types
Agree / Disagree Type Questions
In these types of question you are given one opinion and you then have to state the extent to which you agree or disagree with that opinion:
- Advertising
- Alternative Medicine
- Spending on the Arts
- Human Cloning
- Social Interaction & the Internet
- Airline Tax
- Free University Education
- Scientific Research
- Banning Smoking
- Employing Older People
- Vegetarianism
- Paying Taxes
- Examinations or Formal Assessment
- Multinational Organisations and Culture
- Internet vs Newspapers
- Technology Development
- Dying of Languages
- Animal Extinction
- Truth in Relationships
- Role of Schools
- Return of Historical Artefacts
Discuss Two Opinions Type Questions
In this essay question type you are given two opinions, and you have to discuss both of these and then give your own view:
- University Education
- Reducing Crime
- Animal Rights
- Child Development
- Diet & Health
- Donating Money to Charity
- Closing Zoos
- Becoming Independent
- Formal and Informal Education
- Influence of Scientists and Politicians
- Sources for Stories
- Searching for Extraterrestrial Life
Cause Type Questions
There are a variety of 'cause type' essay questions. In these you first have to give the reasons why something has happened, in other words the causes, but then discuss a different aspect of it, such as the effects, solutions or the extent to whether it is a positive or negative development:
Causes & Effects:
- Child Obesity
- Skin Whitening Creams
- Family Size
- Having Children Later in Life
- Time Away from Family
Causes and Solutions:
- Youth Crime
- Global Warming
- Paying Attention in Class
- International Travel & Prejudice
- Museums & Historical Places
- Disappearance of Traditions
- Communication Between Generations
Causes, Pros & Cons:
- Family Closeness
- Living Alone
- Rural to Urban Migration
Problems & Solutions Type Questions
In these type of questions, instead of discussing the causes of a problem, you need to discuss the problems related to a particular issue in society, and then suggest what can be to solve these problems:
- Overpopulation
- Competing for Jobs
- Professionals Immigrating
Advantage & Disadvantages Type Questions
In these type of questions you are asked to discuss the positive and negative sides of a particular topic. You will usually be asked this in the context of giving an opinion ( e.g. Do the advantages outweigh the disadvantages? Is it a positive or negative development? ):
- Traffic Problems
- Food Additives
- Computer Games
- Age Discrimination at Work
- Children using Tablets and Computers
- Cell Phones, Internet, & Communication
- Working from Home
- Eating Locally grown Produce
- Oil and Gas Essay
- Peer Pressure on Young People
- Online Fraud
- Decreasing House Sizes
'Hybrid' Types of Essay Question
There are sometimes questions that don't fit easily into a particular category as above. I've called these 'hybrid', as they are of mixed character, are composed of different elements from other types of essay, or are perhaps just worded differently.
- Protecting Old Buildings
- Animal Testing
- Fear of Crime
- Communication Technology
- Influence of Children's Friends
Sample Essays with Band Scores
You can also view some sample essays that have been written by candidates practising for the test and have band scores and comments by an experienced ex-IELTS Examiner based on the IELTS marking criteria.
- IELTS Band 8 Essay Samples
- IELTS Band 7 Essay Samples
- IELTS Band 6 Essay Samples
- IELTS Band 5 Essay Samples
- IELTS Band 4 Essay Samples
Student Sample Essays
For more IELTS essay topics with answers you can also view essays that have been written by students. Some have feedback from other students or IELTS teachers:
- Student Model Essays (with comments by other students)
- Student Model Essays (with comments by IELTS buddy)
Any comments or questions about this page or about IELTS? Post them here. Your email will not be published or shared.
Band 7+ eBooks
"I think these eBooks are FANTASTIC!!! I know that's not academic language, but it's the truth!"
Linda, from Italy, Scored Band 7.5

Bargain eBook Deal! 30% Discount

All 4 Writing eBooks for just $25.86 Find out more >>
IELTS Modules:
Other resources:.
- All Lessons
- Band Score Calculator
- Writing Feedback
- Speaking Feedback
- Teacher Resources
- Free Downloads
- Recent Essay Exam Questions
- Books for IELTS Prep
- Useful Links

Recent Articles
Improve your IELTS Writing Score - Quickly!
Jul 06, 24 06:40 AM

Skimming and Scanning Tips for IELTS Reading
Jun 21, 24 02:29 AM
5 Key Grammar Rules for IELTS
Jun 14, 24 10:05 AM
Important pages
IELTS Writing IELTS Speaking IELTS Listening IELTS Reading All Lessons Vocabulary Academic Task 1 Academic Task 2 Practice Tests
Connect with us
Before you go...
30% discount - just $25.86 for all 4 writing ebooks.

Copyright © 2022- IELTSbuddy All Rights Reserved
IELTS is a registered trademark of University of Cambridge, the British Council, and IDP Education Australia. This site and its owners are not affiliated, approved or endorsed by the University of Cambridge ESOL, the British Council, and IDP Education Australia.
- IELTS Exam 2024
- How to Apply for IELTS
- IELTS Exam Pattern
- IELTS Registration
- IELTS Syllabus
- IELTS Eligibility
- IELTS Practice Test
- IELTS Exam Fee
- IELTS Band Score Calculate
- IELTS Score Validity
- IELTS Important Dates
- IELTS scholarship
- IELTS Slot Booking
- Check Your IELTS Score
- IELTS Exam 2024: Exam Dates, Registration, Fees, Eligibility, Syllabus, Preparation Tips, Results & Score
Format, Types and Syllabus For IELTS
- IELTS Exam Pattern 2024: Detailed Guide to Test Format, Sections, and Tips
- Types of IELTS Exam 2024: Sections, Patterns & More
- IELTS Exam Dates 2024: Schedule, Registration Deadlines, and Test Centers
- Top 5 Common Reasons for IELTS Application Rejection
- IELTS Speaking 2024: Top Tips, Test Format, and High-Scoring Answers
- Common IELTS Writing Task 2 Topics 2024
- IELTS Band Descriptors For Writing, Reading, Listening & Speaking
- Top IELTS Reading Tips to Boost Your Score: Proven Strategies for Success
- IELTS Writing Task 2: Top Tips for Achieving a High Band Score in 2024
- Top IELTS Speaking Topics 2024: High-Scoring Questions and Answers
- IELTS Indicator: Overview, Key Features & All You Need to Know
- Top 7 Collocations For IELTS Exam : Use of Collocations in IELTS Writing
IELTS Free Study Materials
- Top 10 Useful IELTS 2024 Preparation Websites
- Most Common IELTS Spelling Mistakes Which You Should Avoid
Latest IELTS Writing Task 1 Topics 2024- (Graphs, Charts, Maps, Processes)
- 40+ IELTS Cue Card Topics 2024 With Sample Answers
- Top 10 IELTS Preparation Books 2024: Recommended List by Experts
- List of 300+ IELTS Vocabulary Words: New and Difficult Words
- 150+ Common Proverbs with Meaning and Examples for IELTS Exam
- Most Commonly Mispronounced words in IELTS Speaking
- Recent Most Popular 100+ IELTS Essay Topics of 2024
- Top Idioms for IELTS Speaking: Enhance Your Band Score
- Most Common Verb Tenses to Score High in IELTS 2024
IELTS Online and Offline Coaching
- Top 10 Online Free IELTS Preparation Courses 2024
- List of Top 10 IELTS Coaching Centres in Chennai
- Top IELTS Coaching Centres in Chandigarh in 2024
- Top 10 IELTS Coaching in Pune: Top Institutes, Courses, and Success Tips
- Top 10 IELTS Coaching in Bangalore 2024: Best Institutes, Courses, and Fees
- Best IELTS Coaching in Delhi 2024| List of Top 10
- Top 10 IELTS Coaching Centres in Gurgaon 2024
Cutoff and Scores of IELTS
- IELTS Cut Off 2024: Check IELTS Minimum Score for Top Universities
- What is the highest band in IELTS exam?
- Average IELTS Score 2024: Check Country-wise and Section-wise Score
- IELTS Reading Score 2024: Calculation, Band Descriptors & Score Chart
- IELTS Listening Band Score: Meaning & Score Calculations
- IELTS Writing Score 2024: Tips to Improve & Achieve High Band
- IELTS Writing Task 1 & Task 2 Tips| Everything You Need to Know!
Name of Colleges Accepting IELTS Scores
- How to Send IELTS Scores to Universities 2024?
- IELTS Minimum Score: Essential Guide to Required Band Scores for Top Universities
- Top 10 IELTS Coaching Centres in India 2024
- IELTS Score for USA- Minimum Score Required in 2024
- Minimum IELTS Score to Study in Canada Universities in 2024
- Top 50+ Universities Accepting IELTS Scores: Check Country-Wise List
- IELTS Score Requirements for Top Australian Universities 2024 | Achieve Your Study Goals
- Minimum IELTS Score for an Australia Student Visa
- List of IELTS Accepted Universities in Canada in 2024
- Top UK Universities Accepting IELTS Scores in 2024: Band Requirements & Admission Tips
- List of Top IELTS Accepted Universities in Australia
Tips for IELTS Exam
- How to Crack the IELTS Exam in First Attempt 2024 | Section-Wise Tips & Strategies
- IELTS Preparation at Home: How to Prepare for IELTS at Home
- How to Achieve a 9 Band in IELTS Exam 2024: Top Tips and Strategies
- IELTS Writing 2024: Tips, Strategies, and High-Scoring Sample Essays
- Top 10+ IELTS Speaking Tips and Expert Advice
- Top News Papers We Can Follow For IELTS
- Difference between PTE Academic & IELTS Academic : Latest Updates 2024
- 6 Useful Tips on How to Manage Time in IELTS Reading Section
- Top 10 IELTS Listening Tips 2024: Proven Strategies for High Scores
- IELTS Scholarship For 2024: All You Need to Know!
- Boost Your Reading Speed and Accuracy for IELTS Reading Test
- IELTS Exam: 8 Weeks Study Plan
- IELTS 2024 Test Report Form: Steps to Download & Online Verification
- Grammar for IELTS: Important Topics, Rules & Tips
- IELTS vs TOEFL: Which is Easier for Indian Students?
- IELTS vs TOEFL vs PTE: Key Differences and Which Test to Choose in 2024
- IELTS Academic vs General Tests - What's the Difference?
- How to Write IELTS Essays to Score Band 9!
- Connectors for IELTS Speaking Test: Know How to Use
- How to Use Adverbs of Frequency in IELTS Essays?
- 10 Common IELTS Writing Mistakes and How to Avoid Them
- How to Score 6.5 Band in the IELTS Test: Proven Tips and Strategies
- 5 Reasons for a Low Band Score in IELTS Essay Writing
- IELTS Mock Tests FREE 2024- Download IELTS Practice Test PDF
IELTS Writing Task 1 is one of IELTS most important components since it assesses candidates’ understanding and logical presentation of information. To perform well on this task, applicants should become thoroughly versed in several subjects and improve their writing abilities via regular practice.
In this article, we will explore IELTS Writing Task 1 giving candidates access to practice papers and information about sample topics to help with their preparation.

IELTS Writing Task 1 Topics
Table of Content
What is IELTS Writing Task 1?
Ielts writing task 1 types of questions, ielts academic writing task 1 sample with answers, model ielts academic writing task 1 prompt: describe a map, ielts academic writing task 1: line graph with model answer and scoring explanation, ielts academic writing task 1: bar chart with model answer, ielts academic writing task 1: pie chart with model answer, ielts academic writing task 1: process diagram with model answer.
IELTS Writing Task 1 is the first component of the Writing section in the IELTS exam . It assesses the test-taker’s ability to interpret and describe visual information presented in the form of graphs, charts, tables, diagrams, or maps. The task typically requires candidates to summarize and report the main features, trends, or comparisons shown in the visual data.
Candidates are expected to write in a formal, academic style, presenting information logically and coherently. They should also show an ability to use a range of vocabulary and grammatical structures accurately. The time allocated for IELTS Writing Task 1 is 20 minutes, and candidates are required to write at least 150 words. Task 1 carries a significant weight in the overall Writing score, comprising one-third of the total score.
- Writing task 1 on the Academic and General Training versions of the IELTS is different.
- For IELTS writing task 1, you are required to describe a graph, table, chart, or diagram in 150 words within 20 minutes .
- Write your answers in whole sentences; do not use bullet points or notes.
- You can write in a formal, semi-formal, or personal style.
IELTS 2024 Practice Mock Tests FREE:
|
|
|
|
|
|
|
|
|
|
|
|
|
|
|
| Represents information over time with one or multiple lines. | : The graph shows the population of India and China since 2000 and predicts growth until 2050. | Summarize and compare the main features. | |
| Displays information in vertical or horizontal bars, possibly covering multiple topics. | : The charts show weight measurements of Charlestown residents in 1955 and 2015. | Summarize and compare the main features. | |
| Illustrates data distribution in a circular chart, less frequent than line and bar charts. | : The charts show the reasons people travel to work by bicycle or car. | Summarize and compare the main features. | |
| Tabular representation of various topics. | : The table gives information about languages with the most native speakers. | Summarize and compare the main features. | |
| Depicts a sequence of steps or how something works. | : The diagram shows a structure used to generate electricity from wave power. | Summarize and explain the main features. | |
| Shows geographical changes over time. | : The diagrams show changes at Queen Mary Hospital since its construction in 1960. | Summarize and compare the main features. | |
| Combines different types like graphs and charts. | : Reasons for car use and transport information. | Summarize and compare the main features. | |
| Shows evolution or development over time. | : The diagram gives information on the evolution of the horse. | Summarize and compare the main features. |
Strategies for IELTS Task 1 Topics
Now that you are familiar with the types of Task 1 questions you may face, here are some strategies to effectively tackle any of these question types on the IELTS exam.
Utilize Specific Vocabulary
For tasks involving line graphs, bar charts, and pie charts, use specific terminology such as adjective – noun and verb – adverb combinations. This vocabulary is suitable for describing chronological graphs and charts. Comparatives and superlatives are effective for tasks that involve data comparisons. For processes, maps, and developments, use topic-specific language, which could be familiar vocabulary or terms used in the diagram. Accurately describing the process is more critical than knowing the exact details of how it works.
Use Correct Tense and Voice
Ensure you write in the appropriate tense. Examine the indicated period to determine if it is in the past, present, or future. If no specific period is given, use the present tense. For future or predicted information, use appropriate future-tense language.
For graphs, charts, and tables, employ the active voice. For processes, maps, and developments, use the passive voice. Differentiating between these can enhance your overall band score.
Analyze Before Writing
Take the time to carefully analyze the task type and plan your response before writing. Mentally articulate your response and ensure it makes sense. If it doesn’t, reconsider your approach. Formulating your response in your mind first can make it easier for the examiner to understand your writing.
Writing Task 1 of the IELTS Academic exam asks you to examine an informative visual and provide a written description of its contents. To help you get ready for the examination, we’re going to cover various IELTS Writing Task 1 samples in this article.
The diagrams below show changes that have taken place in the Sawry District neighborhood since 1920. Summarise the information by selecting and reporting the main features and make comparisons where relevant.
.webp "ielts essay sample task 1")
IELTS Writing Task Images 1
Model Essay
These two maps, which show the Sawry District neighborhood in 1920 and 2020, show how the neighborhood has changed over a century. The neighborhood has generally undergone growth. By 2020, there were more public services, more housing, and more enterprises. However, after 1920, not all companies and services continued to exist.
The areas with the biggest development and change were business and housing. In 1920, the cannery was replaced by an office complex. Two of the homes next to the Elmwood River were destroyed and rebuilt with an apartment building and a road. From two houses and a shop, Oak Avenue now had three residences, two shops, an apartment building, and a gas station.
The shift in housing and businesses surpassed the change in public services. After being destroyed, Prestwich Primary School was reconstructed as a larger facility near the stores on Oak Street. Elmwood River also acquired a bike path and a bridge, the latter of which took the site of the little beach shown on the 1920 map.
The chart below gives information about population growth in three major Australian cities from 1992 to 2016. Summarise the information by selecting and reporting the main features and make comparisons where relevant.
.webp "ielts essay sample task 1")
IELTS Writing Task Images 2
Melbourne, Sydney, and Brisbane’s population changes between 1992 and 2017 can be seen in this line graph.
Significant gains in population occurred between 2007 and 2010, even though all cities experienced net annual increases in population by 2011. There were several increases and decreases in growth despite this general pattern, with all cities seeing a decline in growth in 2011.
Melbourne’s growth surged the most overall while having the least annual growth at first. In 1992, there was only around a 23k rise in population; by 2017, however, about 110,000 more people were living there. Brisbane’s growth was almost as low as Melbourne’s at first, although it saw a smaller net gain—from just over 23,000 growths in 1992 to just 50,000 growths by 2017. Sydney had the greatest yearly growth rate at first, at 30,000, but by the conclusion of the era, it had grown by 105,000, following only Melbourne.
The chart below gives information about the ratio of income to spending (in dollars) by Americans by age range in 2013. Summarise the information by selecting and reporting the main features and make comparisons where relevant.
.webp "ielts essay sample task 1")
IELTS Writing Task Images 3
This graph breaks out American spending and income by age group for the year 2013. The information reveals a general increase and decrease in young, middle-aged, and elderly Americans’ income and spending. Spending fluctuates less drastically than income.
In actuality, those over 75 and under 25 spent marginally more than they made. On the other hand, Americans made 10,000–20,000 dollars more than they spent between the ages of 25 and 64. Spending was only a few thousand dollars lower in the 65–74 age group, where the gap is less pronounced.
In actual dollars, individuals under 25 or over 75 made and spent approximately 30,000 and 35,000, respectively. Individuals aged 25–34 and 65–74 both had incomes in the 50,000s and expenses in the 40,000s. In the middle, between the ages of 35 and 64, spending was between $55,000 and $60,000, and income was between $70,000 and $80,000.
The chart below gives information about the household percentage of spending on essential goods in China for the years 1995 and 2011. Summarise the information by selecting and reporting the main features and make comparisons where relevant.
.webp "ielts essay sample task 1")
IELTS Writing Task Images 4
Disparities in Chinese household spending in four key areas are displayed in the two pie graphs. The spending for 1995 and 2011 differs from the spending for these categories, which are indicated as percentages of total spending.
In both years, the biggest categories remained food and clothing, while the lowest ones remained domestic items and medicine. However, throughout time, there were discernible shifts in each of the four categories. Notable changes were observed in the household budget’s allocation for food and medication.
During these 16 years, the top two categories—food and clothing—both saw declines. Just 1% of the food share decreased, from 19% to 18%, although the food share fell more significantly, from 68% to just 18% by 2011.
Household goods and medical were the two categories with the lowest and second-lowest spending in 1995 and 2011, respectively. Nevertheless, by 2011, both have increased their percentage of Chinese household expenditure. While domestic products saw a lesser but still noteworthy gain from 9 to 12 percent, medicine saw a 7-point increase from 4% to 11%.
The diagram below gives information about the recycling of glass and plastic containers. Summarise the information by selecting and reporting the main features and make comparisons where relevant. IELTS Writing Task Images 5
This flowchart illustrates the distinctions and parallels between the production, use, recycling, and repurposing life cycles of glass and plastic containers.
This diagram shows how products made of plastic and glass are manufactured, recycled, and then made again in ways that are similar and different. Though there are more variances between the processes than similarities, the early phases of the recycling process contain some more notable differences.
Both commodities are first collected and transported in the same manner. After that, though, plastic is separated by quality and needs to be packed before it can be shredded, whereas glass is sorted by color and may be crushed right away.
The procedures resemble one other more once the glass is broken and the plastic is shredded. At this stage, the plastic and glass fragments are cleaned, melted, and formed into new items. These last stages are almost the same, except instead of using a single machine to melt and reshape the glass, two must work together.
In conclusion, success in the IELTS exam and beyond depends on your ability to complete IELTS Writing Task 1. Candidates can gain experience with the wide variety of visual data that comes up frequently in this task and develop the skills necessary to assess and describe it effectively by investigating sample themes. Also, practicing with practice papers offers valuable opportunities to improve writing methods, vocabulary growth, and general competency. Candidates can gain confidence in their capacity to comprehend visual data, arrange their ideas logically, and convey concepts with accuracy and clarity by putting in a lot of preparation and practice. Great performance on Writing Task 1 is essential for reaching desired goals, whether those goals are to develop in their employment or to pursue higher education options overseas.
|
|
|
|
|
|
|
|
|
|
|
|
|
|
|
IELTS Writing Task 1 Topics- FAQs
It’s the first part of the IELTS Writing section where you analyze and describe visual data like graphs and charts.
Why is practicing Writing Task 1 important?
Practice helps improve data interpretation skills and writing fluency, crucial for achieving a high score.
Where can I find sample topics for Task 1?
Sample topics are available at the top of this article. You can also find them in IELTS preparation books, online resources, and official IELTS practice materials.
How can I effectively analyze visual data in Task 1?
Focus on identifying key trends, comparisons, and significant features, and practice summarizing them concisely.
What are the key elements of a good Task 1 response?
Clarity, coherence, accuracy, and appropriate vocabulary are essential for a strong Task 1 response.
How much time should I spend on Task 1?
Allocate around 20 minutes to Task 1, ensuring enough time for planning, writing, and reviewing your response.
Where can I get feedback on my Task 1 practice?
You can seek feedback from teachers, tutors, or online platforms offering IELTS writing evaluation services.

Please Login to comment...
Similar reads.
- Study Abroad
Improve your Coding Skills with Practice
What kind of Experience do you want to share?
IELTS Writing Task-1 Sample Formal Letters + Answers
IELTS Writing Task-1 Sample Formal Letters + Answers: IELTS formal letters are commonly asked topics in General Training Writing. These type of questions generally correspond to a person that you have never met, and you do not know their name.

In this lesson, you will learn how to write a perfect band 7+ answer using THREE sample letters and their model answers. We will adopt the following structure which has proven to be the most suitable for formal letters. Practice this structure on the PDF version of the IELTS Writing Task 1 answer sheet .
(a salutation)
Para 1- Say why you are writing to them
Para 2- Bullet point 1 + supporting details
Para 3- Bullet point 2 + supporting details
Para 4- Bullet point 3 + supporting details
(a farewell note)
Yours faithfully ,
[Your Full Name]
You should spend about 20 minutes on this task. Write at least 150 words.
Sample Letter #1 – Complain about missing luggage
You recently took a plane to a holiday. On arrival, you found your luggage missing. You did not receive your luggage until the final day of your vacation. Write a letter to your airline: – Complain about the missing luggage – Tell the company why it caused problems – Seek compensation
| Dear Sir/Madam, I am writing to express my dissatisfaction with the recent service experience I had with your airline. On July 15, 2021, I traveled on Flight 655 from to Toronto. Firstly, the airline lost my luggage in transit. Secondly, when I received it after few days, it was in tattered state. This has caused me substantial inconvenience, as the suitcase contained my clothing, travel charger and books. I therefore obliged to buy all these items at extortionate prices. Moreover, to add insult to injury, the locks were damaged and many items were missing when I finally received the suitcase. I therefore request you to take due cognizance of the matter and kindly compensate for the loss of items. I have enclosed a list of items with this letter. As you see, the amount I mentioned does not include compensation for my inconvenience and wasted time, which I am prepared to forgo if you settle the charge promptly. Thank you, I look forward to receiving your confirmation that my request will be honoured. Yours faithfully, [Name] |
RELATED: IELTS Writing Agree / Disagree Essay Topics
Sample Letter #2 – Local newspaper
You are unhappy about a proposal to make domestic airport bigger and increase the total number of flights. You live near the airport. Write a letter to local newspaper: – Explain where you live – Describe your problems – Give reasons why you do not want this development
| Dear Sir/Madam, I am [Name], a resident of HSR housing society, Chandigarh. I am writing to draw your kind attention towards the considerable inconvenience that people in my locality will face if the local airport is expanded and the number of flights is increased. I am hoping that you would publish an editorial to protest the development and support us in this cause. Life near the airport is already troublesome, as loud noises are too frequent. If the total number of flights is increased, it will aggravate the problem by adding more turbulence and nuisance. Besides, it would worsen the traffic conditions of the adjacent service road which is our only means of entry and exit from the society. In addition, the expansion of local airport will diminish our recreational ground, which is an integral part of our living. Hence, we believe it would be ideal if the authorities could come up with an alternate plan. Last but not least, I would request your editorial section to publish an article on this moot issue. Your support in this matter is of dire importance. Yours faithfully, [Name] |
Sample Letter #3 – Applying for job
The school library is seeking applications for a job over summer break. You want to apply for the job. Write a letter to the manager of the library: – Introduce yourself – Tell about your past experience and skills – Give reasons why you need that job
| Dear Sir/Madam, I am [Name], a final year student of B. Sc. – Biology of your school. I am writing to express my interest in the job that was recently advertised on the job board in the career development centre. While I was in high school, I was appointed as care-taker of library activities in the evening. Moreover, I was responsible for handling books, making entries to the digital library management system, and answering queries over the telephone. Also, I am familiar with the different sections of the library. I am hopeful that this job could add more credit points to my summer internship assignment. Furthermore, it would be an additional source of income for me so that I can buy my course literature for the next semester. I therefore request you to kindly accept my application for the aforementioned position and oblige me thereby. Thank you for your consideration. Yours faithfully, [Name] |
We hope that this complete overview of IELTS Writing Task-1 Sample Formal Letters and Answers will help you organize your writing better and ultimately fetch you a high band score.
Leave a Comment Cancel reply
Save my name, email, and website in this browser for the next time I comment.
IELTS TEST TYPES
✓ IELTS Academic
✓ IELTS General Training
USEFUL LINKS
✓ IELTS Full Form
✓ IELTS Band Score
✓ IELTS Vocabulary
✓ IELTS Grammar
CONNECT WITH US
Pinterest ↗
IELTS® is a registered trademark of The British Council, IDP- IELTS Australia and the University of Cambridge ESOL Examinations (Cambridge ESOL). This site and its owners are not affiliated, approved or endorsed by the University of Cambridge ESOL, the British Council, IELTS Progress Check, and IDP Education Australia. "IELTS Progress Check" is the name of the official IELTS online practice test and is in no way affiliated with this website. To find out more about the official IELTS online practice test please visit https://www.ieltsprogresscheck.com/.
ABOUT US | PRIVACY POLICY | DISCLAIMER | TERMS | CONTACT US
© 2023 IELTSPROGRESS.COM | All Rights Reserved
The official IELTS by IDP app is here! Download it today.
- IELTS Academic
IELTS Academic assesses how well you can use English in an academic environment.
IELTS General training
Students applying to high schools or vocational training programs in English-speaking countries might need to take this test.
English self-assessment tool
Check your language level and get personalised suggestions on how to improve your English and prepare for IELTS.
Get your results
Check your provisional IELTS results online and do more.
IELTS Community
Join the IELTS community and meet with other IELTS test takers from all over the world!
Had a great and memorable experience with IELTS - IFI. The staffs are supportive and very accommodating. Venue is stellar and conducive for testing. Not to mention, the online review is comprehensive and mock exam is absolutely helpful.
Gabriel Yumul
Ielts reading test: how to manage your time, grammar 101: affect vs. effect, grammar 101: understanding verb tenses, ielts general training, writing task 1: how to write a letter, ielts writing task 2: how to write a good introduction.

IELTS Writing Task 2 Essay: Topics, Samples and Tips to Score Band 9!
Are you aiming for excellence in your IELTS Writing? Do you dream of achieving that elusive band 9 score? Look no further! In this blog, we will embark on a journey of transforming your essay writing skills from good to great. Scoring a band 9 in the IELTS Writing module requires not only a strong command of language but also a deep understanding of the assessment criteria and effective writing strategies.
Whether you're a beginner looking to improve or an experienced test-taker seeking that extra edge, this guide will provide you with valuable insights, practical tips, and real examples to help you unlock the secrets of achieving a band 9 in your IELTS essays. So, let's delve into the world of high-scoring IELTS Writing essays and discover how to take your writing prowess to new heights!

IELTS Writing test syllabus, exam pattern, and duration
Duration: 60 minutes
Writing – Academic
The Academic version of the Writing component consists of two tasks, each addressing topics of broad relevance and suitability for individuals entering undergraduate or postgraduate studies, or those seeking professional registration.
|
|
|---|---|
You will be presented with a graph, table, chart, or diagram and are asked to describe, summarise, or explain the information in your own words | You will be asked to write an essay in response to a point of view, argument, or problem |
You may be asked to describe and explain data, explain the stages of a process, how something works, or describe an object or event | Responses to both tasks must be written in a formal style |
Writing – General Training
The General Training version of the Writing component comprises two tasks that revolve around topics of general interest, designed to assess candidates' ability to communicate effectively in common real-life situations.
|
|
|---|---|
You will be presented with a situation and asked to write a letter requesting information or explaining the situation. The letter may be personal, semi-formal, or formal in style | You will be asked to write an essay in response to a point of view, argument, or problem. The essay can be slightly more personal in style than the Academic Writing Task 2 essay |
IELTS Writing task 2 essay writing – Step-by-step guide for scoring a band 9
Here's a step-by-step guide to the IELTS Writing Task 2 :
Step 1: Understand the task requirements
Carefully read and comprehend the task prompt
Identify the type of essay you are required to write, such as opinion, discussion, or problem-solution
Take note of any specific instructions, word limits, or key points to address
Step 2: Plan and organise your ideas
Spend a few minutes brainstorming and generating ideas related to the task.
Create a clear and coherent outline that includes an introduction, body paragraphs, and a conclusion.
Organise your ideas logically and decide on the main points for each paragraph.
Step 3: Write an engaging introduction
Begin your essay with a captivating opening sentence that grabs the reader's attention
Provide some background information or context related to the topic
State your thesis or main argument clearly, which will guide the rest of your essay
Step 4: Develop coherent body paragraphs
Commence each body paragraph with a topic sentence that presents the primary concept
Support your ideas with relevant examples, facts, or evidence
Ensure smooth transitions between paragraphs to maintain coherence and flow
Step 5: Showcase language skills and vocabulary
Employ an extensive array of vocabulary and grammatical structures
Demonstrate your ability to express ideas accurately and precisely
Show awareness of cohesive devices, such as linking words and phrases
Step 6: Conclude effectively
Provide a concise summary of the key points addressed in the body paragraphs
Restate your thesis and provide a concise closing statement
Leave the reader with a lasting impression or a thought-provoking question
Step 7: Revise and edit
Allocate time to review your essay for any grammatical errors, spelling mistakes, or typos
Check the coherence and coherence of your ideas and arguments
Make necessary revisions to improve clarity, coherence, and overall quality
Step 8: Practice time management
Allocate the appropriate amount of time for each task (Task 1 and Task 2)
Practice writing essays within the given time limit to build speed and efficiency
Monitor your progress and adjust your writing speed accordingly
Step 9: Seek feedback and continuous improvement
Share your essays with a teacher, tutor, or native English speaker for feedback
Identify areas for improvement and focus on enhancing those skills
Regularly practice writing essays to refine your technique and boost your confidence
By following these step-by-step guidelines and consistently practicing, you can improve your IELTS Writing Task performance and work towards achieving your desired band score. Remember, practice and perseverance are key to success in the IELTS Writing module. Good luck!
IELTS Writing Task 2 sample essays to achieve a band score of 9
Here are a few IELTS essay samples for band 9 that demonstrate a high level of language proficiency and can help you understand how to score a band 9. Please note that these are samples for your reference and should not be copied/used as they are presented below:
IELTS Writing Task 2 essay topic: Advantages and disadvantages of technology in education
Introduction: In recent years, technology has revolutionised the education sector, providing both benefits and drawbacks. This essay will discuss the advantages and disadvantages of incorporating technology into education and argue that the benefits outweigh the drawbacks.
Body Paragraph 1 (Advantages): One major advantage of technology in education is enhanced learning opportunities. With the help of interactive multimedia tools, students can access a vast range of information and resources, allowing for a more comprehensive understanding of complex concepts. Additionally, technology promotes student engagement and active learning, as it enables personalised and interactive teaching methods.
Body Paragraph 2 (Disadvantages) : Despite the numerous advantages, there are some disadvantages to using technology in education. Firstly, excessive reliance on technology may lead to a decrease in face-to-face interaction and hinder the development of crucial social skills. Moreover, the availability of inaccurate or biased information on the internet can pose a challenge in ensuring the accuracy and reliability of sources used for academic purposes.
Body Paragraph 3 (Benefits outweigh drawbacks) : However, the benefits of technology in education far outweigh the drawbacks. By incorporating technology, educational institutions can bridge the gap between traditional teaching methods and the digital world, preparing students for future careers that heavily rely on technological literacy. Furthermore, technology can facilitate distance learning, reaching students who are geographically isolated or have limited access to educational resources.
Conclusion: In conclusion, technology has transformed education by offering enhanced learning opportunities and promoting student engagement. While there are some disadvantages associated with technology, the benefits of incorporating it into education outweigh the drawbacks. It is crucial for educators to strike a balance between traditional teaching methods and technology to maximize the potential of both.
IELTS Writing Task 2 essay topic: Effects of global warming on the environment
Introduction : Global warming, caused primarily by human activities, has become a pressing issue with far-reaching consequences for the environment. This essay will explore the effects of global warming on the environment and argue that urgent action is required to mitigate its detrimental impacts.
Body Paragraph 1 (Rise in temperatures) : One of the most significant effects of global warming is the rise in temperatures worldwide. This leads to the melting of polar ice caps and glaciers, resulting in sea-level rise and an increased frequency of extreme weather events such as hurricanes and heat waves. Moreover, higher temperatures disrupt ecosystems, endangering various plant and animal species.
Body Paragraph 2 (Loss of biodiversity) : Global warming poses a significant threat to biodiversity. As temperatures increase, many species struggle to adapt or migrate to more suitable habitats, leading to their decline or extinction. The loss of biodiversity has severe consequences for ecosystem stability, as each species plays a crucial role in maintaining ecological balance.
Body Paragraph 3 (Environmental degradation) : Another consequence of global warming is environmental degradation. Rising temperatures contribute to the acidification of oceans, damaging coral reefs and marine ecosystems. Additionally, increased carbon dioxide levels in the atmosphere lead to oceanic dead zones, negatively impacting marine life. Deforestation, driven by the need for resources and land for agriculture, exacerbates global warming by reducing the Earth's capacity to absorb carbon dioxide.
In conclusion, global warming has profound effects on the environment, including rising temperatures, loss of biodiversity, and environmental degradation. Immediate and concerted efforts are necessary to address this issue, including reducing greenhouse gas emissions, promoting sustainable practices, and preserving natural habitats. Only through collective action can we mitigate the impacts of global warming and protect our planet for future generations.
These sample essays showcase the structure, vocabulary, and coherence necessary to achieve a band 9 score. Remember to practice writing within the time constraints of the IELTS test (40 minutes for the writing section).
Book my test
Share this article
Helpful resources.
The difference between IELTS Academic and IELTS General Training
Living Cost in Australia for International Students
IELTS Speaking Topics Part 1, 2 and 3
Top Universities in Australia for International Students
Top 20 In-demand Jobs in Canada for Immigrants in 2024
IELTS announces at-home testing option
7 myths about the IELTS Writing test to dispel
IELTS Speaking: AI vs face-to-face speaking with an examiner
3 parts of IELTS Speaking, and what to look out for!
Don’t overthink during your IELTS test - 7 tips you must know!
- Useful links
- Who accepts IELTS?
- News and articles
- IELTS Masterclass
- Your IELTS results
- IELTS General Training
- IELTS by IDP app
- Find a test centre
- Middle East
- Netherlands
- New Caledonia
- New Zealand
- Papua New Guinea
- Philippines
- Saudi Arabia
- Solomon Islands
- South Korea
- Switzerland
- Legal notices
- Privacy policy
- Cookie policy
- Copyright 2024 IDP IELTS
COMMENTS
Here you will find IELTS Writing Task 1 Samples for a variety of common tasks that appear in the writing exam. The model answers all have tips and strategies for how you may approach the question and comments on the sample answer. It's a great way to help you to prepare for the test.
Prepare for the IELTS Academic Test by using this collection of IELTS Academic Writing Task 1 practice samples. This collection is a great way to gain insight and practice for the exam. The table below shows local catches and imports of fresh fish into Perth, Australia for the years 2004 - 2014.
The resources below include an IELTS writing task 1 sample answer pdf. Line graph IELTS academic task 1 sample essay 26: Thermal conductivity of material at 25C. Line graph IELTS academic task 1 sample essay 7: January 2015 temperature variation in the Philippines. Line and bar chart IELTS academic task 1 sample essay 5: Common budget items chart.
IELTS Academic - Graph Writing: In your IELTS Academic Writing Task 1, you will be given with one or more graph(s) (i.e. bar, column, line or pie), table, flowchart, map or process diagram and you need to summarise the main information, compare data, show contrasts and trends, identify significant trends and describe a process.You should write between 150 to 200 words and the minimum word ...
Task 1 Sample Questions and Band 9 Model Answers. For more information and help with your IELTS test visit- IELTSAdvantage.com. Below you will find 4 questions that are typical of those found on the Task 1 Academic test. You should attempt the questions first and then compare your answers with my model answers.
In the IELTS Academic Writing test, you will have one hour to complete both of the two set writing tasks. Keep an eye on the time it takes you to complete practice Tasks 1 and 2 to make sure you don't go too far over, and to use as a benchmark for how long you can expect each task to take you. In the actual test, you will move from the first ...
You should write over 150 words. IELTS writing task 1 is worth only about 33% of your total writing marks. Academic writing task 1 is a report on a chart (bar chart, line graph, pie chart, table, map, diagram/process). See below for practice charts, model answers, tips etc. General Training writing task 1 is a letter only.
The Writing Task 1 of the IELTS Academic test requires you to write a summary of at least 150 words in response to a particular graph (bar, line or pie graph), table, chart, or process (how something works, how something is done). This task tests your ability to select and report the main features, to describe and compare data, identify significance and trends in factual information, or ...
Here on IELTS Podcast, you will find useful IELTS Academic writing task 1 tips, tutorials, sample essay questions and answers to help you prepare for your Academic task 1 exam. How much time should I spend on IELTS writing task 1 in the IELTS test? The IELTS writing exam is divided into two sections. You have an hour to write both.
Task 1 Sample. You should spend about 20 minutes on this task. The pie chart shows the amount of money that a children's charity located in the USA spent and received in one year, 2016. Summarise the information by selecting and reporting the main features and make comparisons where relevant. Write at least 150 words.
The guide tells you everything you need to know about how Writing Task 1 essays and paragraphs should be structured, with an example question and model essay. IELTS Writing Task 1 Samples: The Major Question Types. Below are questions for each common infographic in IELTS Writing Task 1: bar charts, pie charts, line graphs, process diagrams, and ...
People doing the Academic test will write a report on a data set, map, or process. People doing General Training will write a letter. You must write 150 words or more. You should spend around 20 minutes on this part of the test. Task 1 is worth 1/3 of your total mark on the Writing test.
Read my sample answer for this (unusual) task 1 here. IELTS Essay: Bridges. Read my sample answer for this topic here. The bar graph shows the total manufacturing production in percentages Asia, Europe, and the rest of the world. IELTS Task 1 Reported on May 7th. Read my sample answer here. Reported on IELTS May 1st. Read my sample answer here.
The purpose of the IELTS Writing Task 1 question is to assess a candidate's writing abilities. Four criteria are used to assess a candidate's IELTS score: Task Achievement, Coherence & Cohesion , Lexical Resource and Grammatical Range & Accuracy. For IELTS Writing Task 1, each component is worth 25% of the candidate's final score.
Use paragraphing! Usually, there should be 1-3 paragraphs in the body part. You can learn more about how to answer Writing task 1. Don't forget to use special vocabulary to describe graphs and linking structures. Also use words from academic wordlist . Don't worry if you think there is too much or not enough information!
Writing Task 1. The Chart Below Shows the Number of Households in the US by Their Annual Income. READ MORE >>. The Graph Below Shows the Average Monthly Change in the Prices of Three Metals During 2014. READ MORE >>. The Diagram Below Shows the Floor Plan of a Public Library. READ MORE >>. The Graph Below Gives Information About the Percentage ...
Whether you are writing about a line graph or a table, you can pretty much use this IELTS writing task 1 template: Paragraph #1. Explain the basic facts of the image. Describe the general trend. Paragraph #2. Describe the first group of information. Paragraph #3. Describe the second group of information.
The writing task 1 table sample has all the elements to get a high score for IELTS. There is a to the graph (paraphrasing, not copying, the rubric) and then an that selects key changes / trends in the table. It is and thus clear to follow and read, with the paragraphs arranged around age groups ( There is usually various ways to organise your ...
In this post, we will look at a Writing Task 1 Academic process essay example from the IELTS writing task 1 Academic Test. Students often ask if the questions are repeated year after year and the answer is no, but the type of chart, graph or process can be. There are so many questions written each year, you may find you practice answering ...
20 Recent IELTS Graph samples with answers. The following IELTS Academic Writing Task 1 questions are taken from recent IELTS exams. If you are preparing for the Academic IELTS or planning to take the test soon, practise those samples and submit a worth sharing answer in the comment section. If you have recently taken Academic IELTS test, you ...
Home » IELTS General Task 1 » IELTS General Writing Task 1: Letter samples, phrases and tips.. The general writing task 1 exam evaluates the test taker's writing skills in responding to a complaint, requesting information or explaining a certain situation in a letter. You should spend no more than 20 minutes on this section and you should write at least 150 words.
IELTS Sample Essays. Here you will find IELTS Sample Essays for a variety of common topics that appear in the writing exam.. The model answers all have tips and strategies for how you may approach the question and comments on the sample answer.. You can also view sample essays with band scores on this page.. Looking at IELTS essay topics with answers is a great way to help you to prepare for ...
IELTS Academic Writing Task 1 Sample with Answers. ... IELTS Writing Task 2 is an essay writing task that requires us to express and develop an argument or a point of view in response to a given prompt. The essay should be in a formal tone, with a minimum of 250 words, and must be completed in around 40 minutes. ...
Practice this structure on the PDF version of the IELTS Writing Task 1 answer sheet. (a salutation) Para 1- Say why you are writing to them. Para 2- Bullet point 1 + supporting details. Para 3- Bullet point 2 + supporting details. Para 4- Bullet point 3 + supporting details. (a farewell note)
IELTS Writing task 2 essay writing - Step-by-step guide for scoring a band 9. Here's a step-by-step guide to the IELTS Writing Task 2: Step 1: Understand the task requirements. Carefully read and comprehend the task prompt. Identify the type of essay you are required to write, such as opinion, discussion, or problem-solution
1 likes, 0 comments - miraceljuanta on July 7, 2024: "IELTS Preparation Tips. You Don't Need to Write an Essay a Day to Get Band 7 in IELTS Writing! Contrary to popular belief, writing one essay per day isn't necessary to achieve a Band 7 in IELTS Writing. Quality over quantity is key. Instead, focus on these strategies: Understand the Task Requirements: Know what each task demands and ...