Weather Processes and Systems
LEARNING OUTCOMES
- Describe the various aspects and elements of weather and atmospheric water.
- Explain how air masses and weather fronts together form mid-latitude cyclones.
- Describe the three phases a thunderstorm goes through in it’s life cycle.
- Determine the causes and geographic location of most tornadoes around the world.
- Describe the genesis of hurricanes formation
- Compare the difference between blizzards lake effects, and heat waves.

Weather and Atmospheric Water
Weather is what is going on in the atmosphere at a particular place at a particular time. Weather can change rapidly. A location’s weather depends on air temperature; air pressure; fog; humidity; cloud cover; precipitation; wind speed and direction. All of these are directly related to the amount of energy that is in the system and where that energy is. The ultimate source of this energy is the sun.

Since warm air can hold more water vapor than cool air, raising or lowering temperature can change air’s relative humidity. The temperature at which air becomes saturated with water is called the air’s dew point. This term makes sense, because water condenses from the air as dew, if the air cools down overnight and reaches 100% humidity.

When there are no clouds, there is less insulation. As a result, cloudless days can be extremely hot, and cloudless nights can be very cold. For this reason, cloudy days tend to have a lower range of temperatures than clear days.
There are a variety of conditions needed for clouds to form . First, clouds form when air reaches its dew point. This can happen in two ways: (1) Air temperature stays the same but humidity increases. This is common in locations that are warm and humid. (2) Humidity can remain the same, but temperature decreases. When the air cools enough to reach 100% humidity, water droplets form. Air cools when it comes into contact with a cold surface or when it rises.
Rising air creates clouds when it has been warmed at or near the ground level and then is pushed up over a mountain or mountain range or is thrust over a mass of cold, dense air. Water vapor is not visible unless it condenses to become a cloud. Water vapor condenses around a nucleus, such as dust, smoke, or a salt crystal. This forms a tiny liquid droplet. Billions of these water droplets together make a cloud.
High-level clouds form from ice crystals where the air is extremely cold and can hold little water vapor. Cirrus , cirrostratus , and cirrocumulus are all names of high clouds. Cirrocumulus clouds are small, white puffs that ripple across the sky, often in rows. Cirrus clouds may indicate that a storm is coming.
Middle-level clouds , including altocumulus and altostratus clouds, may be made of water droplets, ice crystals or both, depending on the air temperatures. Thick and broad altostratus clouds are gray or blue-gray. They often cover the entire sky and usually mean a large storm, bearing a lot of precipitation, is coming. Low-level clouds are nearly all water droplets. Stratus , stratocumulus and nimbostratus clouds are common low clouds. Nimbostratus clouds are thick and dark that produce precipitation. Clouds with the prefix ‘cumulo-‘ grow vertically instead of horizontally and have their bases at low altitude and their tops at high or middle altitude. Clouds grow vertically when strong unstable air currents are rising upward. Common clouds include cumulus humilis , cumulus mediocris , cumulus congestus , and cumulonimbus .

Storms arise if the air mass and the region it moves over have different characteristics. For example, when a colder air mass moves over warmer ground, the bottom layer of air is heated. That air rises, forming clouds, rain, and sometimes thunderstorms. How would a moving air mass form an inversion? When a warmer air mass travels over colder ground, the bottom layer of air cools and, because of its high density, is trapped near the ground.
In general, cold air masses tend to flow toward the equator and warm air masses tend to flow toward the poles. This brings heat to cold areas and cools down areas that are warm. It is one of the many processes that act towards balancing out the planet’s temperatures. Air masses are slowly pushed along by high-level winds. When an air mass moves over a new region, it shares its temperature and humidity with that region. So the temperature and humidity of a particular location depends partly on the characteristics of the air mass that sits over it. Air masses are classified based on their temperature and humidity characteristics. Below are examples of how air masses are classified over North America.
- Maritime tropical (mT) – moist, warm air mass
- Continental tropical (cT) – dry, warm air mass
- Maritime polar (mP) – moist, cold air mass
- Continental polar (cP) – dry, cold air mass
In general, cold air masses tend to flow toward the equator and warm air masses tend to flow toward the poles. This brings heat to cold areas and cools down areas that are warm. It is one of the many processes that act towards balancing out the planet’s temperatures.
Weather Front

STATIONARY FRONTS At a stationary fron t the air masses do not move. A front may become stationary if an air mass is stopped by a barrier, such as a mountain range.
A stationary front may bring days of rain, drizzle, and fog. Winds usually blow parallel to the front, but in opposite directions. After several days, the front will likely break apart. When a cold air mass takes the place of a warm air mass, there is a cold front.

- spring and summer: The air is unstable so thunderstorms or tornadoes may form.
- spring: If the temperature gradient is high, strong winds blow.
- autumn: Strong rains fall over a large area.
- winter: The cold air mass is likely to have formed in the frigid arctic so there are frigid temperatures and heavy snows.

Imagine that you are on the ground in the wintertime under a cold winter air mass with a warm front approaching. The transition from cold air to warm air takes place over a long distance so the first signs of changing weather appear long before the front is actually over you. Initially, the air is cold: the cold air mass is above you and the warm air mass is above it. High cirrus clouds mark the transition from one air mass to the other.
Over time, cirrus clouds become thicker and cirrostratus clouds form. As the front approaches, altocumulus and altostratus clouds appear and the sky turns gray. Since it is winter, snowflakes fall. The clouds thicken and nimbostratus clouds form. Snowfall increases. Winds grow stronger as the low pressure approaches. As the front gets closer, the cold air mass is just above you but the warm air mass is not too far above that. The weather worsens. As the warm air mass approaches, temperatures rise and snow turns to sleet and freezing rain. Warm and cold air mix at the front, leading to the formation of stratus clouds and fog.

Coriolis Effect curves the boundary where the two fronts meet towards the pole. If the air mass that arrives third is colder than either of the first two air masses, that air mass slip beneath them both. This is called a cold occlusion. If the air mass that arrives third is warm, that air mass rides over the other air mass. This is called a warm occlusion.
The weather at an occluded front is especially fierce right at the occlusion. Precipitation and shifting winds are typical. The Pacific Coast has frequent occluded fronts.

Thunderstorms

Thunderstorms are extremely common: Worldwide there are 14 million per year; that’s 40,000 per day! Most drop a lot of rain on a small area quickly, but some are severe and highly damaging. They form when ground temperatures are high, ordinarily in the late afternoon or early evening in spring and summer. The two figures below show two stages of thunderstorm buildup.
THUNDERSTORM GENESIS All thunderstorms go through a three-stage life cycle. The first stage is called the cumulus stage , where an air parcel is forced to rise, cool, and condense, called the lower condensation level, to develop into a cumulus cloud. The process of water vapor condensing into liquid water releases large quantities of latent heat, which makes the air within the cloud warmer, and unstable causing the cloud continues to grow upward like a hot air balloon. These rising air parcels, called updrafts, prevent precipitation from falling from the cloud. But once the precipitation becomes too heavy for the updrafts to hold up, the moisture begins to fall creating downdrafts within the cloud. The downdrafts also begin to pull cold, dry air from outside the cloud toward the ground in a process called entrainment .
Once the precipitation begins to fall from the cloud, the storm has reached the mature stage . During this stage, updrafts and downdrafts exist side-by-side and the cumulonimbus is called a cell . If the updrafts reach the top of the troposphere, the cumulus cloud will begin to spread outward creating a defined anvil . At the same time, the downdrafts spread within the cloud and at first make the cloud become wider, but eventually overtaking the updrafts. Cool downdrafts form when precipitation and the cool air from entrainment are dragged down to the lower regions of a thunderstorm. It is also during the mature stage when the storm is most intense producing strong, gusting winds, heavy precipitation, lightning, and possibly small hail.

Thunderstorms can form individually or in squall lines along a cold front. In the United States, squall lines form in spring and early summer in the Midwest where the maritime tropical (mT) air mass from the Gulf of Mexico meets the continental polar (cP) air mass from Canada.

An individual tornado strikes a small area, but it can destroy everything in its path. Most injuries and deaths from tornadoes are caused by flying debris. In the United States an average of 90 people are killed by tornadoes each year. The most violent two percent of tornadoes account for 70% of the deaths by tornadoes.
Tornadoes form at the front of severe thunderstorms. Lines of these thunderstorms form in the spring where where maritime tropical (mT) and continental polar (cP) air masses meet. Although there is an average of 770 tornadoes annually, the number of tornadoes each year varies greatly.
The entire region was alerted to the possibility of tornadoes in those late April days. But meteorologists can only predict tornado danger over a very wide region. No one can tell exactly where and when a tornado will touch down. Once a tornado is sighted on radar, its path is predicted and a warning is issued to people in that area. The exact path is unknown because tornado movement is not very predictable.
The intensity of tornadoes is measured on the Fujita Scale, which assigns a value based on wind speed and damage.

There are two types of cyclones: middle latitude (mid-latitude) cyclones and tropical cyclones. Mid-latitude cyclones are the main cause of winter storms in the middle latitudes. Tropical cyclones are also known as hurricanes.

The warm air at the cold front rises and creates a low pressure cell. Winds rush into the low pressure and create a rising column of air. The air twists, rotating counterclockwise in the Northern Hemisphere and clockwise in the Southern Hemisphere. Since the rising air is moist, rain or snow falls.
Mid-latitude cyclones form in winter in the mid-latitudes and move eastward with the westerly winds. These two- to five-day storms can reach 1,000 to 2,500 km (625 to 1,600 miles) in diameter and produce winds up to 125 km (75 miles) per hour. Like tropical cyclones, they can cause extensive beach erosion and flooding.

Hurricanes arise in the tropical latitudes (between 10 degrees and 25 degrees N) in summer and autumn when sea surface temperature are 28 degrees C (82 degrees F) or higher. The warm seas create a large humid air mass. The warm air rises and forms a low pressure cell, known as a tropical depression. Thunderstorms materialize around the tropical depression.
If the temperature reaches or exceeds 28 degrees C (82 degrees F) the air begins to rotate around the low pressure (counterclockwise in the Northern Hemisphere and clockwise in the Southern Hemisphere). As the air rises, water vapor condenses, releasing energy from latent heat. If wind shear is low, the storm builds into a hurricane within two to three days.
Hurricanes are huge with high winds. The exception is the relatively calm eye of the storm where air is rising upward. Rainfall can be as high as 2.5 cm (1″) per hour, resulting in about 20 billion metric tons of water released daily in a hurricane. The release of latent heat generates enormous amounts of energy, nearly the total annual electrical power consumption of the United States from one storm. Hurricanes can also generate tornadoes.
Hurricanes are strange creatures because they are deadly monsters, yet have a gentle, but cold heart. The anatomy of a hurricane is fairly simple, though the processes involved are quite complex. As a low pressure disturbance forms, the warm, moist air rushes towards the low pressure in order to rise upward to form towering thunderstorms. Around the low pressure disturbance is a wall of clouds called an eye wall . Within the eye wall, the wind speeds are greatest, the clouds are the tallest, atmospheric pressure is at its lowest, and precipitation is most intense.
At the center or heart of the hurricane is called the eye . Within the eye of a hurricane, winds are light, precipitation is minimal, and occasionally the skies above are clear. It is the calm region of the tropical storm, but that is what makes it so dangerous. Many people tend to go outside as the eye moves overhead because they believe the storm is over. But what some don’t realize is that “round two” is coming from behind.
Moving away from the eye wall are organized, intense thunderstorms, called spiral rain bands , that rotate around and toward the storm’s eye wall. These rain bands are the first

Damage from hurricanes comes from the high winds, rainfall, and storm surge. Storm surge occurs as the storm’s low pressure center comes onto land, causing the sea level to rise unusually high. A storm surge is often made worse by the hurricane’s high winds blowing seawater across the ocean onto the shoreline. Flooding can be devastating, especially along low-lying coastlines such as the Atlantic and Gulf Coasts. Hurricane Camille in 1969 had a 7.3 m (24 foot) storm surge that traveled 125 miles (200 km) inland.
Hurricanes typically last for 5 to 10 days. Over cooler water or land, the hurricane’s latent heat source shut downs and the storm weakens. When a hurricane disintegrates, it is replaced with intense rains and tornadoes.
There are about 100 hurricanes around the world each year, plus many smaller tropical storms and tropical depressions. As people develop coastal regions, property damage from storms continues to rise. However, scientists are becoming better at predicting the paths of these storms and fatalities are decreasing. There is, however, one major exception to the previous statement: Hurricane Katrina.

- Temperatures below –7 degrees C (20 degrees F); –12oC (10 degrees F) for a severe blizzard.
- Winds greater than 56 kmh (35 mph); 72 kmh (45 mph) for a severe blizzard.
- Snow so heavy that visibility is 2/5 km (1/4 mile) or less for at least three hours; near zero visibility for a severe blizzard.
Blizzards happen across the middle latitudes and toward the poles, usually as part of a mid-latitude cyclone. Blizzards are most common in winter, when the jet stream has traveled south and a cold, northern air mass comes into contact with a warmer, semitropical air mass. The very strong winds develop because of the pressure gradient between the low pressure storm and the higher pressure west of the storm. Snow produced by the storm gets caught in the winds and blows nearly horizontally. Blizzards can also produce sleet or freezing rain .

What do you think caused the heat wave in the image below? A high pressure zone kept the jet stream further north than normal for August.
Collecting Weather Data
To make a weather forecast, the conditions of the atmosphere must be known for that location and for the surrounding area. Temperature, air pressure, and other characteristics of the atmosphere must be measured and the data collected.

Some modern thermometers use a coiled strip composed of two kinds of metal, each of which conducts heat differently. As the temperature rises and falls, the coil unfolds or curls up tighter. Other modern thermometers measure infrared radiation or electrical resistance. Modern thermometers usually produce digital data that can be fed directly into a computer.

Just like the weather satellites on the news, you’ve seen these images often when you are looking at natural disasters like hurricanes or volcanic eruptions, wars like have occurred in Afghanistan, Iraq, or recently in Syria. Even the Malaysian flight that “disappeared” in the Indian Ocean for weeks was ultimately discovered using polar orbiting satellites. Common types of these satellites include: Landsat , MODIS , and the Tropical Rainfall Measuring Mission (TRMM).

In Numerical Weather Prediction (NWP), atmospheric data from many sources are plugged into supercomputers running complex mathematical models. The models then calculate what will happen over time at various altitudes for a grid of evenly spaced locations. The grid points are usually between 10 and 200 kilometers apart. Using the results calculated by the model, the program projects weather further into the future. It then uses these results to project the weather still further into the future, as far as the meteorologists want to go. Once a forecast is made, it is broadcast by satellites to more than 1,000 sites around the world.

- Isotherms , likes connecting points of equal temperature. They spatially show temperature gradients and can indicate the location of a front. In terms of precipitation, what does the 0oC (32oF) isotherm show?
- Isobars are lines of equal average air pressure at sea level. Closed isobars represent the locations of high and low pressure cells.
- Isotachs are lines of constant wind speed. Where the minimum values occur high in the atmosphere, tropical cyclones may develop. The highest wind speeds can be used to locate the jet stream.
- Provided by : Open Geography. Located at : http://www.opengeography.org/ch-11-weather.html . License : CC BY: Attribution
- Search Menu
Sign in through your institution
- Browse content in Arts and Humanities
- Browse content in Archaeology
- Anglo-Saxon and Medieval Archaeology
- Archaeological Methodology and Techniques
- Archaeology by Region
- Archaeology of Religion
- Archaeology of Trade and Exchange
- Biblical Archaeology
- Contemporary and Public Archaeology
- Environmental Archaeology
- Historical Archaeology
- History and Theory of Archaeology
- Industrial Archaeology
- Landscape Archaeology
- Mortuary Archaeology
- Prehistoric Archaeology
- Underwater Archaeology
- Zooarchaeology
- Browse content in Architecture
- Architectural Structure and Design
- History of Architecture
- Residential and Domestic Buildings
- Theory of Architecture
- Browse content in Art
- Art Subjects and Themes
- History of Art
- Industrial and Commercial Art
- Theory of Art
- Biographical Studies
- Byzantine Studies
- Browse content in Classical Studies
- Classical History
- Classical Philosophy
- Classical Mythology
- Classical Literature
- Classical Reception
- Classical Art and Architecture
- Classical Oratory and Rhetoric
- Greek and Roman Papyrology
- Greek and Roman Epigraphy
- Greek and Roman Law
- Greek and Roman Archaeology
- Late Antiquity
- Religion in the Ancient World
- Digital Humanities
- Browse content in History
- Colonialism and Imperialism
- Diplomatic History
- Environmental History
- Genealogy, Heraldry, Names, and Honours
- Genocide and Ethnic Cleansing
- Historical Geography
- History by Period
- History of Emotions
- History of Agriculture
- History of Education
- History of Gender and Sexuality
- Industrial History
- Intellectual History
- International History
- Labour History
- Legal and Constitutional History
- Local and Family History
- Maritime History
- Military History
- National Liberation and Post-Colonialism
- Oral History
- Political History
- Public History
- Regional and National History
- Revolutions and Rebellions
- Slavery and Abolition of Slavery
- Social and Cultural History
- Theory, Methods, and Historiography
- Urban History
- World History
- Browse content in Language Teaching and Learning
- Language Learning (Specific Skills)
- Language Teaching Theory and Methods
- Browse content in Linguistics
- Applied Linguistics
- Cognitive Linguistics
- Computational Linguistics
- Forensic Linguistics
- Grammar, Syntax and Morphology
- Historical and Diachronic Linguistics
- History of English
- Language Evolution
- Language Reference
- Language Acquisition
- Language Variation
- Language Families
- Lexicography
- Linguistic Anthropology
- Linguistic Theories
- Linguistic Typology
- Phonetics and Phonology
- Psycholinguistics
- Sociolinguistics
- Translation and Interpretation
- Writing Systems
- Browse content in Literature
- Bibliography
- Children's Literature Studies
- Literary Studies (Romanticism)
- Literary Studies (American)
- Literary Studies (Asian)
- Literary Studies (European)
- Literary Studies (Eco-criticism)
- Literary Studies (Modernism)
- Literary Studies - World
- Literary Studies (1500 to 1800)
- Literary Studies (19th Century)
- Literary Studies (20th Century onwards)
- Literary Studies (African American Literature)
- Literary Studies (British and Irish)
- Literary Studies (Early and Medieval)
- Literary Studies (Fiction, Novelists, and Prose Writers)
- Literary Studies (Gender Studies)
- Literary Studies (Graphic Novels)
- Literary Studies (History of the Book)
- Literary Studies (Plays and Playwrights)
- Literary Studies (Poetry and Poets)
- Literary Studies (Postcolonial Literature)
- Literary Studies (Queer Studies)
- Literary Studies (Science Fiction)
- Literary Studies (Travel Literature)
- Literary Studies (War Literature)
- Literary Studies (Women's Writing)
- Literary Theory and Cultural Studies
- Mythology and Folklore
- Shakespeare Studies and Criticism
- Browse content in Media Studies
- Browse content in Music
- Applied Music
- Dance and Music
- Ethics in Music
- Ethnomusicology
- Gender and Sexuality in Music
- Medicine and Music
- Music Cultures
- Music and Media
- Music and Religion
- Music and Culture
- Music Education and Pedagogy
- Music Theory and Analysis
- Musical Scores, Lyrics, and Libretti
- Musical Structures, Styles, and Techniques
- Musicology and Music History
- Performance Practice and Studies
- Race and Ethnicity in Music
- Sound Studies
- Browse content in Performing Arts
- Browse content in Philosophy
- Aesthetics and Philosophy of Art
- Epistemology
- Feminist Philosophy
- History of Western Philosophy
- Metaphysics
- Moral Philosophy
- Non-Western Philosophy
- Philosophy of Language
- Philosophy of Mind
- Philosophy of Perception
- Philosophy of Science
- Philosophy of Action
- Philosophy of Law
- Philosophy of Religion
- Philosophy of Mathematics and Logic
- Practical Ethics
- Social and Political Philosophy
- Browse content in Religion
- Biblical Studies
- Christianity
- East Asian Religions
- History of Religion
- Judaism and Jewish Studies
- Qumran Studies
- Religion and Education
- Religion and Health
- Religion and Politics
- Religion and Science
- Religion and Law
- Religion and Art, Literature, and Music
- Religious Studies
- Browse content in Society and Culture
- Cookery, Food, and Drink
- Cultural Studies
- Customs and Traditions
- Ethical Issues and Debates
- Hobbies, Games, Arts and Crafts
- Natural world, Country Life, and Pets
- Popular Beliefs and Controversial Knowledge
- Sports and Outdoor Recreation
- Technology and Society
- Travel and Holiday
- Visual Culture
- Browse content in Law
- Arbitration
- Browse content in Company and Commercial Law
- Commercial Law
- Company Law
- Browse content in Comparative Law
- Systems of Law
- Competition Law
- Browse content in Constitutional and Administrative Law
- Government Powers
- Judicial Review
- Local Government Law
- Military and Defence Law
- Parliamentary and Legislative Practice
- Construction Law
- Contract Law
- Browse content in Criminal Law
- Criminal Procedure
- Criminal Evidence Law
- Sentencing and Punishment
- Employment and Labour Law
- Environment and Energy Law
- Browse content in Financial Law
- Banking Law
- Insolvency Law
- History of Law
- Human Rights and Immigration
- Intellectual Property Law
- Browse content in International Law
- Private International Law and Conflict of Laws
- Public International Law
- IT and Communications Law
- Jurisprudence and Philosophy of Law
- Law and Politics
- Law and Society
- Browse content in Legal System and Practice
- Courts and Procedure
- Legal Skills and Practice
- Primary Sources of Law
- Regulation of Legal Profession
- Medical and Healthcare Law
- Browse content in Policing
- Criminal Investigation and Detection
- Police and Security Services
- Police Procedure and Law
- Police Regional Planning
- Browse content in Property Law
- Personal Property Law
- Study and Revision
- Terrorism and National Security Law
- Browse content in Trusts Law
- Wills and Probate or Succession
- Browse content in Medicine and Health
- Browse content in Allied Health Professions
- Arts Therapies
- Clinical Science
- Dietetics and Nutrition
- Occupational Therapy
- Operating Department Practice
- Physiotherapy
- Radiography
- Speech and Language Therapy
- Browse content in Anaesthetics
- General Anaesthesia
- Neuroanaesthesia
- Clinical Neuroscience
- Browse content in Clinical Medicine
- Acute Medicine
- Cardiovascular Medicine
- Clinical Genetics
- Clinical Pharmacology and Therapeutics
- Dermatology
- Endocrinology and Diabetes
- Gastroenterology
- Genito-urinary Medicine
- Geriatric Medicine
- Infectious Diseases
- Medical Toxicology
- Medical Oncology
- Pain Medicine
- Palliative Medicine
- Rehabilitation Medicine
- Respiratory Medicine and Pulmonology
- Rheumatology
- Sleep Medicine
- Sports and Exercise Medicine
- Community Medical Services
- Critical Care
- Emergency Medicine
- Forensic Medicine
- Haematology
- History of Medicine
- Browse content in Medical Skills
- Clinical Skills
- Communication Skills
- Nursing Skills
- Surgical Skills
- Browse content in Medical Dentistry
- Oral and Maxillofacial Surgery
- Paediatric Dentistry
- Restorative Dentistry and Orthodontics
- Surgical Dentistry
- Medical Ethics
- Medical Statistics and Methodology
- Browse content in Neurology
- Clinical Neurophysiology
- Neuropathology
- Nursing Studies
- Browse content in Obstetrics and Gynaecology
- Gynaecology
- Occupational Medicine
- Ophthalmology
- Otolaryngology (ENT)
- Browse content in Paediatrics
- Neonatology
- Browse content in Pathology
- Chemical Pathology
- Clinical Cytogenetics and Molecular Genetics
- Histopathology
- Medical Microbiology and Virology
- Patient Education and Information
- Browse content in Pharmacology
- Psychopharmacology
- Browse content in Popular Health
- Caring for Others
- Complementary and Alternative Medicine
- Self-help and Personal Development
- Browse content in Preclinical Medicine
- Cell Biology
- Molecular Biology and Genetics
- Reproduction, Growth and Development
- Primary Care
- Professional Development in Medicine
- Browse content in Psychiatry
- Addiction Medicine
- Child and Adolescent Psychiatry
- Forensic Psychiatry
- Learning Disabilities
- Old Age Psychiatry
- Psychotherapy
- Browse content in Public Health and Epidemiology
- Epidemiology
- Public Health
- Browse content in Radiology
- Clinical Radiology
- Interventional Radiology
- Nuclear Medicine
- Radiation Oncology
- Reproductive Medicine
- Browse content in Surgery
- Cardiothoracic Surgery
- Gastro-intestinal and Colorectal Surgery
- General Surgery
- Neurosurgery
- Paediatric Surgery
- Peri-operative Care
- Plastic and Reconstructive Surgery
- Surgical Oncology
- Transplant Surgery
- Trauma and Orthopaedic Surgery
- Vascular Surgery
- Browse content in Science and Mathematics
- Browse content in Biological Sciences
- Aquatic Biology
- Biochemistry
- Bioinformatics and Computational Biology
- Developmental Biology
- Ecology and Conservation
- Evolutionary Biology
- Genetics and Genomics
- Microbiology
- Molecular and Cell Biology
- Natural History
- Plant Sciences and Forestry
- Research Methods in Life Sciences
- Structural Biology
- Systems Biology
- Zoology and Animal Sciences
- Browse content in Chemistry
- Analytical Chemistry
- Computational Chemistry
- Crystallography
- Environmental Chemistry
- Industrial Chemistry
- Inorganic Chemistry
- Materials Chemistry
- Medicinal Chemistry
- Mineralogy and Gems
- Organic Chemistry
- Physical Chemistry
- Polymer Chemistry
- Study and Communication Skills in Chemistry
- Theoretical Chemistry
- Browse content in Computer Science
- Artificial Intelligence
- Computer Architecture and Logic Design
- Game Studies
- Human-Computer Interaction
- Mathematical Theory of Computation
- Programming Languages
- Software Engineering
- Systems Analysis and Design
- Virtual Reality
- Browse content in Computing
- Business Applications
- Computer Security
- Computer Games
- Computer Networking and Communications
- Digital Lifestyle
- Graphical and Digital Media Applications
- Operating Systems
- Browse content in Earth Sciences and Geography
- Atmospheric Sciences
- Environmental Geography
- Geology and the Lithosphere
- Maps and Map-making
- Meteorology and Climatology
- Oceanography and Hydrology
- Palaeontology
- Physical Geography and Topography
- Regional Geography
- Soil Science
- Urban Geography
- Browse content in Engineering and Technology
- Agriculture and Farming
- Biological Engineering
- Civil Engineering, Surveying, and Building
- Electronics and Communications Engineering
- Energy Technology
- Engineering (General)
- Environmental Science, Engineering, and Technology
- History of Engineering and Technology
- Mechanical Engineering and Materials
- Technology of Industrial Chemistry
- Transport Technology and Trades
- Browse content in Environmental Science
- Applied Ecology (Environmental Science)
- Conservation of the Environment (Environmental Science)
- Environmental Sustainability
- Environmentalist Thought and Ideology (Environmental Science)
- Management of Land and Natural Resources (Environmental Science)
- Natural Disasters (Environmental Science)
- Nuclear Issues (Environmental Science)
- Pollution and Threats to the Environment (Environmental Science)
- Social Impact of Environmental Issues (Environmental Science)
- History of Science and Technology
- Browse content in Materials Science
- Ceramics and Glasses
- Composite Materials
- Metals, Alloying, and Corrosion
- Nanotechnology
- Browse content in Mathematics
- Applied Mathematics
- Biomathematics and Statistics
- History of Mathematics
- Mathematical Education
- Mathematical Finance
- Mathematical Analysis
- Numerical and Computational Mathematics
- Probability and Statistics
- Pure Mathematics
- Browse content in Neuroscience
- Cognition and Behavioural Neuroscience
- Development of the Nervous System
- Disorders of the Nervous System
- History of Neuroscience
- Invertebrate Neurobiology
- Molecular and Cellular Systems
- Neuroendocrinology and Autonomic Nervous System
- Neuroscientific Techniques
- Sensory and Motor Systems
- Browse content in Physics
- Astronomy and Astrophysics
- Atomic, Molecular, and Optical Physics
- Biological and Medical Physics
- Classical Mechanics
- Computational Physics
- Condensed Matter Physics
- Electromagnetism, Optics, and Acoustics
- History of Physics
- Mathematical and Statistical Physics
- Measurement Science
- Nuclear Physics
- Particles and Fields
- Plasma Physics
- Quantum Physics
- Relativity and Gravitation
- Semiconductor and Mesoscopic Physics
- Browse content in Psychology
- Affective Sciences
- Clinical Psychology
- Cognitive Psychology
- Cognitive Neuroscience
- Criminal and Forensic Psychology
- Developmental Psychology
- Educational Psychology
- Evolutionary Psychology
- Health Psychology
- History and Systems in Psychology
- Music Psychology
- Neuropsychology
- Organizational Psychology
- Psychological Assessment and Testing
- Psychology of Human-Technology Interaction
- Psychology Professional Development and Training
- Research Methods in Psychology
- Social Psychology
- Browse content in Social Sciences
- Browse content in Anthropology
- Anthropology of Religion
- Human Evolution
- Medical Anthropology
- Physical Anthropology
- Regional Anthropology
- Social and Cultural Anthropology
- Theory and Practice of Anthropology
- Browse content in Business and Management
- Business Ethics
- Business Strategy
- Business History
- Business and Technology
- Business and Government
- Business and the Environment
- Comparative Management
- Corporate Governance
- Corporate Social Responsibility
- Entrepreneurship
- Health Management
- Human Resource Management
- Industrial and Employment Relations
- Industry Studies
- Information and Communication Technologies
- International Business
- Knowledge Management
- Management and Management Techniques
- Operations Management
- Organizational Theory and Behaviour
- Pensions and Pension Management
- Public and Nonprofit Management
- Strategic Management
- Supply Chain Management
- Browse content in Criminology and Criminal Justice
- Criminal Justice
- Criminology
- Forms of Crime
- International and Comparative Criminology
- Youth Violence and Juvenile Justice
- Development Studies
- Browse content in Economics
- Agricultural, Environmental, and Natural Resource Economics
- Asian Economics
- Behavioural Finance
- Behavioural Economics and Neuroeconomics
- Econometrics and Mathematical Economics
- Economic History
- Economic Systems
- Economic Methodology
- Economic Development and Growth
- Financial Markets
- Financial Institutions and Services
- General Economics and Teaching
- Health, Education, and Welfare
- History of Economic Thought
- International Economics
- Labour and Demographic Economics
- Law and Economics
- Macroeconomics and Monetary Economics
- Microeconomics
- Public Economics
- Urban, Rural, and Regional Economics
- Welfare Economics
- Browse content in Education
- Adult Education and Continuous Learning
- Care and Counselling of Students
- Early Childhood and Elementary Education
- Educational Equipment and Technology
- Educational Strategies and Policy
- Higher and Further Education
- Organization and Management of Education
- Philosophy and Theory of Education
- Schools Studies
- Secondary Education
- Teaching of a Specific Subject
- Teaching of Specific Groups and Special Educational Needs
- Teaching Skills and Techniques
- Browse content in Environment
- Applied Ecology (Social Science)
- Climate Change
- Conservation of the Environment (Social Science)
- Environmentalist Thought and Ideology (Social Science)
- Natural Disasters (Environment)
- Social Impact of Environmental Issues (Social Science)
- Browse content in Human Geography
- Cultural Geography
- Economic Geography
- Political Geography
- Browse content in Interdisciplinary Studies
- Communication Studies
- Museums, Libraries, and Information Sciences
- Browse content in Politics
- African Politics
- Asian Politics
- Chinese Politics
- Comparative Politics
- Conflict Politics
- Elections and Electoral Studies
- Environmental Politics
- European Union
- Foreign Policy
- Gender and Politics
- Human Rights and Politics
- Indian Politics
- International Relations
- International Organization (Politics)
- International Political Economy
- Irish Politics
- Latin American Politics
- Middle Eastern Politics
- Political Behaviour
- Political Economy
- Political Institutions
- Political Methodology
- Political Communication
- Political Philosophy
- Political Sociology
- Political Theory
- Politics and Law
- Politics of Development
- Public Policy
- Public Administration
- Quantitative Political Methodology
- Regional Political Studies
- Russian Politics
- Security Studies
- State and Local Government
- UK Politics
- US Politics
- Browse content in Regional and Area Studies
- African Studies
- Asian Studies
- East Asian Studies
- Japanese Studies
- Latin American Studies
- Middle Eastern Studies
- Native American Studies
- Scottish Studies
- Browse content in Research and Information
- Research Methods
- Browse content in Social Work
- Addictions and Substance Misuse
- Adoption and Fostering
- Care of the Elderly
- Child and Adolescent Social Work
- Couple and Family Social Work
- Direct Practice and Clinical Social Work
- Emergency Services
- Human Behaviour and the Social Environment
- International and Global Issues in Social Work
- Mental and Behavioural Health
- Social Justice and Human Rights
- Social Policy and Advocacy
- Social Work and Crime and Justice
- Social Work Macro Practice
- Social Work Practice Settings
- Social Work Research and Evidence-based Practice
- Welfare and Benefit Systems
- Browse content in Sociology
- Childhood Studies
- Community Development
- Comparative and Historical Sociology
- Economic Sociology
- Gender and Sexuality
- Gerontology and Ageing
- Health, Illness, and Medicine
- Marriage and the Family
- Migration Studies
- Occupations, Professions, and Work
- Organizations
- Population and Demography
- Race and Ethnicity
- Social Theory
- Social Movements and Social Change
- Social Research and Statistics
- Social Stratification, Inequality, and Mobility
- Sociology of Religion
- Sociology of Education
- Sport and Leisure
- Urban and Rural Studies
- Browse content in Warfare and Defence
- Defence Strategy, Planning, and Research
- Land Forces and Warfare
- Military Administration
- Military Life and Institutions
- Naval Forces and Warfare
- Other Warfare and Defence Issues
- Peace Studies and Conflict Resolution
- Weapons and Equipment

- < Previous chapter
- Next chapter >
5 (page 69) p. 69 Weather systems
- Published: January 2017
- Cite Icon Cite
- Permissions Icon Permissions
At temperate latitudes, such as those of the British Isles, the most significant changes in the weather, with major changes in wind strength and direction, as well as rainfall, are associated with the passage of depressions (low-pressure systems), more formally known as extratropical cyclones. ‘Weather systems’ describes the development of depressions, the different features within them (the warm front, the warm sector, the cold front, and the occluded front), and the likely weather produced. It also looks at isolated fronts, the sudden deepening of depressions, thermal and polar lows, atmospheric rivers, and the much quieter weather of high-pressure systems.
Signed in as
Institutional accounts.
- Google Scholar Indexing
- GoogleCrawler [DO NOT DELETE]
Personal account
- Sign in with email/username & password
- Get email alerts
- Save searches
- Purchase content
- Activate your purchase/trial code
- Add your ORCID iD
Institutional access
Sign in with a library card.
- Sign in with username/password
- Recommend to your librarian
- Institutional account management
- Get help with access
Access to content on Oxford Academic is often provided through institutional subscriptions and purchases. If you are a member of an institution with an active account, you may be able to access content in one of the following ways:
IP based access
Typically, access is provided across an institutional network to a range of IP addresses. This authentication occurs automatically, and it is not possible to sign out of an IP authenticated account.
Choose this option to get remote access when outside your institution. Shibboleth/Open Athens technology is used to provide single sign-on between your institution’s website and Oxford Academic.
- Click Sign in through your institution.
- Select your institution from the list provided, which will take you to your institution's website to sign in.
- When on the institution site, please use the credentials provided by your institution. Do not use an Oxford Academic personal account.
- Following successful sign in, you will be returned to Oxford Academic.
If your institution is not listed or you cannot sign in to your institution’s website, please contact your librarian or administrator.
Enter your library card number to sign in. If you cannot sign in, please contact your librarian.
Society Members
Society member access to a journal is achieved in one of the following ways:
Sign in through society site
Many societies offer single sign-on between the society website and Oxford Academic. If you see ‘Sign in through society site’ in the sign in pane within a journal:
- Click Sign in through society site.
- When on the society site, please use the credentials provided by that society. Do not use an Oxford Academic personal account.
If you do not have a society account or have forgotten your username or password, please contact your society.
Sign in using a personal account
Some societies use Oxford Academic personal accounts to provide access to their members. See below.
A personal account can be used to get email alerts, save searches, purchase content, and activate subscriptions.
Some societies use Oxford Academic personal accounts to provide access to their members.
Viewing your signed in accounts
Click the account icon in the top right to:
- View your signed in personal account and access account management features.
- View the institutional accounts that are providing access.
Signed in but can't access content
Oxford Academic is home to a wide variety of products. The institutional subscription may not cover the content that you are trying to access. If you believe you should have access to that content, please contact your librarian.
For librarians and administrators, your personal account also provides access to institutional account management. Here you will find options to view and activate subscriptions, manage institutional settings and access options, access usage statistics, and more.
Our books are available by subscription or purchase to libraries and institutions.
- About Oxford Academic
- Publish journals with us
- University press partners
- What we publish
- New features
- Open access
- Rights and permissions
- Accessibility
- Advertising
- Media enquiries
- Oxford University Press
- Oxford Languages
- University of Oxford
Oxford University Press is a department of the University of Oxford. It furthers the University's objective of excellence in research, scholarship, and education by publishing worldwide
- Copyright © 2024 Oxford University Press
- Cookie settings
- Cookie policy
- Privacy policy
- Legal notice
This Feature Is Available To Subscribers Only
Sign In or Create an Account
This PDF is available to Subscribers Only
For full access to this pdf, sign in to an existing account, or purchase an annual subscription.
The Science and Art of Meteorology
Meteorology is the study of the atmosphere.
Earth Science, Astronomy, Meteorology, Geography, Physical Geography
Loading ...
Meteorology is the study of the atmosphere, atmospheric phenomena , and atmospheric effects on our weather . The atmosphere is the gaseous layer of the physical environment that surrounds a planet. Earth’s atmosphere is roughly 100 to 125 kilometers (65-75 miles) thick. Gravity keeps the atmosphere from expanding much farther. Meteorology is a sub discipline of the atmospheric sciences , a term that covers all studies of the atmosphere. A subdiscipline is a specialized field of study within a broader subject or discipline. Climatology and aeronomy are also subdisciplines of the atmospheric sciences. Climatology focuses on how atmospheric changes define and alter the world’s climates . Aeronomy is the study of the upper parts of the atmosphere, where unique chemical and physical processes occur. Meteorology focuses on the lower parts of the atmosphere, primarily the troposphere , where most weather takes place. Meteorologists use scientific principles to observe, explain, and forecast our weather. They often focus on atmospheric research or operational weather forecasting. Research meteorologists cover several subdisciplines of meteorology to include: climate modeling , remote sensing, air quality, atmospheric physics, and climate change. They also research the relationship between the atmosphere and Earth’s climates, oceans, and biological life. Forecasters use that research, along with atmospheric data, to scientifically assess the current state of the atmosphere and make predictions of its future state. Atmospheric conditions both at Earth's surface and above are measured from a variety of sources: weather stations, ships, buoys, aircraft, radar , weather balloons, and satellites . This data is transmitted to centers throughout the world that produce computer analyses of global weather. The analyses are passed on to national and regional weather centers, which feed this data into computers that model the future state of the atmosphere. This transfer of information demonstrates how weather and the study of it take place in multiple, interconnected ways. Scales of Meteorology Weather occurs at different scales of space and time. The four meteorological scales are: microscale, mesoscale, synoptic scale, and global scale. Meteorologists often focus on a specific scale in their work. Microscale Meteorology Microscale meteorology focuses on phenomena that range in size from a few centimeters to a few kilometers, and that have short life spans (less than a day). These phenomena affect very small geographic areas, and the temperatures and terrains of those areas. Microscale meteorologists often study the processes that occur between soil, vegetation , and surface water near ground level. They measure the transfer of heat, gas, and liquid between these surfaces. Microscale meteorology often involves the study of chemistry. Tracking air pollutants is an example of microscale meteorology. MIRAGE-Mexico is a collaboration between meteorologists in the United States and Mexico. The program studies the chemical and physical transformations of gases and aerosols in the pollution surrounding Mexico City. MIRAGE-Mexico uses observations from ground stations , aircraft, and satellites to track pollutants.
Mesoscale Meteorology Mesoscale phenomena range in size from a few kilometers to roughly 1,000 kilometers (620 miles). Two important phenomena are mesoscale convective complexes (MCC) and mesoscale convective systems (MCS). Both are caused by convection , an important meteorological principle. Convection is a process of circulation . Warmer, less- dense fluid rises, and colder, denser fluid sinks. The fluid that most meteorologists study is air. (Any substance that flows is considered a fluid.) Convection results in a transfer of energy, heat, and moisture—the basic building blocks of weather. In both an MCC and MCS, a large area of air and moisture is warmed during the middle of the day—when the sun angle is at its highest. As this warm air mass rises into the colder atmosphere, it condenses into clouds , turning water vapor into precipitation . An MCC is a single system of clouds that can reach the size of the state of Ohio and produce heavy rainfall and flooding. An MCS is a smaller cluster of thunderstorms that lasts for several hours. Both react to unique transfers of energy, heat, and moisture caused by convection. The Deep Convective Clouds and Chemistry (DC3) field campaign is a program that will study storms and thunderclouds in Colorado, Alabama, and Oklahoma. This project will consider how convection influences the formation and movement of storms, including the development of lightning. It will also study their impact on aircraft and flight patterns. The DC3 program will use data gathered from research aircraft able to fly over the tops of storms. Synoptic Scale Meteorology Synoptic-scale phenomena cover an area of several hundred or even thousands of kilometers. High- and low-pressure systems seen on local weather forecasts, are synoptic in scale. Pressure, much like convection, is an important meteorological principle that is at the root of large-scale weather systems as diverse as hurricanes and bitter cold outbreaks. Low-pressure systems occur where the atmospheric pressure at the surface of Earth is less than its surrounding environment. Wind and moisture from areas with higher pressure seek low-pressure systems. This movement, in conjunction with the Coriolis force and friction, causes the system to rotate counter-clockwise in the Northern Hemisphere and clockwise in the Southern Hemisphere, creating a cyclone . Cyclones have a tendency for upward vertical motion. This allows moist air from the surrounding area to rise, expand and condense into water vapor, forming clouds. This movement of moisture and air causes the majority of our weather events. Hurricanes are a result of low-pressure systems (cyclones) developing over tropical waters in the Western Hemisphere. The system sucks up massive amounts of warm moisture from the sea, causing convection to take place, which in turn causes wind speeds to increase and pressure to fall. When these winds reach speeds over 119 kilometers per hour (74 miles per hour), the cyclone is classified as a hurricane. Hurricanes can be one of the most devastating natural disasters in the Western Hemisphere. The National Hurricane Center , in Miami, Florida, regularly issues forecasts and reports on all tropical weather systems. During hurricane season, hurricane specialists issue forecasts and warnings for every tropical storm in the western tropical Atlantic and eastern tropical Pacific. Businesses and government officials from the United States, the Caribbean, Central America, and South America rely on forecasts from the National Hurricane Center.
High-pressure systems occur where the atmospheric pressure at the surface of Earth is greater than its surrounding environment. This pressure has a tendency for downward vertical motion, allowing for dry air and clear skies. Extremely cold temperatures are a result of high-pressure systems that develop over the Arctic and move over the Northern Hemisphere. Arctic air is very cold because it develops over ice and snow-covered ground. This cold air is so dense that it pushes against Earth’s surface with extreme pressure, preventing any moisture or heat from staying within the system. Meteorologists have identified many semi-permanent areas of high-pressure. The Azores high, for instance, is a relatively stable region of high pressure around the Azores, an archipelago in the mid-Atlantic Ocean. The Azores high is responsible for arid temperatures of the Mediterranean basin , as well as summer heat waves in Western Europe. Global Scale Meteorology Global scale phenomena are weather patterns related to the transport of heat, wind, and moisture from the tropics to the poles. An important pattern is global atmospheric circulation , the large-scale movement of air that helps distribute thermal energy (heat) across the surface of the Earth. Global atmospheric circulation is the fairly constant movement of winds across the globe. Winds develop as air masses move from areas of high pressure to areas of low pressure. Global atmospheric circulation is largely driven by Hadley cells . Hadley cells are tropical and equatorial convection patterns. Convection drives warm air high in the atmosphere, while cool, dense air pushes lower in a constant loop. Each loop is a Hadley cell. Hadley cells determine the flow of trade winds , which meteorologists forecast. Businesses, especially those exporting products across oceans, pay close attention to the strength of trade winds because they help ships travel faster. Westerlies are winds that blow from the west in the midlatitudes . Closer to the Equator, trade winds blow from the northeast (north of the Equator) and the southeast (south of the Equator). Meteorologists study long-term climate patterns that disrupt global atmospheric circulation. Meteorologists discovered the pattern of El Nino, for instance. El Niño involves ocean currents and trade winds across the Pacific Ocean. El Niño occurs roughly every five years, disrupting global atmospheric circulation and affecting local weather and economies from Australia to Peru. El Niño is linked with changes in air pressure in the Pacific Ocean known as the Southern Oscillation . Air pressure drops over the eastern Pacific, near the coast of the Americas, while air pressure rises over the western Pacific, near the coasts of Australia and Indonesia. Trade winds weaken. Eastern Pacific nations experience extreme rainfall. Warm ocean currents reduce fish stocks , which depend on nutrient-rich upwelling of cold water to thrive. Western Pacific nations experience drought , devastating agricultural production. Understanding the meteorological processes of El Niño helps farmers, fishers, and coastal residents prepare for the climate pattern.
History of Meteorology The development of meteorology is deeply connected to developments in science, math, and technology. The Greek philosopher Aristotle wrote the first major study of the atmosphere around 340 B.C.E. Many of Aristotle’s ideas were incorrect, however, because he did not believe it was necessary to make scientific observations. A growing belief in the scientific method profoundly changed the study of meteorology in the 17th and 18th centuries. Evangelista Torricelli, an Italian physicist , observed that changes in air pressure were connected to changes in weather. In 1643, Torricelli invented the barometer , to accurately measure the pressure of air. The barometer is still a key instrument in understanding and forecasting weather systems. In 1714, Daniel Fahrenheit, a German physicist, developed the mercury thermometer. These instruments made it possible to accurately measure two important atmospheric variables. There was no way to quickly transfer weather data until the invention of the telegraph by American inventor Samuel Morse in the mid-1800s. Using this new technology, meteorological offices were able to share information and produce the first modern weather maps. These maps combined and displayed more complex sets of information such as isobars (lines of equal air pressure) and isotherms (lines of equal temperature). With these large-scale weather maps, meteorologists could examine a broader geographic picture of weather and make more accurate forecasts. In the 1920s, a group of Norwegian meteorologists developed the concepts of air masses and fronts that are the building blocks of modern weather forecasting. Using basic laws of physics, these meteorologists discovered that huge cold and warm air masses move and meet in patterns that are the root of many weather systems. Military operations during World War I and World War II brought great advances to meteorology. The success of these operations was highly dependent on weather over vast regions of the globe. The military invested heavily in training, research, and new technologies to improve their understanding of weather. The most important of these new technologies was radar, which was developed to detect the presence, direction, and speed of aircraft and ships. Since the end of World War II, radar has been used and improved to detect the presence, direction, and speed of precipitation and wind patterns. The technological developments of the 1950s and 1960s made it easier and faster for meteorologists to observe and predict weather systems on a massive scale. During the 1950s, computers created the first models of atmospheric conditions by running hundreds of data points through complex equations. These models were able to predict large-scale weather, such as the series of high- and low-pressure systems that circle our planet. TIROS I, the first meteorological satellite, provided the first accurate weather forecast from space in 1962. The success of TIROS I prompted the creation of more sophisticated satellites. Their ability to collect and transmit data with extreme accuracy and speed has made them indispensable to meteorologists. Advanced satellites and the computers that process their data are the primary tools used in meteorology today. Meteorology Today Today’s meteorologists have a variety of tools that help them examine, describe, model, and predict weather systems. These technologies are being applied at different meteorological scales, improving forecast accuracy and efficiency. Radar is an important remote sensing technology used in forecasting. A radar dish is an active sensor in that it sends out radio waves that bounce off particles in the atmosphere and return to the dish. A computer processes these pulses and determines the horizontal dimension of clouds and precipitation, and the speed and direction in which these clouds are moving. A new technology, known as dual-polarization radar , transmits both horizontal and vertical radio wave pulses. With this additional pulse, dual-polarization radar is better able to estimate precipitation. It is also better able to differentiate types of precipitation—rain, snow, sleet, or hail. Dual-polarization radar will greatly improve flash-flood and winter-weather forecasts. Tornado research is another important component of meteorology. Starting in 2009, the National Oceanic and Atmospheric Administration (NOAA) and the National Science Foundation conducted the largest tornado research project in history, known as VORTEX2. The VORTEX2 team, consisting of about 200 people and more than 80 weather instruments, traveled more than 16,000 kilometers (10,000 miles) across the Great Plains of the United States to collect data on how, when, and why tornadoes form. The team made history by collecting extremely detailed data before, during, and after a specific tornado. This tornado is the most intensely examined in history and will provide key insights into tornado dynamics. Satellites are extremely important to our understanding of global scale weather phenomena. The National Aeronautics and Space Administration (NASA) and NOAA operate three Geostationary Operational Environmental Satellites (GOES) that provide weather observations for more than 50 percent of Earth’s surface. GOES-15, launched in 2010, includes a solar X-ray imager that monitors the sun’s X-rays for the early detection of solar phenomena, such as solar flares . Solar flares can affect military and commercial satellite communications around the globe. A highly accurate imager produces visible and infrared images of Earth’s surface, oceans, cloud cover, and severe storm developments. Infrared imagery detects the movement and transfer of heat, improving our understanding of the global energy balance and processes such as global warming , convection, and severe weather.
Christopher Columbus, Meteorologist In 1495, explorer Christopher Columbus recorded what might be the first European account of a hurricane. While docked off La Isabela, Hispaniola (now the Dominican Republic), Columbus lost three ships in a violent storm. Modern meteorologists debate whether the storm was an actual hurricane or a tornado and waterspout. Columbus attests that "nothing but the service of God and the extension of the monarchy'' would persuade him to endure another storm like that.
Humid Curls Horace Benedict de Saussure was an amateur alpine climber, physicist, and meteorologist. In 1783, he constructed the first hygrometer, an instrument that measures humidity. The medium he used to measure the amount of moisture in the air: human hair. The hair Sassure tested relaxed, or lengthened, in moist weather. It tensed, or curled, in dry weather.
Seal of Approval Since 1982, the National Weather Association has promoted quality weather broadcasting by issuing a Weathercaster Seal of Approval to qualified broadcasters. The seal exam is difficult, and only 918 people in the U.S. are certified. Find out if your local weather forecaster has made the list!
Storm Synchronicity "Unlike history, meteorology does repeat itself." Dr. Mel Goldstein, meteorologist
Articles & Profiles
Media credits.
The audio, illustrations, photos, and videos are credited beneath the media asset, except for promotional images, which generally link to another page that contains the media credit. The Rights Holder for media is the person or group credited.
Illustrators
Educator reviewer, expert reviewer, last updated.
October 19, 2023
User Permissions
For information on user permissions, please read our Terms of Service. If you have questions about how to cite anything on our website in your project or classroom presentation, please contact your teacher. They will best know the preferred format. When you reach out to them, you will need the page title, URL, and the date you accessed the resource.
If a media asset is downloadable, a download button appears in the corner of the media viewer. If no button appears, you cannot download or save the media.
Text on this page is printable and can be used according to our Terms of Service .
Interactives
Any interactives on this page can only be played while you are visiting our website. You cannot download interactives.
Related Resources
Understanding Global Change
Discover why the climate and environment changes, your place in the Earth system, and paths to a resilient future.
Atmospheric circulation

From the gentlest of breezes to the raging winds of a category five hurricane, the atmosphere is constantly in motion. The energy for all that movement comes from sunlight that is absorbed and re-radiated by the surface of the Earth and the rotation of the Earth. Atmospheric circulation, along with ocean circulation , distributes heat across the entire surface of the Earth, bringing us our daily weather and shaping regional climates.
On this page:
What is atmospheric circulation, earth system models about atmospheric circulation, how human activities influence atmospheric circulation, explore the earth system, investigate, links to learn more.
For the classroom:
- Teaching Resources

Global Change Infographic
Atmospheric circulation occurs in the atmosphere, and is an essential part of How the Earth System Works. Click the image on the left to open the Understanding Global Change Infographic . Locate the atmospheric circulation icon and identify other Earth system processes and phenomena that cause changes to, or are affected by, atmospheric circulation.
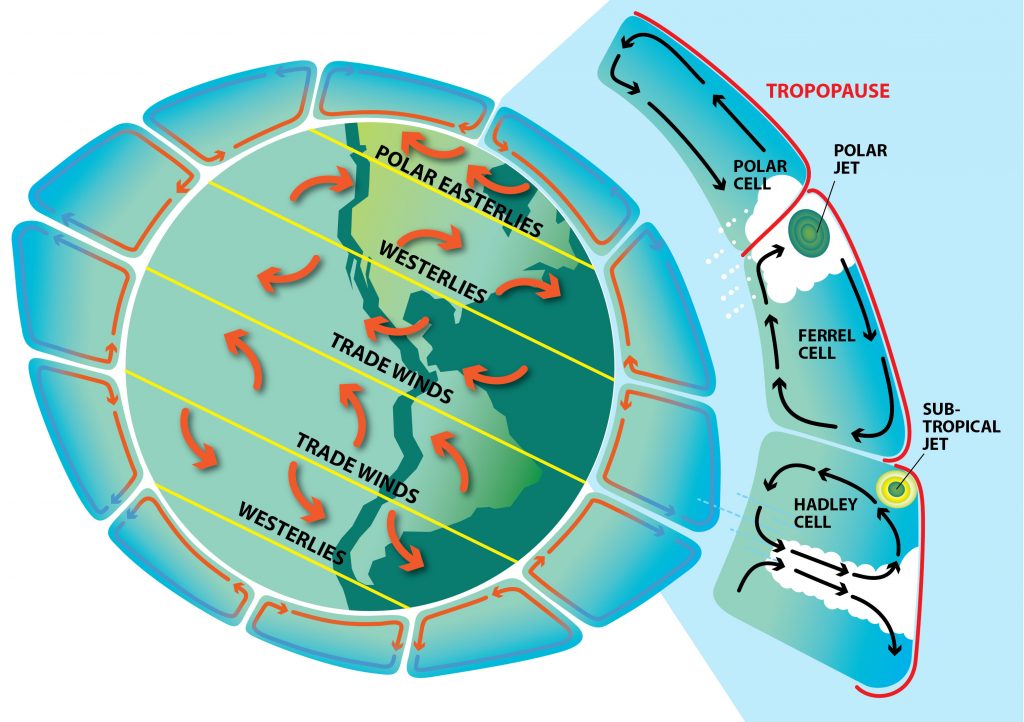
Illustration adapted from weather.gov global circulations and jet stream pages
Solar radiation that reaches the Earth passes through the atmosphere and is either absorbed or reflected by the atmosphere and Earth’s surface. Most of this absorption happens on Earth’s surfaces, which increases the temperature of both land and water. A small amount of heat in the first few centimeters of the atmosphere is transferred from the surface by conduction, the process of molecules colliding and transferring energy. Because air molecules are farther apart than they are in liquids or solids, they do not collide as frequently as in liquids and solids, and air is a poor conductor of heat. Most heat is transferred in the atmosphere by radiation and convection.
Sunlight absorbed by Earth’s surfaces is re-radiated as heat, warming the atmosphere from the bottom up. This heat is absorbed and re-radiated by greenhouse gases in the atmosphere, resulting in the greenhouse effect . Warmed air expands and becomes less dense than cool air, so warmed air near the surface of the Earth rises up. Cooler air from above sinks, and air moves horizontally to replace the rising warm air, which we experience as wind over the surface of the Earth. This transfer of heat because of density differences in air is called convection. The major patterns in atmospheric circulation around the tropics (from around latitudes of 30 o N to 30 o S) are the result of convection that occurs because areas around the equator receive more sunlight than higher latitudes (see absorption and reflection of sunlight ). These air masses, called the Hadley Cell, rise near the equator and travel north and south, transporting heat and water towards the poles.
Patterns of air movement are further complicated because of Earth’s spin. Air moving from the equator towards the poles does not travel in a straight line, but is deflected because of the Coriolis effect (to learn more see links below), adding to the complexity of atmospheric circulation patterns. Additionally, the uneven distribution of continents and oceans and the presence of mountain ranges make the details of atmospheric circulation patterns far more complicated than the three cell model (shown above).
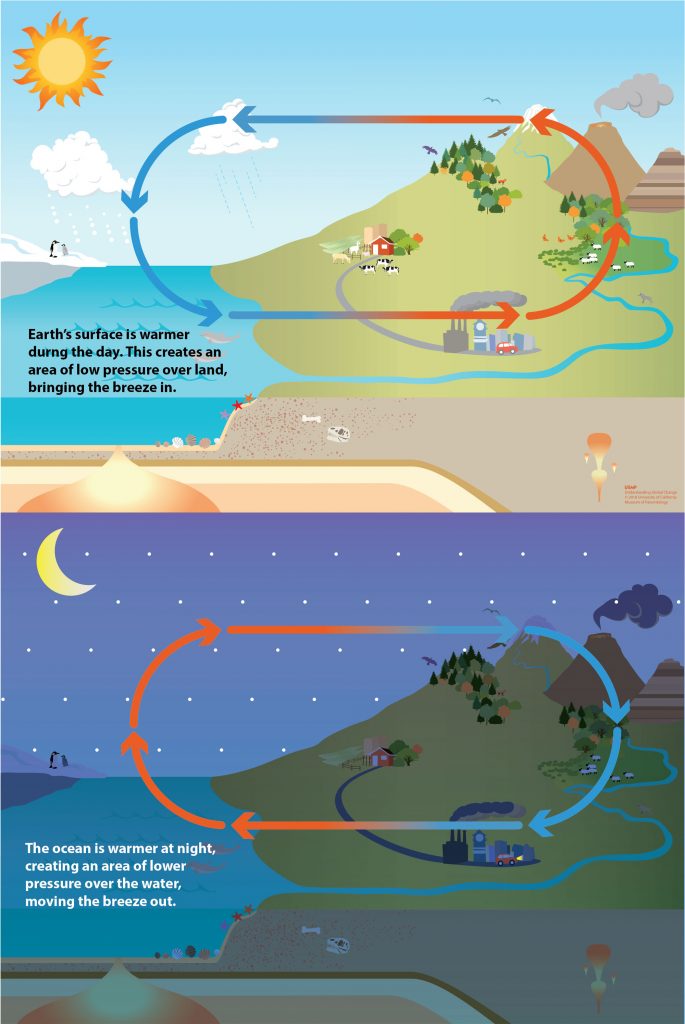
Variation in the amount of solar radiation absorbed, and the amount of heat re-radiating from Earth’s land and oceans results in temperature differences in air over different types of terrain. For example, sea breezes occur because land heats up and cools down faster than water , so that the land is warmer during the day and breezes flow from the sea inland, but the ocean is warmer than land at night, so the wind blows from land to sea.
Atmospheric circulation transports heat over the surface of the Earth that affects the water cycle, including the formation of clouds and precipitation events. The movement of air masses brings us our daily weather, and long-term patterns in circulation determine regional climate and ecosystems. Surface ocean currents patterns result from wind pushing on the surface of the water, and these currents also transport heat across the globe. Changes in the amount and distribution of heat in the Earth system due to an enhanced greenhouse effect from human activities is altering atmospheric and ocean circulation patterns that, in turn, alter environments around the globe.
This model shows some of the cause and effect relationships among components of the Earth system related to atmospheric circulation. While this model does not depict the circulation patterns that results from uneven heating of the Earth’s surface (as shown above), it summarizes the key concepts involved in explaining this process. Hover over the icons for brief explanations; click on the icons to learn more about each topic. Download the Earth system models on this page.
This model shows some of the additional phenomena that alter atmospheric circulation patterns over millions of years, including the distribution of continents and oceans and mountain building. Changes in atmospheric circulation also transports heat that drives the water cycle, including cloud formation and precipitation patterns. In turn, the energy absorbed and released in the water cycle also contributes to atmospheric circulation. While this model does not depict the uneven heating of the Earth’s surface that results in atmospheric circulation, it summarizes the key concepts involved in explaining this global process.
The Earth system model below includes some of the ways that human activities affect atmospheric circulation by adding greenhouse gases to the atmosphere and increasing Earth’s average temperature. Because the Arctic region is especially sensitive to overall warming compared to lower latitudes, the temperature gradient between the mid-latitudes and the pole is being reduced. This increases waviness in the north polar jet stream. As the atmosphere continues to warm, scientists expect to see much deeper north-south waves, which will cause changes in the jet stream. This could result in weather , both stormy and clear, persisting for much longer than would be considered normal over any particular area. Hover over or click on the icons to learn more about these human causes of change and how they influence atmospheric circulation.
Click the icons and bolded terms (e.g. re-radiation of heat, airborne particles, etc.) on this page to learn more about these process and phenomena. Alternatively, explore the Understanding Global Change Infographic and find new topics that are of interest and/or locally relevant to you.
To learn more about teaching the absorption and reflection of sunlight, visit the Teaching Resources page.
Learn more in these real-world examples, and challenge yourself to construct a model that explains the Earth system relationships.
- Ozone depletion: Uncovering the hidden hazard of hairspray
- National Weather Service: Global Circulations
- National Weather Service: The Jet Stream
- National Center for Atmospheric Research: Conduction
- National Center for Atmospheric Research: A Global Look at Moving Air: Atmospheric Circulation
- NOAA: Weather Systems and Patterns
- NOAA: What are sea breezes and why do they occur?

An official website of the United States government
Here’s how you know
Official websites use .gov A .gov website belongs to an official government organization in the United States.
Secure .gov websites use HTTPS A lock ( Lock A locked padlock ) or https:// means you’ve safely connected to the .gov website. Share sensitive information only on official, secure websites.
- JetStream home
- Layers of the Atmosphere
- Air Pressure
- The Transfer of Heat Energy
- Energy Balance
- Hydrologic Cycle
Precipitation
- Layers of the Ocean
- Ocean Circulations
- The Sea Breeze
- The Marine Layer
- Rip Current Safety
- Global Atmospheric Circulations
- The Jet Stream
- Climate vs. Weather
- Climate Zones
- How clouds form
- The Core Four
- The Basic Ten
- Cloud Chart
- Color of Clouds
- Parcel Theory
- Stability-Instability
- Radiosondes
- Skew-T Log-P Diagrams
- Skew-T Plots
- Skew-T Examples
- Pressure vs. Elevation
- Longwaves and Shortwaves
- Basic Wave Patterns
- Common Features
- Thickness Charts
- Weather Models
- Surface Weather Plots
- Norwegian Cyclone Model
- Types of Weather Phenomena
- Electromagnetic waves
- The Atmospheric Window
- Weather Satellites
- How radar works
- Volume Coverage Patterns (VCP)
- Radar Images: Reflectivity
- Radar Images: Velocity
- Radar Images: Precipitation
- Inter-Tropical Convergence Zone
- Classification
- NHC Forecasts
- Hazards & Safety
- Damage Potential
- ENSO Pacific Impacts
- ENSO Weather Impacts
- Ingredients for a Thunderstorm
- Life Cycle of a Thunderstorm
- Types of Thunderstorms
- Hazard: Hail
- Hazard: Damaging wind
- Hazard: Tornadoes
- Hazard: Flash Floods
- Staying Ahead of the Storms
- How Lightning is Created
- The Positive and Negative Side of Lightning
- The Sound of Thunder
- Lightning Safety
- Frequently Asked Questions
- Types of Derechos
- Where and When
- Notable Derechos
- Keeping Yourself Safe
- Historical Context
- Causes: Earthquakes
- Causes: Landslides
- Causes: Volcanoes
- Causes: Weather
- Propagation
- Detection, Warning, and Forecasting
- Preparedness and Mitigation: Communities
- Preparedness and Mitigation: Individuals (You!)
- Select NOAA Tsunami Resources
- Weather Forecast Offices
- River Forecast Centers
- Center Weather Service Units
- Regional Offices
- National Centers for Environmental Prediction
- NOAA Weather Radio
- NWS Careers: Educational Requirements
- Weather Glossary
- Weather Acronyms
- Learning Lessons
Weather around the world falls into three basic categories: precipitation, obscurations, and "other" phenomena.
- Surface Plot Symbols
Precipitation is any form of water particle, whether liquid or solid, that falls from the atmosphere and reaches the ground. The different types of precipitation are:

Ice Pellets (Sleet)

Graupel (Small Hail, Snow Pellets)

Snow Grains

Ice Crystals

Obscuration Types
An obscuration is any phenomena in the atmosphere, other than precipitation, that reduces the horizontal visibility. The most common is fog. Obscurations include:

Volcanic Ash

Other Weather Types
Significant types of weather are related to wind. These other forms of weather include:

Funnel Cloud

Well-Developed Dust/Sand Whirls

Student Essays

Essay on Weather [ Types, Importance in Life ]
Weather is the state of the atmosphere at a particular place and time. It includes temperature, humidity, precipitation, cloudiness, visibility, and pressure. The following Essay on Weather talks about its meaning and concept, types and how weather is important for us.
Essay on Weather | Types of Weather | Weather vs Climate
Weather is one of the most important aspects of our lives. It can have a huge impact on our mood, our health, and even our ability to function properly during the day. That’s why it’s so important to understand the different types of weather and how they can affect us.
Types of Weather
There are four main types of weather: sunny, cloudy, rainy, and snowy. Each type of weather has its own set of benefits and drawbacks.

Sunny: Sunny weather is great for outdoor activities and spending time in the sun. However, it can also be very hot and dry, which can be dangerous for people with certain medical conditions.
>>>>> Related Post: ” Essay on Acid Rain “
Cloudy: Cloudy weather is cooler than sunny weather, but it can also be more humid. This type of weather is good for people who don’t like the heat but don’t want to deal with the cold.
Rainy: Rainy weather is perfect for activities that involve water, such as swimming or fishing. However, it can also be very muddy and wet, which can make it difficult to get around.
Snowy: Snowy weather is great for winter activities like skiing and sledding. However, it can also be very cold and dangerous for people who are not used to the cold weather.
Weather vs Climate:
Weather is the day-to-day condition of the atmosphere in a particular place, while climate is the average weather conditions in that place over a long period of time. Climate varies from place to place around the world. The climate in a tropical rainforest is very different from the climate in a desert.
Importance of Climate
Climate is important because it determines the types of plants and animals that can live in a particular place. For example, tropical rainforests have a very different climate from deserts. This means that different types of plants and animals can live in each environment.
Changes in Climate:
Climate change is a long-term shift in the average conditions of the atmosphere over a large area. Climate change could refer to a particular location or the planet as a whole. Climate change has been happening for millions of years, but it is only recently that humans have begun to impact the climate on a global scale.
Steps that we can take to Promote Healthy Weather
There are many things we can do to help promote healthy weather. Some of these steps include:
1. Reducing greenhouse gas emissions by using less energy and switching to renewable sources of energy 2. Protecting and restoring forests, which play a vital role in regulating the climate 3. Improving agricultural practices to reduce methane emissions from livestock 4. Conserving water to reduce the amount of energy needed to pump and treat it
Weather is an important part of our lives and can have a big impact on our mood, health, and ability to function properly. There are four main types of weather: sunny, cloudy, rainy, and snowy. Each type of weather has its own set of benefits and drawbacks. Climate is important because it determines the types of plants and animals that can live in a particular place.
>>> Related Post: ” Essay on Incredible India “
Climate change is a long-term shift in the average conditions of the atmosphere over a large area. There are many things we can do to help promote healthy weather, such as reducing greenhouse gas emissions, protecting and restoring forests, and improving agricultural practices.
Short Essay on Weather For Students:
Weather is the state of the atmosphere at a specific time and place. It includes various elements such as temperature, humidity, precipitation, wind, and air pressure. Weather plays an important role in our daily lives as it affects our activities and influences our mood.
Importance of Weather
Weather has a significant impact on human life. It affects agriculture, transportation, tourism, health, and even the economy. Farmers rely on weather conditions for their crops to grow while tourists plan their trips based on favorable weather conditions. Weather also has an effect on mental health as certain weather patterns can lead to seasonal affective disorder (SAD).
Factors Affecting Weather
The main factors that influence the weather are latitude, altitude, topography, and global air circulation patterns. Latitude determines the amount of sunlight received, while altitude affects temperature and precipitation. The shape of the land and presence of water bodies can also affect weather patterns.
Weather conditions can vary greatly depending on geographical location and time of year. Some common types of weather include sunny, cloudy, rainy, snowy, windy, hot, cold, and humid.
Sunny Weather
Sunny weather is characterized by clear skies with abundant sunshine. It usually occurs when high pressure systems dominate the area.
Cloudy Weather
Cloudy weather refers to a condition where the sky is covered with clouds blocking out the sun’s rays. This type of weather often occurs during low-pressure systems.
Rainy Weather
Rainy weather is characterized by precipitation in the form of rain. It can be caused by warm air rising and condensing into water droplets, which then fall to the ground.
Snowy Weather
Snowy weather occurs when temperatures are low enough for precipitation to freeze and fall as snow. This type of weather often brings hazardous driving conditions and can lead to school or work closures.
Windy Weather
Windy weather refers to a condition where there is a strong movement of air. It can be caused by differences in air pressure between two areas or by geographical features such as mountains.
Hot Weather
Hot weather is characterized by high temperatures and humidity levels. It can cause heat-related illnesses such as heatstroke and dehydration if precautions are not taken.
Cold Weather
Cold weather is characterized by low temperatures and can bring about freezing conditions, which can be dangerous for both humans and animals.
Humid Weather
Humid weather refers to a condition where there is a high level of water vapor in the air. It can make hot or cold temperatures feel even more extreme and uncomfortable.
Weather affects our lives in many ways, from influencing our daily activities to shaping our emotions. Understanding the different types of weather and the factors that influence them can help us better prepare for any changes in the forecast. As we continue to face the impacts of climate change, it becomes even more important to pay attention to the weather and take necessary precautions to protect ourselves and our environment.
How do you write a weather essay?
A weather essay typically begins with an introduction about the significance of weather, followed by a description of different weather phenomena, their impact on daily life, and any relevant data or statistics. It should also include personal observations or experiences related to weather and conclude with a summary or reflection.
What is weather in 100 words?
Weather refers to the atmospheric conditions in a specific place and time. It encompasses elements such as temperature, humidity, wind speed and direction, cloud cover, and precipitation. Weather can change rapidly and has a profound impact on daily life, agriculture, transportation, and various industries.
It is observed and forecasted by meteorologists using tools like weather stations, satellites, and computer models. Understanding and predicting weather is essential for planning outdoor activities, preparing for extreme conditions, and mitigating the effects of severe weather events like storms, hurricanes, and droughts.
What is weather in short notes?
Weather refers to the state of the atmosphere in a particular place at a specific time. It includes elements like temperature, humidity, wind speed and direction, cloud cover, and precipitation. Weather conditions can vary from day to day and even within hours.
Meteorologists study and forecast weather using various instruments and technology to provide information for planning activities, predicting severe weather events, and understanding climate patterns over time.
How do you start a weather paragraph?
A weather paragraph can begin by describing the current weather conditions in a specific location or by introducing the topic of weather in a broader sense. You can use attention-grabbing phrases or statistics to engage the reader’s interest.
Leave a Comment Cancel reply
Save my name, email, and website in this browser for the next time I comment.
The Highs and Lows of Air Pressure
Air near the surface flows down and away in a high pressure system (left) and air flows up and together at a low pressure system (right). NESTA
Standing on the ground and looking up, you are looking through the atmosphere. It might not look like anything is there, especially if there are no clouds in the sky. But what you don’t see is air – lots of it. We live at the bottom of the atmosphere, and the weight of all the air above us is called air pressure. Above every square inch on the surface of the Earth is 14.7 pounds of air. That means air exerts 14.7 pounds per square inch (psi) of pressure at Earth’s surface. High in the atmosphere, air pressure decreases. With fewer air molecules above, there is less pressure from the weight of the air above.
Pressure varies from day to day at the Earth’s surface - the bottom of the atmosphere. This is, in part, because the Earth is not equally heated by the Sun. Areas where the air is warmed often have lower pressure because the warm air rises. These areas are called low pressure systems. Places where the air pressure is high, are called high pressure systems.
A low pressure system has lower pressure at its center than the areas around it. Winds blow towards the low pressure, and the air rises in the atmosphere where they meet. As the air rises, the water vapor within it condenses, forming clouds and often precipitation. Because of Earth’s spin and the Coriolis effect, winds of a low pressure system swirl counterclockwise north of the equator and clockwise south of the equator. This is called cyclonic flow. On weather maps, a low pressure system is labeled with red L.
A high pressure system has higher pressure at its center than the areas around it. Winds blow away from high pressure. Swirling in the opposite direction from a low pressure system, the winds of a high pressure system rotate clockwise north of the equator and counterclockwise south of the equator. This is called anticyclonic flow. Air from higher in the atmosphere sinks down to fill the space left as air is blown outward. On a weather map, you may notice a blue H, denoting the location of a high pressure system.
How do we know what the pressure is? How do we know how it changes over time? Today, electronic sensors in weather stations measure air pressure. These sensors are able to make continuous measurements of pressure over time. In the past, barometers were used and measured how much air pushed on a fluid, such as mercury. Historically, measurements of air pressure were described as “inches of mercury.” Today, meteorologists use millibars (mb) to describe air pressure.
Air pressure depends on temperature and density.
When you inflate a balloon, the air molecules inside the balloon get packed more closely together than air molecules outside the balloon. This means the density of air is high inside the balloon. When the density of air is high, the air pressure is high. The pressure of the air pushes on the balloon from the inside, causing it to inflate. If you heat the balloon, the air pressure gets even higher.
Air pressure depends on the temperature of the air and the density (calculated as mass divided by volume) of the air molecules.
Atmospheric scientists use math equations to describe how pressure, temperature, density, and volume are related to each other. They call these equations the Ideal Gas Law . In these equations, temperature is measured in Kelvin. The constant in the equations refers to the Universal Gas Constant and the amount, or number of molecules, of a gas.
This equation helps us explain how weather works, such as what happens in the atmosphere to create warm and cold fronts and storms, such as thunderstorms. For example, if air pressure increases, the temperature must increase. If air pressure decreases, the temperature decreases. It also explains why air gets colder at higher altitudes, where pressure is lower.
- What Is Weather?
- Clouds and How They Form
- A Global Look at Moving Air: Atmospheric Circulation
- The Water Cycle
Related Links
- How Weather Affects Air Quality
- Change in the Atmosphere with Altitude
What role does the ocean play in the weather?
The ocean plays a leading role in the earth's climate..

Hurricane Gustav was one of a series of hurricanes to strike the United States in 2008. Hurricanes originate over the tropical regions of the ocean under conditions where high humidity, light winds, and warm sea surface temperatures combine.
The ocean plays an important role in shaping our climate and weather patterns.
Warm ocean waters provide the energy to fuel storm systems that provide fresh water vital to all living things. Understanding and predicting precipitation is critical to farmers who decide which crops to plant, and how deep, based in part on soil moisture levels. Crop and food prices may increase when weather that is too wet or too dry adversely affects crops.
Like precipitation, extreme heat and cold also affect livestock management.
Weather prediction can be a life-saving tool. Aside from helping people prepare for catastrophic storms, prediction can help citizens and governments anticipate extreme hot and cold temperatures, which may cause death among the elderly.
Water management experts study how much rainfall to anticipate so they can manage reservoir levels and water usage, to ensure everyone has abundant water supplies.
More Information
- National Weather Service
- NOAA's Climate Prediction Center
Last updated: 01/18/24 Author: NOAA How to cite this article
Thank you for visiting nature.com. You are using a browser version with limited support for CSS. To obtain the best experience, we recommend you use a more up to date browser (or turn off compatibility mode in Internet Explorer). In the meantime, to ensure continued support, we are displaying the site without styles and JavaScript.
- View all journals
- Explore content
- About the journal
- Publish with us
- Sign up for alerts
- Research Highlight
- Published: 11 January 2024
Machine learning
Artificial intelligence for weather forecasting
- Silvia Conti 1
Nature Reviews Electrical Engineering volume 1 , page 8 ( 2024 ) Cite this article
2377 Accesses
2 Altmetric
Metrics details
- Computational science
You have full access to this article via your institution.
Medium-range weather prediction — forecasts up to 15 days — is crucial for science and society. However, traditional methods that rely on the weather-governing physics equations translated into algorithms are time consuming, laborious and costly, resulting in speed-accuracy trade-offs.
Now writing in Science , Remi Lam et al. present an alternative weather forecast system, GraphCast, that harnesses machine learning and graph neural networks (GNNs) to process spatially structured historical data. “GraphCast learns from four decades (1979–2017) of curated atmospheric data provided by the European Centre for Medium-Range Weather Forecast (ECMWF), finding patterns in the weather that it can then exploit to make forecasts,” says Alvaro Sanchez-Gonzalez, one of the authors of the paper. GraphCast models the Earth using a GNN over a uniform mesh around the Earth surface. The inputs are the current weather state and the state six hours earlier; the output is the weather six hours ahead.

Until recently, medium-range forecasting had been facilitated by WeatherBench 1 , which provided training and verification data at low resolution. The primary goal of the researchers was to demonstrate the potential impact of this model. It turned out that it was possible to extend the resolution of WeatherBench 1, leading to the development of GraphCast. Substantial verification efforts to evaluate GraphCast against operational models across various metrics and applications followed. The release of an improved WeatherBench 2 benchmark is expected to further enhance progress in evaluating this type of model.
Operating at a high resolution of 0.25° longitude/latitude grid (roughly 28 × 28 km resolution at the equator) and thus covering over 1 million grid points, GraphCast predicts several Earth-surface and atmospheric variables — temperature, wind speed and direction, mean sea-level pressure, specific humidity, and more — with high accuracy. Despite the computationally intensive training (about 4 weeks on 32 Google TPU v4 machines), the method is highly efficient, producing 10-day forecasts in less than one minute on a single TPU. In comparison, gold-standard deterministic methods such as ECMFW’s high resolution forecast (HRES) can take hours on a supercomputer with hundreds of machines. Moreover, GraphCast outperforms HRES on over 90% of test variables and forecast lead times, reaching 99.7% accuracy in the troposphere — a crucial atmospheric layer because it is the closest to the Earth’s surface and the one that affects our lives the most.
“Our goal was to show real-world impact, and early results hinted that we could potentially scale-up our approach to work at the resolutions required for GraphCast to become a competitive operational model,” continues Sanchez-Gonzalez. GraphCast is now recognized as the world’s most accurate 10-day global deterministic weather forecasting system, extending the prediction horizon for extreme weather events, including extreme temperatures, cyclones and floods, aiding in and planning emergency responses.
“Our goal was to show real-world impact, and early results hinted that we could potentially scale-up our approach to work at the resolutions required for GraphCast to become a competitive operational model”
To enhance accessibility, the code for GraphCast has been open-sourced, with ECMWF already experimenting with the 10-day forecasts. Pioneering artificial intelligence (AI) in weather forecasting aims to benefit billions of people in their daily lives by empowering the global community to address environmental challenges. “One of the greatest advantages of AI systems is that they learn from data. GraphCast was trained using atmospheric data, so it learned to predict the evolution of the atmosphere. You could imagine training GraphCast with other data — for example, agricultural data to predict harvests; ecology data to predict deforestation and biodiversity; and also renewable energies, or even road traffic,” concludes Sanchez-Gonzalez.
Original article
Lam, R. et al. Learning skillful medium-range global weather forecasting. Science https://doi.org/10.1126/science.adi2336 (2023)
Article Google Scholar
Download references
Author information
Authors and affiliations.
Nature Reviews Electrical Engineering https://www.nature.com/natrevelectreng/
Silvia Conti
You can also search for this author in PubMed Google Scholar
Corresponding author
Correspondence to Silvia Conti .
Rights and permissions
Reprints and permissions
About this article
Cite this article.
Conti, S. Artificial intelligence for weather forecasting. Nat Rev Electr Eng 1 , 8 (2024). https://doi.org/10.1038/s44287-023-00009-2
Download citation
Published : 11 January 2024
Issue Date : January 2024
DOI : https://doi.org/10.1038/s44287-023-00009-2
Share this article
Anyone you share the following link with will be able to read this content:
Sorry, a shareable link is not currently available for this article.
Provided by the Springer Nature SharedIt content-sharing initiative
Quick links
- Explore articles by subject
- Guide to authors
- Editorial policies
Sign up for the Nature Briefing: AI and Robotics newsletter — what matters in AI and robotics research, free to your inbox weekly.

NASA and IBM Research Apply AI to Weather and Climate
A collaboration involving NASA and IBM Research has led to the development of a new artificial intelligence (AI) foundation model for weather and climate: Prithvi-weather-climate (Prithvi is the Sanskrit name for Earth). The model is pre-trained on 40 years of weather and climate data from NASA's Modern-Era Retrospective analysis for Research and Applications, Version 2 ( MERRA-2 ), and fills a need to infuse AI and machine learning (ML) methods into weather and climate applications, such as storm tracking, forecasting, and historical analysis.
In keeping with NASA's open science policies , Prithvi-weather-climate will be openly available. The model and the code will be released later in 2024 through Hugging Face , a public repository for open-source ML models.

The Role of Foundation Models
Using AI to sift through data to find solutions requires not only massive amounts of data, but also large amounts of time. As noted by IBM Research, the next stage in AI model development is to create models pre-trained on a broad set of unlabeled data that can be used as the foundation for different tasks that require minimal fine-tuning. These are called foundation models, or FMs.
FMs are the basis for enabling AI and ML systems to ingest large amounts of data and generate results based on associations among the data. They serve as a baseline from which scientists can develop a diverse set of applications that can result in powerful and efficient solutions. Once an FM is created, it can be trained on a small amount of data to perform a specific task.
But creating and pre-training FMs still requires lots of data. When it comes to addressing the need for massive amounts openly available Earth science data, NASA's Earth Science Data Systems ( ESDS ) Program is a logical source. The more than 100 petabytes (PB) of data the program distributes openly and without restriction is the secret sauce that helps make open-source Earth science-based FM development possible. This combination of open NASA Earth science data and IBM Research's state-of-the-art computational power led to the groundbreaking work using NASA Harmonized Landsat and Sentinel-2 ( HLS ) data to create the Prithvi Geospatial FM , the first open-source geospatial FM, in 2023. Prithvi-weather-climate builds on this achievement.
"Foundation models offer amazing prospects for expanding the use of NASA’s vast archive of Earth observations," says NASA Earth Data Officer Katie Baynes. "The Prithvi-weather-climate model holds promise to advance our understanding of atmospheric dynamics and developing new applications. We're excited to see how the community can leverage this work to enhance resilience to climate and weather-related hazards."
Creating Prithvi-weather-climate

Work on Prithvi-weather-climate began in September 2023 with a workshop at NASA's Marshall Space Flight Center in Huntsville, AL. Marshall is the home of NASA's Interagency Implementation and Advanced Concepts Team ( IMPACT ), a NASA ESDS element charged with expanding the use of NASA Earth observation data through innovation, partnerships, and technology—including the application of AI to these data.
"This model is part of our overall strategy to openly and collaboratively develop a family of AI foundation models to support NASA's science mission goals," says IMPACT Manager Dr. Rahul Ramachandran. "These models will augment our capabilities to draw insights from our vast archives of Earth observations."
Joining the IMPACT and IBM Research teams in developing Prithvi-weather-climate were participants from NASA Headquarters, NASA's Global Modeling and Assimilation Office ( GMAO ), NASA's Center for Climate Simulation ( NCCS ), the NASA Advanced Supercomputing ( NAS ) Facility, Oak Ridge National Laboratory (ORNL), and NVIDIA Corporation. Several universities engaged in various aspects of AI or large-scale computing and weather/climate science participated as well, including the University of Alabama in Huntsville, Colorado State University, and Stanford University.
The focus of the Marshall workshop was to plan the next six to eight months of work necessary to develop and pre-train the model. It was decided that the FM would contain parameters such as wind speed and direction, air temperature, specific humidity, cloud mass variables, and longwave and shortwave radiation variables. To be valuable to the broader science community, the team agreed that the focus should not be on forecasting; rather, the FM should enable many different types of downstream science applications.

The foundation of Prithvi-weather-climate is 40 years of MERRA-2 data. MERRA-2 is the first long-term global reanalysis to assimilate space-based observations of aerosols and represent their interactions with other physical processes in the climate system. These data are available through NASA's Earthdata Search . MERRA-2 was created by NASA's GMAO to replace and enhance the original MERRA and to sustain GMAO's commitment to having an ongoing near real-time climate analysis.
"With the Prithvi-weather-climate FM, NASA and IBM have led the creation of a unique AI representation of all knowledge available in 40 years' worth of MERRA-2 data," says Dr. Juan Bernabé-Moreno, director of IBM Research Europe and IBM’s accelerated discovery lead for climate and sustainability. "The IBM-NASA collaboration highlights how open-source technologies are essential to advancing crucial research into areas such as climate change. By merging IBM's foundation model technology with NASA's deep expertise and specialized climate datasets, we've developed flexible, reusable AI systems for broader use."
Applications to Science and Society
The Prithvi-weather-climate FM has broad applications for both science and society.
From a scientific and research standpoint, the model has been fine-tuned to increase the resolution of long-term climate models by a factor of 12x, a process known as "downscaling." Using an AI model in this context avoids the high costs associated with the conventional approach using high performance computing (HPC). The FM also improves the use of AI for better representation of small-scale physical processes in numerical weather and climate models. Through the insertion of tokens in the model at wind turbine locations, Prithvi-weather-climate can generate targeted forecasts using hyper-localized, asset-specific observations, further improving the accuracy of short to medium-range forecasts.
The application of AI to weather and climate data also can lead to improvements in public safety. Uses being developed by the research team for Prithvi-weather-climate include more precise hurricane track and intensity forecasts along with better seasonal precipitation forecasting. As the model continues to be trained, future applications include the detection and prediction of severe weather patterns, more detailed wildfire behavior forecasts, finer turbulence detection and prediction, urban heatwave prediction, and improved solar radiation assessment.
"Our ambition is to accelerate and advance the impact of NASA's Earth science to meet this moment of changing climate for the benefit of all humankind," says Dr. Karen St. Germain, director of NASA's Earth Science Division. "The [NASA/IBM Research] foundation model for weather and climate will enable this Earth Science to Action strategy."
Meet the Team
Along with the participants noted in the Creating Prithvi-weather-climate section, the development of the FM was accomplished by a diverse team with deep experience representing varied aspects of AI and ML.
- Building an AI Foundation Model for Weather and Climate
- NASA, IBM Research Release New AI Foundation Model for Weather, Climate Forecasts
- IBM and NASA are building an AI foundation model for weather and climate
- Blog: Environmental analysis made easier with IBM’s Geospatial Studio
- Mukkavilli, S.K., et al. (2023). AI Foundation Models for Weather and Climate: Applications, Design, and Implementation. Cornell University arXiv. doi:10.48550/arXiv.2309.10808
- Gelaro, R., et al. (2017). The Modern-Era Retrospective Analysis for Research and Applications, Version 2 (MERRA-2). Journal of Climate, 30(14): 5419-5414. doi:10.1175%2FJCLI-D-16-0758.1
Technologies
NASA has the data you need to explore the global ocean
You might also be interested in

share this!
May 30, 2024
This article has been reviewed according to Science X's editorial process and policies . Editors have highlighted the following attributes while ensuring the content's credibility:
fact-checked
peer-reviewed publication
trusted source
First use of weather forecasts to show human impact on extreme weather is 'transformational,' scientists say
by University of Oxford

National forecasting centers like the Met Office could apply the same tools used for weather forecasting to quantify how human behavior is aggravating major events like floods, heat waves and storms, climate scientists at Oxford University Physics show in a study published today in Nature Communications .
Oxford climate physicists, led by Professor Myles Allen, have, for the first time, demonstrated how state-of-the-art weather forecasts can be used to show how greenhouse gas emissions affect extreme weather . In new studies of recent events in both the U.K. and U.S., they assessed the impact of global warming at a local scale and found that human activity both worsened specific weather events and made them more likely to occur.
Their findings coincide with the United Nations " AI for Good Summit " in Geneva, where scientists from the Oxford Physics team will lead sessions on how artificial intelligence and machine learning can improve regional forecasting of extreme weather and future climate predictions.
"Weather forecasters could—and should—both warn people of extreme weather and explain how it is being affected by climate change," said Professor Myles Allen, who leads the Oxford University Physics research team. "It isn't a simple case of climate change making all weather worse: some events, like prolonged winter cold, have become less likely."
The new Oxford studies used the world's most reliable medium range weather forecasting model, from the European Center for Medium-Range Weather Forecasting, to assess the impact of climate change on extreme weather.
A previous study , published in Environmental Research: Climate , focused on Storm Eunice in the U.K., which reached wind speeds of 122 miles per hour and caused 17 deaths in February 2022.
"We found that climate change expanded how much of the U.K. was impacted by storm Eunice and intensified the storm's severity by as much as 26%," said Shirin Ermis (Oxford University Physics), who led the U.K. study by Oxford University Physics. The study published today applied the same approach to the U.S. Pacific Northwest heat wave, thought to have killed more than 800 people in June 2021.
 and next generation, higher resolution and more local models (right) created by the Oxford researchers. Credit: Oxford University Physics")
"Climate change and human influence is having a very clear impact on certain extreme weather like storms and heat waves," said Dr. Nicholas Leach (Oxford University Physics) who led the U.S. study. "Human influence made this 2021 heat wave at least eight times more likely, and we also found the risk of similar heat waves occurring is doubling every 20 years at the current rate of global warming."
Understanding how climate change and human activity impacts extreme weather events remains a significant and urgent challenge because every year such events cost many lives and billions of dollars in aid and disaster relief around the world.
In the U.K., the cost of dealing with natural disasters caused by extreme weather and climate change could bankrupt the country by the end of the century, according to a recent report from the environmental intelligence agency Kisters. And in the U.S., the cost of dealing with 28 separate weather and climate disasters in 2023 alone topped a record US$90 billion.
To investigate the impact of climate change on extreme weather, and assess the influence of human activity, scientists rely on computer modeling. However, climate models are often inaccurate at a regional or local level and only represent specific atmospheric processes at a coarse scale, making their predictions unreliable, especially for extreme weather like storms.
The Oxford teams overcame this by using high-resolution weather forecasting models to simulate extreme weather as if it had occurred in a world without human influence on climate, and in a warmer world of the future. Their models could simulate and predict even unprecedented weather events and can also be used to understand and quantify how human behavior is changing them.
At the AI for Good summit in Geneva today, Professor Philip Stier of Oxford University Physics will convene a workshop with leading international experts to discuss future climate prediction systems. These are expected to make extensive use of artificial intelligence, to deliver more accurate predictions of the impact of climate change at local level.
Shirin Ermis et al, Event attribution of a midlatitude windstorm using ensemble weather forecasts, Environmental Research: Climate (2024). DOI: 10.1088/2752-5295/ad4200
Journal information: Nature Communications
Provided by University of Oxford
Explore further
Feedback to editors

Saturday Citations: The sound of music, sneaky birds, better training for LLMs. Plus: Diversity improves research
17 hours ago

Study investigates a massive 'spider' pulsar
19 hours ago

Greener, more effective termite control: Natural compound attracts wood eaters
21 hours ago

Shear genius: Researchers find way to scale up wonder material, which could do wonders for the Earth

New vestiges of the first life on Earth discovered in Saudi Arabia
May 31, 2024

Mussels downstream of wastewater treatment plant contain radium, study reports

A new way to see viruses in action: Super-resolution microscopy provides a nano-scale look

Martian meteorites deliver a trove of information on red planet's structure

New imager acquires amplitude and phase information without digital processing

AI helps scientists understand cosmic explosions
Relevant physicsforums posts, is it possible to transform an electric storm into an emp storm, iceland warming up again - quakes swarming, mount ibu, indonesia erupts.
May 29, 2024
Adirondack Mountains and earthquakes
May 23, 2024
The Secrets of Prof. Verschure's Rosetta Stones
Mt. vesuvius 1944 eruption light show -- static electricity.
May 22, 2024
More from Earth Sciences
Related Stories

Climate change caused 26 extra days of extreme heat in last year: report
May 28, 2024

AI weather forecasts can capture destructive path of major storms, new study shows
Apr 22, 2024

UK residents more concerned about climate change than dying from a car accident, says study
Jul 14, 2023

How well can weather experts predict unprecedented heat waves?
Aug 4, 2022

Calculating ongoing financial costs of climate change
Oct 10, 2023

How climate change is affecting extreme weather events around the world: new study
Jun 28, 2022
Recommended for you

'Forever chemical' discovery can aid drinking water treatment

No new fossil fuel projects needed in the transition to Net Zero, researchers say

Study of radioiodine sorption and transport could help protect groundwater

Reduced sulfur content in shipping fuel associated with increased maritime atmospheric warming

A local bright spot among melting glaciers: 2,000 km of Antarctic ice-covered coastline has been stable for 85 years
Let us know if there is a problem with our content.
Use this form if you have come across a typo, inaccuracy or would like to send an edit request for the content on this page. For general inquiries, please use our contact form . For general feedback, use the public comments section below (please adhere to guidelines ).
Please select the most appropriate category to facilitate processing of your request
Thank you for taking time to provide your feedback to the editors.
Your feedback is important to us. However, we do not guarantee individual replies due to the high volume of messages.
E-mail the story
Your email address is used only to let the recipient know who sent the email. Neither your address nor the recipient's address will be used for any other purpose. The information you enter will appear in your e-mail message and is not retained by Phys.org in any form.
Newsletter sign up
Get weekly and/or daily updates delivered to your inbox. You can unsubscribe at any time and we'll never share your details to third parties.
More information Privacy policy
Donate and enjoy an ad-free experience
We keep our content available to everyone. Consider supporting Science X's mission by getting a premium account.
E-mail newsletter
NASA, IBM Research to Release New AI Model for Weather, Climate

By Jessica Barnett
Working together, NASA and IBM Research have developed a new artificial intelligence model to support a variety of weather and climate applications. The new model – known as the Prithvi-weather-climate foundational model – uses artificial intelligence (AI) in ways that could vastly improve the resolution we’ll be able to get, opening the door to better regional and local weather and climate models.
Foundational models are large-scale, base models which are trained on large, unlabeled datasets and can be fine-tuned for a variety of applications. The Prithvi-weather-climate model is trained on a broad set of data – in this case NASA data from NASA’s Modern-Era Retrospective analysis for Research and Applications (MERRA-2)– and then makes use of AI learning abilities to apply patterns gleaned from the initial data across a broad range of additional scenarios.
“Advancing NASA’s Earth science for the benefit of humanity means delivering actionable science in ways that are useful to people, organizations, and communities. The rapid changes we’re witnessing on our home planet demand this strategy to meet the urgency of the moment,” said Karen St. Germain, director of the Earth Science Division of NASA’s Science Mission Directorate. “The NASA foundation model will help us produce a tool that people can use: weather, seasonal and climate projections to help inform decisions on how to prepare, respond and mitigate.”
With the Prithvi-weather-climate model, researchers will be able to support many different climate applications that can be used throughout the science community. These applications include detecting and predicting severe weather patterns or natural disasters, creating targeted forecasts based on localized observations, improving spatial resolution on global climate simulations down to regional levels, and improving the representation of how physical processes are included in weather and climate models.
“These transformative AI models are reshaping data accessibility by significantly lowering the barrier of entry to using NASA’s scientific data,” said Kevin Murphy, NASA’s chief science data officer, Science Mission Directorate at NASA Headquarters. “Our open approach to sharing these models invites the global community to explore and harness the capabilities we’ve cultivated, ensuring that NASA’s investment enriches and benefits all.”
Prithvi-weather-climate was developed through an open collaboration with IBM Research, Oak Ridge National Laboratory, and NASA, including the agency’s Interagency Implementation and Advanced Concepts Team (IMPACT) at Marshall Space Flight Center in Huntsville, Alabama.
Prithvi-weather-climate can capture the complex dynamics of atmospheric physics even when there is missing information thanks to the flexibility of the model’s architecture. This foundational model for weather and climate can scale to both global and regional areas without compromising resolution.
“This model is part of our overall strategy to develop a family of AI foundation models to support NASA’s science mission goals,” said Rahul Ramachandran, who leads IMPACT at Marshall. “These models will augment our capabilities to draw insights from our vast archives of Earth observations.”
Prithvi-weather-climate is part of a larger model family– the Prithvi family– which includes models trained on NASA’s Harmonized LandSat and Sentinel-2 data. The latest model serves as an open collaboration in line with NASA’s open science principles to make all data accessible and usable by communities everywhere. It will be released later this year on Hugging Face, a machine learning and data science platform that helps users build, deploy, and train machine learning models.
“The development of the NASA foundation model for weather and climate is an important step towards the democratization of NASA’s science and observation mission,” said Tsendgar Lee, program manager for NASA’s Research and Analysis Weather Focus Area, High-End Computing Program, and Data for Operation and Assessment. “We will continue developing new technology for climate scenario analysis and decision making.”
Along with IMPACT and IBM Research, development of Prithvi-weather-climate featured significant contributions from NASA’s Office of the Chief Science Data Officer, NASA’s Global Modeling and Assimilation Office at Goddard Space Flight Center, Oak Ridge National Laboratory, the University of Alabama in Huntsville, Colorado State University, and Stanford University.
Learn more about Earth data and previous Prithvi models: https://www.earthdata.nasa.gov/news/impact-ibm-hls-foundation-model
Jonathan Deal Marshall Space Flight Center, Huntsville, Ala. 256.544.0034 [email protected]
Related Terms
- Open Science
Explore More

NASA Mission Flies Over Arctic to Study Sea Ice Melt Causes
It’s not just rising air and water temperatures influencing the decades-long decline of Arctic sea ice. Clouds, aerosols, even the bumps and dips on the ice itself can play a role. To explore how these factors interact and impact sea ice melting, NASA is flying two aircraft equipped with scientific instruments over the Arctic Ocean […]

Twin NASA Satellites Ready to Help Gauge Earth’s Energy Balance
Information from the PREFIRE mission will illuminate how clouds and water vapor in the Arctic and Antarctic influence the amount of heat the poles radiate into space. A pair of new shoebox-size NASA satellites will help unravel an atmospheric mystery that’s bedeviled scientists for years: how the behavior of clouds and water vapor at Earth’s […]

Ongoing Venus Volcanic Activity Discovered With NASA’s Magellan Data
An analysis of data from Magellan’s radar finds two volcanoes erupted in the early 1990s. This adds to the 2023 discovery of a different active volcano in Magellan data. Direct geological evidence of recent volcanic activity on Venus has been observed for a second time. Scientists in Italy analyzed archival data from NASA’s Magellan mission […]
Home / Essay Samples / Sociology / Weather / Weather Monitoring System: A Project Report
Weather Monitoring System: A Project Report
- Category: Business , Information Science and Technology , Sociology
- Topic: Automation , Effects of Technology , Weather
Pages: 3 (1242 words)
Views: 2964
- Downloads: -->
Introduction
Related works, proposed system, hardware and software requirement.
- Raspberry pi 3: Raspberry Pi 3 B+ is a SOC (System on chip). It is a tiny computer board that comes with CPU, GPU, and USB ports, I/O pins, Wi-Fi, Bluetooth, USB and network boot and can do some functions like a regular computer. B+ model is same as b it just has a POE hat. It also contains two extra USB port.
- DHT11: This DHT11 Temperature and Humidity Sensor features a calibrated digital signal output with the temperature and humidity sensor complex. A high-performance 8-bit microcontroller is connected. It gives fast and accurate measurement of temperature and humidity.
- Thingspeak: ThingSpeak is an Internet of Things (IoT) platform that lets you collect and store sensor data in the cloud and develop IoT applications. With thingspeak we can analyse and visualize our data. Sensor data can be sent to ThingSpeak from Arduino, Raspberry Pi, and other hardware. IDLE (short for integrated development environment or integrated development and learning environment) is an integrated development environment for Python, which has been bundled with the default implementation of the language since 1. 5. 2b1.
- VNC Viewer: In computing, Virtual Network Computing (VNC) is a graphical desktop sharing system that uses the Remote Frame Buffer protocol (RFB) to remotely control another computer. It transmits the keyboard and mouse events from one computer to another, relaying the graphical screen updates back in the other direction, over a network. VNC is platform-independent there are clients and servers for many GUI-based operating systems and for Java. VNC was originally developed at the Olivetti & Oracle Research Lab in Cambridge, United Kingdom. The original VNC source code and many modern derivatives are open source under the GNU General Public License. There are many VNC servers we are using VNC viewer.
- Raspbian OS: Raspbian OS is one of the official operating systems available for free to download and use. The Raspbian desktop environment is known as the “Lightweight X11 Desktop Environment” or in short LXDE.
Implementation
- Component Description: The proposed system includes following components and also describe how the component will work. Raspberry Pi: Raspberry pi is the main unit of this system. With the help raspberry pi we are running the program to take data from DHT11 sensor and sending it to Thingspeak as well as displaying it on screen.
- HDMI Display: To see the current status of the weather as well as the sensors (humidity, pressure, temperature) and also we will able to check the updates regarding Raspberry Pi.
- DHT11 Sensor: With DHT11 sensor we are getting data related to temperature and humidity.
- Python: Python is a very easy to work on and it is the recommended programming language for raspberry pi. That’s the reason we use python as a programming language for our project.
- THINGSPEAK: With the help of Thingspeak we are displaying our weather report. Also, it has feature to choose to show data in both public and private view.
- Channel view: ThingSpeak channels store data sent to them from apps or devices. We have created our channel as Weather Monitoring Channel.
--> ⚠️ Remember: This essay was written and uploaded by an--> click here.
Found a great essay sample but want a unique one?
are ready to help you with your essay
You won’t be charged yet!
Rhetorical Strategies Essays
Propaganda Essays
Public Speaking Essays
Communication Skills Essays
First Impression Essays
Related Essays
We are glad that you like it, but you cannot copy from our website. Just insert your email and this sample will be sent to you.
By clicking “Send”, you agree to our Terms of service and Privacy statement . We will occasionally send you account related emails.
Your essay sample has been sent.
In fact, there is a way to get an original essay! Turn to our writers and order a plagiarism-free paper.
samplius.com uses cookies to offer you the best service possible.By continuing we’ll assume you board with our cookie policy .--> -->