
What Is A Research (Scientific) Hypothesis? A plain-language explainer + examples
By: Derek Jansen (MBA) | Reviewed By: Dr Eunice Rautenbach | June 2020
If you’re new to the world of research, or it’s your first time writing a dissertation or thesis, you’re probably noticing that the words “research hypothesis” and “scientific hypothesis” are used quite a bit, and you’re wondering what they mean in a research context .
“Hypothesis” is one of those words that people use loosely, thinking they understand what it means. However, it has a very specific meaning within academic research. So, it’s important to understand the exact meaning before you start hypothesizing.
Research Hypothesis 101
- What is a hypothesis ?
- What is a research hypothesis (scientific hypothesis)?
- Requirements for a research hypothesis
- Definition of a research hypothesis
- The null hypothesis
What is a hypothesis?
Let’s start with the general definition of a hypothesis (not a research hypothesis or scientific hypothesis), according to the Cambridge Dictionary:
Hypothesis: an idea or explanation for something that is based on known facts but has not yet been proved.
In other words, it’s a statement that provides an explanation for why or how something works, based on facts (or some reasonable assumptions), but that has not yet been specifically tested . For example, a hypothesis might look something like this:
Hypothesis: sleep impacts academic performance.
This statement predicts that academic performance will be influenced by the amount and/or quality of sleep a student engages in – sounds reasonable, right? It’s based on reasonable assumptions , underpinned by what we currently know about sleep and health (from the existing literature). So, loosely speaking, we could call it a hypothesis, at least by the dictionary definition.
But that’s not good enough…
Unfortunately, that’s not quite sophisticated enough to describe a research hypothesis (also sometimes called a scientific hypothesis), and it wouldn’t be acceptable in a dissertation, thesis or research paper . In the world of academic research, a statement needs a few more criteria to constitute a true research hypothesis .
What is a research hypothesis?
A research hypothesis (also called a scientific hypothesis) is a statement about the expected outcome of a study (for example, a dissertation or thesis). To constitute a quality hypothesis, the statement needs to have three attributes – specificity , clarity and testability .
Let’s take a look at these more closely.
Need a helping hand?
Hypothesis Essential #1: Specificity & Clarity
A good research hypothesis needs to be extremely clear and articulate about both what’ s being assessed (who or what variables are involved ) and the expected outcome (for example, a difference between groups, a relationship between variables, etc.).
Let’s stick with our sleepy students example and look at how this statement could be more specific and clear.
Hypothesis: Students who sleep at least 8 hours per night will, on average, achieve higher grades in standardised tests than students who sleep less than 8 hours a night.
As you can see, the statement is very specific as it identifies the variables involved (sleep hours and test grades), the parties involved (two groups of students), as well as the predicted relationship type (a positive relationship). There’s no ambiguity or uncertainty about who or what is involved in the statement, and the expected outcome is clear.
Contrast that to the original hypothesis we looked at – “Sleep impacts academic performance” – and you can see the difference. “Sleep” and “academic performance” are both comparatively vague , and there’s no indication of what the expected relationship direction is (more sleep or less sleep). As you can see, specificity and clarity are key.

Hypothesis Essential #2: Testability (Provability)
A statement must be testable to qualify as a research hypothesis. In other words, there needs to be a way to prove (or disprove) the statement. If it’s not testable, it’s not a hypothesis – simple as that.
For example, consider the hypothesis we mentioned earlier:
Hypothesis: Students who sleep at least 8 hours per night will, on average, achieve higher grades in standardised tests than students who sleep less than 8 hours a night.
We could test this statement by undertaking a quantitative study involving two groups of students, one that gets 8 or more hours of sleep per night for a fixed period, and one that gets less. We could then compare the standardised test results for both groups to see if there’s a statistically significant difference.
Again, if you compare this to the original hypothesis we looked at – “Sleep impacts academic performance” – you can see that it would be quite difficult to test that statement, primarily because it isn’t specific enough. How much sleep? By who? What type of academic performance?
So, remember the mantra – if you can’t test it, it’s not a hypothesis 🙂

Defining A Research Hypothesis
You’re still with us? Great! Let’s recap and pin down a clear definition of a hypothesis.
A research hypothesis (or scientific hypothesis) is a statement about an expected relationship between variables, or explanation of an occurrence, that is clear, specific and testable.
So, when you write up hypotheses for your dissertation or thesis, make sure that they meet all these criteria. If you do, you’ll not only have rock-solid hypotheses but you’ll also ensure a clear focus for your entire research project.
What about the null hypothesis?
You may have also heard the terms null hypothesis , alternative hypothesis, or H-zero thrown around. At a simple level, the null hypothesis is the counter-proposal to the original hypothesis.
For example, if the hypothesis predicts that there is a relationship between two variables (for example, sleep and academic performance), the null hypothesis would predict that there is no relationship between those variables.
At a more technical level, the null hypothesis proposes that no statistical significance exists in a set of given observations and that any differences are due to chance alone.
And there you have it – hypotheses in a nutshell.
If you have any questions, be sure to leave a comment below and we’ll do our best to help you. If you need hands-on help developing and testing your hypotheses, consider our private coaching service , where we hold your hand through the research journey.

Psst... there’s more!
This post was based on one of our popular Research Bootcamps . If you're working on a research project, you'll definitely want to check this out ...
You Might Also Like:

16 Comments

Very useful information. I benefit more from getting more information in this regard.

Very great insight,educative and informative. Please give meet deep critics on many research data of public international Law like human rights, environment, natural resources, law of the sea etc

In a book I read a distinction is made between null, research, and alternative hypothesis. As far as I understand, alternative and research hypotheses are the same. Can you please elaborate? Best Afshin

This is a self explanatory, easy going site. I will recommend this to my friends and colleagues.

Very good definition. How can I cite your definition in my thesis? Thank you. Is nul hypothesis compulsory in a research?

It’s a counter-proposal to be proven as a rejection

Please what is the difference between alternate hypothesis and research hypothesis?

It is a very good explanation. However, it limits hypotheses to statistically tasteable ideas. What about for qualitative researches or other researches that involve quantitative data that don’t need statistical tests?

In qualitative research, one typically uses propositions, not hypotheses.

could you please elaborate it more

I’ve benefited greatly from these notes, thank you.

This is very helpful

well articulated ideas are presented here, thank you for being reliable sources of information

Excellent. Thanks for being clear and sound about the research methodology and hypothesis (quantitative research)
I have only a simple question regarding the null hypothesis. – Is the null hypothesis (Ho) known as the reversible hypothesis of the alternative hypothesis (H1? – How to test it in academic research?

this is very important note help me much more
Trackbacks/Pingbacks
- What Is Research Methodology? Simple Definition (With Examples) - Grad Coach - […] Contrasted to this, a quantitative methodology is typically used when the research aims and objectives are confirmatory in nature. For example,…
Submit a Comment Cancel reply
Your email address will not be published. Required fields are marked *
Save my name, email, and website in this browser for the next time I comment.
- Print Friendly
- Skip to main content
- Skip to primary sidebar
- Skip to footer
- QuestionPro

- Solutions Industries Gaming Automotive Sports and events Education Government Travel & Hospitality Financial Services Healthcare Cannabis Technology Use Case NPS+ Communities Audience Contactless surveys Mobile LivePolls Member Experience GDPR Positive People Science 360 Feedback Surveys
- Resources Blog eBooks Survey Templates Case Studies Training Help center
Home Market Research
Research Hypothesis: What It Is, Types + How to Develop?

A research study starts with a question. Researchers worldwide ask questions and create research hypotheses. The effectiveness of research relies on developing a good research hypothesis. Examples of research hypotheses can guide researchers in writing effective ones.
In this blog, we’ll learn what a research hypothesis is, why it’s important in research, and the different types used in science. We’ll also guide you through creating your research hypothesis and discussing ways to test and evaluate it.
What is a Research Hypothesis?
A hypothesis is like a guess or idea that you suggest to check if it’s true. A research hypothesis is a statement that brings up a question and predicts what might happen.
It’s really important in the scientific method and is used in experiments to figure things out. Essentially, it’s an educated guess about how things are connected in the research.
A research hypothesis usually includes pointing out the independent variable (the thing they’re changing or studying) and the dependent variable (the result they’re measuring or watching). It helps plan how to gather and analyze data to see if there’s evidence to support or deny the expected connection between these variables.
Importance of Hypothesis in Research
Hypotheses are really important in research. They help design studies, allow for practical testing, and add to our scientific knowledge. Their main role is to organize research projects, making them purposeful, focused, and valuable to the scientific community. Let’s look at some key reasons why they matter:
- A research hypothesis helps test theories.
A hypothesis plays a pivotal role in the scientific method by providing a basis for testing existing theories. For example, a hypothesis might test the predictive power of a psychological theory on human behavior.
- It serves as a great platform for investigation activities.
It serves as a launching pad for investigation activities, which offers researchers a clear starting point. A research hypothesis can explore the relationship between exercise and stress reduction.
- Hypothesis guides the research work or study.
A well-formulated hypothesis guides the entire research process. It ensures that the study remains focused and purposeful. For instance, a hypothesis about the impact of social media on interpersonal relationships provides clear guidance for a study.
- Hypothesis sometimes suggests theories.
In some cases, a hypothesis can suggest new theories or modifications to existing ones. For example, a hypothesis testing the effectiveness of a new drug might prompt a reconsideration of current medical theories.
- It helps in knowing the data needs.
A hypothesis clarifies the data requirements for a study, ensuring that researchers collect the necessary information—a hypothesis guiding the collection of demographic data to analyze the influence of age on a particular phenomenon.
- The hypothesis explains social phenomena.
Hypotheses are instrumental in explaining complex social phenomena. For instance, a hypothesis might explore the relationship between economic factors and crime rates in a given community.
- Hypothesis provides a relationship between phenomena for empirical Testing.
Hypotheses establish clear relationships between phenomena, paving the way for empirical testing. An example could be a hypothesis exploring the correlation between sleep patterns and academic performance.
- It helps in knowing the most suitable analysis technique.
A hypothesis guides researchers in selecting the most appropriate analysis techniques for their data. For example, a hypothesis focusing on the effectiveness of a teaching method may lead to the choice of statistical analyses best suited for educational research.
Characteristics of a Good Research Hypothesis
A hypothesis is a specific idea that you can test in a study. It often comes from looking at past research and theories. A good hypothesis usually starts with a research question that you can explore through background research. For it to be effective, consider these key characteristics:
- Clear and Focused Language: A good hypothesis uses clear and focused language to avoid confusion and ensure everyone understands it.
- Related to the Research Topic: The hypothesis should directly relate to the research topic, acting as a bridge between the specific question and the broader study.
- Testable: An effective hypothesis can be tested, meaning its prediction can be checked with real data to support or challenge the proposed relationship.
- Potential for Exploration: A good hypothesis often comes from a research question that invites further exploration. Doing background research helps find gaps and potential areas to investigate.
- Includes Variables: The hypothesis should clearly state both the independent and dependent variables, specifying the factors being studied and the expected outcomes.
- Ethical Considerations: Check if variables can be manipulated without breaking ethical standards. It’s crucial to maintain ethical research practices.
- Predicts Outcomes: The hypothesis should predict the expected relationship and outcome, acting as a roadmap for the study and guiding data collection and analysis.
- Simple and Concise: A good hypothesis avoids unnecessary complexity and is simple and concise, expressing the essence of the proposed relationship clearly.
- Clear and Assumption-Free: The hypothesis should be clear and free from assumptions about the reader’s prior knowledge, ensuring universal understanding.
- Observable and Testable Results: A strong hypothesis implies research that produces observable and testable results, making sure the study’s outcomes can be effectively measured and analyzed.
When you use these characteristics as a checklist, it can help you create a good research hypothesis. It’ll guide improving and strengthening the hypothesis, identifying any weaknesses, and making necessary changes. Crafting a hypothesis with these features helps you conduct a thorough and insightful research study.
Types of Research Hypotheses
The research hypothesis comes in various types, each serving a specific purpose in guiding the scientific investigation. Knowing the differences will make it easier for you to create your own hypothesis. Here’s an overview of the common types:
01. Null Hypothesis
The null hypothesis states that there is no connection between two considered variables or that two groups are unrelated. As discussed earlier, a hypothesis is an unproven assumption lacking sufficient supporting data. It serves as the statement researchers aim to disprove. It is testable, verifiable, and can be rejected.
For example, if you’re studying the relationship between Project A and Project B, assuming both projects are of equal standard is your null hypothesis. It needs to be specific for your study.
02. Alternative Hypothesis
The alternative hypothesis is basically another option to the null hypothesis. It involves looking for a significant change or alternative that could lead you to reject the null hypothesis. It’s a different idea compared to the null hypothesis.
When you create a null hypothesis, you’re making an educated guess about whether something is true or if there’s a connection between that thing and another variable. If the null view suggests something is correct, the alternative hypothesis says it’s incorrect.
For instance, if your null hypothesis is “I’m going to be $1000 richer,” the alternative hypothesis would be “I’m not going to get $1000 or be richer.”
03. Directional Hypothesis
The directional hypothesis predicts the direction of the relationship between independent and dependent variables. They specify whether the effect will be positive or negative.
If you increase your study hours, you will experience a positive association with your exam scores. This hypothesis suggests that as you increase the independent variable (study hours), there will also be an increase in the dependent variable (exam scores).
04. Non-directional Hypothesis
The non-directional hypothesis predicts the existence of a relationship between variables but does not specify the direction of the effect. It suggests that there will be a significant difference or relationship, but it does not predict the nature of that difference.
For example, you will find no notable difference in test scores between students who receive the educational intervention and those who do not. However, once you compare the test scores of the two groups, you will notice an important difference.
05. Simple Hypothesis
A simple hypothesis predicts a relationship between one dependent variable and one independent variable without specifying the nature of that relationship. It’s simple and usually used when we don’t know much about how the two things are connected.
For example, if you adopt effective study habits, you will achieve higher exam scores than those with poor study habits.
06. Complex Hypothesis
A complex hypothesis is an idea that specifies a relationship between multiple independent and dependent variables. It is a more detailed idea than a simple hypothesis.
While a simple view suggests a straightforward cause-and-effect relationship between two things, a complex hypothesis involves many factors and how they’re connected to each other.
For example, when you increase your study time, you tend to achieve higher exam scores. The connection between your study time and exam performance is affected by various factors, including the quality of your sleep, your motivation levels, and the effectiveness of your study techniques.
If you sleep well, stay highly motivated, and use effective study strategies, you may observe a more robust positive correlation between the time you spend studying and your exam scores, unlike those who may lack these factors.
07. Associative Hypothesis
An associative hypothesis proposes a connection between two things without saying that one causes the other. Basically, it suggests that when one thing changes, the other changes too, but it doesn’t claim that one thing is causing the change in the other.
For example, you will likely notice higher exam scores when you increase your study time. You can recognize an association between your study time and exam scores in this scenario.
Your hypothesis acknowledges a relationship between the two variables—your study time and exam scores—without asserting that increased study time directly causes higher exam scores. You need to consider that other factors, like motivation or learning style, could affect the observed association.
08. Causal Hypothesis
A causal hypothesis proposes a cause-and-effect relationship between two variables. It suggests that changes in one variable directly cause changes in another variable.
For example, when you increase your study time, you experience higher exam scores. This hypothesis suggests a direct cause-and-effect relationship, indicating that the more time you spend studying, the higher your exam scores. It assumes that changes in your study time directly influence changes in your exam performance.
09. Empirical Hypothesis
An empirical hypothesis is a statement based on things we can see and measure. It comes from direct observation or experiments and can be tested with real-world evidence. If an experiment proves a theory, it supports the idea and shows it’s not just a guess. This makes the statement more reliable than a wild guess.
For example, if you increase the dosage of a certain medication, you might observe a quicker recovery time for patients. Imagine you’re in charge of a clinical trial. In this trial, patients are given varying dosages of the medication, and you measure and compare their recovery times. This allows you to directly see the effects of different dosages on how fast patients recover.
This way, you can create a research hypothesis: “Increasing the dosage of a certain medication will lead to a faster recovery time for patients.”
10. Statistical Hypothesis
A statistical hypothesis is a statement or assumption about a population parameter that is the subject of an investigation. It serves as the basis for statistical analysis and testing. It is often tested using statistical methods to draw inferences about the larger population.
In a hypothesis test, statistical evidence is collected to either reject the null hypothesis in favor of the alternative hypothesis or fail to reject the null hypothesis due to insufficient evidence.
For example, let’s say you’re testing a new medicine. Your hypothesis could be that the medicine doesn’t really help patients get better. So, you collect data and use statistics to see if your guess is right or if the medicine actually makes a difference.
If the data strongly shows that the medicine does help, you say your guess was wrong, and the medicine does make a difference. But if the proof isn’t strong enough, you can stick with your original guess because you didn’t get enough evidence to change your mind.
How to Develop a Research Hypotheses?
Step 1: identify your research problem or topic..
Define the area of interest or the problem you want to investigate. Make sure it’s clear and well-defined.
Start by asking a question about your chosen topic. Consider the limitations of your research and create a straightforward problem related to your topic. Once you’ve done that, you can develop and test a hypothesis with evidence.
Step 2: Conduct a literature review
Review existing literature related to your research problem. This will help you understand the current state of knowledge in the field, identify gaps, and build a foundation for your hypothesis. Consider the following questions:
- What existing research has been conducted on your chosen topic?
- Are there any gaps or unanswered questions in the current literature?
- How will the existing literature contribute to the foundation of your research?
Step 3: Formulate your research question
Based on your literature review, create a specific and concise research question that addresses your identified problem. Your research question should be clear, focused, and relevant to your field of study.
Step 4: Identify variables
Determine the key variables involved in your research question. Variables are the factors or phenomena that you will study and manipulate to test your hypothesis.
- Independent Variable: The variable you manipulate or control.
- Dependent Variable: The variable you measure to observe the effect of the independent variable.
Step 5: State the Null hypothesis
The null hypothesis is a statement that there is no significant difference or effect. It serves as a baseline for comparison with the alternative hypothesis.
Step 6: Select appropriate methods for testing the hypothesis
Choose research methods that align with your study objectives, such as experiments, surveys, or observational studies. The selected methods enable you to test your research hypothesis effectively.
Creating a research hypothesis usually takes more than one try. Expect to make changes as you collect data. It’s normal to test and say no to a few hypotheses before you find the right answer to your research question.
Testing and Evaluating Hypotheses
Testing hypotheses is a really important part of research. It’s like the practical side of things. Here, real-world evidence will help you determine how different things are connected. Let’s explore the main steps in hypothesis testing:
- State your research hypothesis.
Before testing, clearly articulate your research hypothesis. This involves framing both a null hypothesis, suggesting no significant effect or relationship, and an alternative hypothesis, proposing the expected outcome.
- Collect data strategically.
Plan how you will gather information in a way that fits your study. Make sure your data collection method matches the things you’re studying.
Whether through surveys, observations, or experiments, this step demands precision and adherence to the established methodology. The quality of data collected directly influences the credibility of study outcomes.
- Perform an appropriate statistical test.
Choose a statistical test that aligns with the nature of your data and the hypotheses being tested. Whether it’s a t-test, chi-square test, ANOVA, or regression analysis, selecting the right statistical tool is paramount for accurate and reliable results.
- Decide if your idea was right or wrong.
Following the statistical analysis, evaluate the results in the context of your null hypothesis. You need to decide if you should reject your null hypothesis or not.
- Share what you found.
When discussing what you found in your research, be clear and organized. Say whether your idea was supported or not, and talk about what your results mean. Also, mention any limits to your study and suggest ideas for future research.
The Role of QuestionPro to Develop a Good Research Hypothesis
QuestionPro is a survey and research platform that provides tools for creating, distributing, and analyzing surveys. It plays a crucial role in the research process, especially when you’re in the initial stages of hypothesis development. Here’s how QuestionPro can help you to develop a good research hypothesis:
- Survey design and data collection: You can use the platform to create targeted questions that help you gather relevant data.
- Exploratory research: Through surveys and feedback mechanisms on QuestionPro, you can conduct exploratory research to understand the landscape of a particular subject.
- Literature review and background research: QuestionPro surveys can collect sample population opinions, experiences, and preferences. This data and a thorough literature evaluation can help you generate a well-grounded hypothesis by improving your research knowledge.
- Identifying variables: Using targeted survey questions, you can identify relevant variables related to their research topic.
- Testing assumptions: You can use surveys to informally test certain assumptions or hypotheses before formalizing a research hypothesis.
- Data analysis tools: QuestionPro provides tools for analyzing survey data. You can use these tools to identify the collected data’s patterns, correlations, or trends.
- Refining your hypotheses: As you collect data through QuestionPro, you can adjust your hypotheses based on the real-world responses you receive.
A research hypothesis is like a guide for researchers in science. It’s a well-thought-out idea that has been thoroughly tested. This idea is crucial as researchers can explore different fields, such as medicine, social sciences, and natural sciences. The research hypothesis links theories to real-world evidence and gives researchers a clear path to explore and make discoveries.
QuestionPro Research Suite is a helpful tool for researchers. It makes creating surveys, collecting data, and analyzing information easily. It supports all kinds of research, from exploring new ideas to forming hypotheses. With a focus on using data, it helps researchers do their best work.
Are you interested in learning more about QuestionPro Research Suite? Take advantage of QuestionPro’s free trial to get an initial look at its capabilities and realize the full potential of your research efforts.
LEARN MORE FREE TRIAL
MORE LIKE THIS

Life@QuestionPro: The Journey of Kristie Lawrence
Jun 7, 2024

How Can I Help You? — Tuesday CX Thoughts
Jun 5, 2024

Why Multilingual 360 Feedback Surveys Provide Better Insights
Jun 3, 2024

Raked Weighting: A Key Tool for Accurate Survey Results
May 31, 2024
Other categories
- Academic Research
- Artificial Intelligence
- Assessments
- Brand Awareness
- Case Studies
- Communities
- Consumer Insights
- Customer effort score
- Customer Engagement
- Customer Experience
- Customer Loyalty
- Customer Research
- Customer Satisfaction
- Employee Benefits
- Employee Engagement
- Employee Retention
- Friday Five
- General Data Protection Regulation
- Insights Hub
- Life@QuestionPro
- Market Research
- Mobile diaries
- Mobile Surveys
- New Features
- Online Communities
- Question Types
- Questionnaire
- QuestionPro Products
- Release Notes
- Research Tools and Apps
- Revenue at Risk
- Survey Templates
- Training Tips
- Uncategorized
- Video Learning Series
- What’s Coming Up
- Workforce Intelligence
- Resources Home 🏠
- Try SciSpace Copilot
- Search research papers
- Add Copilot Extension
- Try AI Detector
- Try Paraphraser
- Try Citation Generator
- April Papers
- June Papers
- July Papers

The Craft of Writing a Strong Hypothesis

Table of Contents
Writing a hypothesis is one of the essential elements of a scientific research paper. It needs to be to the point, clearly communicating what your research is trying to accomplish. A blurry, drawn-out, or complexly-structured hypothesis can confuse your readers. Or worse, the editor and peer reviewers.
A captivating hypothesis is not too intricate. This blog will take you through the process so that, by the end of it, you have a better idea of how to convey your research paper's intent in just one sentence.
What is a Hypothesis?
The first step in your scientific endeavor, a hypothesis, is a strong, concise statement that forms the basis of your research. It is not the same as a thesis statement , which is a brief summary of your research paper .
The sole purpose of a hypothesis is to predict your paper's findings, data, and conclusion. It comes from a place of curiosity and intuition . When you write a hypothesis, you're essentially making an educated guess based on scientific prejudices and evidence, which is further proven or disproven through the scientific method.
The reason for undertaking research is to observe a specific phenomenon. A hypothesis, therefore, lays out what the said phenomenon is. And it does so through two variables, an independent and dependent variable.
The independent variable is the cause behind the observation, while the dependent variable is the effect of the cause. A good example of this is “mixing red and blue forms purple.” In this hypothesis, mixing red and blue is the independent variable as you're combining the two colors at your own will. The formation of purple is the dependent variable as, in this case, it is conditional to the independent variable.
Different Types of Hypotheses

Types of hypotheses
Some would stand by the notion that there are only two types of hypotheses: a Null hypothesis and an Alternative hypothesis. While that may have some truth to it, it would be better to fully distinguish the most common forms as these terms come up so often, which might leave you out of context.
Apart from Null and Alternative, there are Complex, Simple, Directional, Non-Directional, Statistical, and Associative and casual hypotheses. They don't necessarily have to be exclusive, as one hypothesis can tick many boxes, but knowing the distinctions between them will make it easier for you to construct your own.
1. Null hypothesis
A null hypothesis proposes no relationship between two variables. Denoted by H 0 , it is a negative statement like “Attending physiotherapy sessions does not affect athletes' on-field performance.” Here, the author claims physiotherapy sessions have no effect on on-field performances. Even if there is, it's only a coincidence.
2. Alternative hypothesis
Considered to be the opposite of a null hypothesis, an alternative hypothesis is donated as H1 or Ha. It explicitly states that the dependent variable affects the independent variable. A good alternative hypothesis example is “Attending physiotherapy sessions improves athletes' on-field performance.” or “Water evaporates at 100 °C. ” The alternative hypothesis further branches into directional and non-directional.
- Directional hypothesis: A hypothesis that states the result would be either positive or negative is called directional hypothesis. It accompanies H1 with either the ‘<' or ‘>' sign.
- Non-directional hypothesis: A non-directional hypothesis only claims an effect on the dependent variable. It does not clarify whether the result would be positive or negative. The sign for a non-directional hypothesis is ‘≠.'
3. Simple hypothesis
A simple hypothesis is a statement made to reflect the relation between exactly two variables. One independent and one dependent. Consider the example, “Smoking is a prominent cause of lung cancer." The dependent variable, lung cancer, is dependent on the independent variable, smoking.
4. Complex hypothesis
In contrast to a simple hypothesis, a complex hypothesis implies the relationship between multiple independent and dependent variables. For instance, “Individuals who eat more fruits tend to have higher immunity, lesser cholesterol, and high metabolism.” The independent variable is eating more fruits, while the dependent variables are higher immunity, lesser cholesterol, and high metabolism.
5. Associative and casual hypothesis
Associative and casual hypotheses don't exhibit how many variables there will be. They define the relationship between the variables. In an associative hypothesis, changing any one variable, dependent or independent, affects others. In a casual hypothesis, the independent variable directly affects the dependent.
6. Empirical hypothesis
Also referred to as the working hypothesis, an empirical hypothesis claims a theory's validation via experiments and observation. This way, the statement appears justifiable and different from a wild guess.
Say, the hypothesis is “Women who take iron tablets face a lesser risk of anemia than those who take vitamin B12.” This is an example of an empirical hypothesis where the researcher the statement after assessing a group of women who take iron tablets and charting the findings.
7. Statistical hypothesis
The point of a statistical hypothesis is to test an already existing hypothesis by studying a population sample. Hypothesis like “44% of the Indian population belong in the age group of 22-27.” leverage evidence to prove or disprove a particular statement.
Characteristics of a Good Hypothesis
Writing a hypothesis is essential as it can make or break your research for you. That includes your chances of getting published in a journal. So when you're designing one, keep an eye out for these pointers:
- A research hypothesis has to be simple yet clear to look justifiable enough.
- It has to be testable — your research would be rendered pointless if too far-fetched into reality or limited by technology.
- It has to be precise about the results —what you are trying to do and achieve through it should come out in your hypothesis.
- A research hypothesis should be self-explanatory, leaving no doubt in the reader's mind.
- If you are developing a relational hypothesis, you need to include the variables and establish an appropriate relationship among them.
- A hypothesis must keep and reflect the scope for further investigations and experiments.
Separating a Hypothesis from a Prediction
Outside of academia, hypothesis and prediction are often used interchangeably. In research writing, this is not only confusing but also incorrect. And although a hypothesis and prediction are guesses at their core, there are many differences between them.
A hypothesis is an educated guess or even a testable prediction validated through research. It aims to analyze the gathered evidence and facts to define a relationship between variables and put forth a logical explanation behind the nature of events.
Predictions are assumptions or expected outcomes made without any backing evidence. They are more fictionally inclined regardless of where they originate from.
For this reason, a hypothesis holds much more weight than a prediction. It sticks to the scientific method rather than pure guesswork. "Planets revolve around the Sun." is an example of a hypothesis as it is previous knowledge and observed trends. Additionally, we can test it through the scientific method.
Whereas "COVID-19 will be eradicated by 2030." is a prediction. Even though it results from past trends, we can't prove or disprove it. So, the only way this gets validated is to wait and watch if COVID-19 cases end by 2030.
Finally, How to Write a Hypothesis

Quick tips on writing a hypothesis
1. Be clear about your research question
A hypothesis should instantly address the research question or the problem statement. To do so, you need to ask a question. Understand the constraints of your undertaken research topic and then formulate a simple and topic-centric problem. Only after that can you develop a hypothesis and further test for evidence.
2. Carry out a recce
Once you have your research's foundation laid out, it would be best to conduct preliminary research. Go through previous theories, academic papers, data, and experiments before you start curating your research hypothesis. It will give you an idea of your hypothesis's viability or originality.
Making use of references from relevant research papers helps draft a good research hypothesis. SciSpace Discover offers a repository of over 270 million research papers to browse through and gain a deeper understanding of related studies on a particular topic. Additionally, you can use SciSpace Copilot , your AI research assistant, for reading any lengthy research paper and getting a more summarized context of it. A hypothesis can be formed after evaluating many such summarized research papers. Copilot also offers explanations for theories and equations, explains paper in simplified version, allows you to highlight any text in the paper or clip math equations and tables and provides a deeper, clear understanding of what is being said. This can improve the hypothesis by helping you identify potential research gaps.
3. Create a 3-dimensional hypothesis
Variables are an essential part of any reasonable hypothesis. So, identify your independent and dependent variable(s) and form a correlation between them. The ideal way to do this is to write the hypothetical assumption in the ‘if-then' form. If you use this form, make sure that you state the predefined relationship between the variables.
In another way, you can choose to present your hypothesis as a comparison between two variables. Here, you must specify the difference you expect to observe in the results.
4. Write the first draft
Now that everything is in place, it's time to write your hypothesis. For starters, create the first draft. In this version, write what you expect to find from your research.
Clearly separate your independent and dependent variables and the link between them. Don't fixate on syntax at this stage. The goal is to ensure your hypothesis addresses the issue.
5. Proof your hypothesis
After preparing the first draft of your hypothesis, you need to inspect it thoroughly. It should tick all the boxes, like being concise, straightforward, relevant, and accurate. Your final hypothesis has to be well-structured as well.
Research projects are an exciting and crucial part of being a scholar. And once you have your research question, you need a great hypothesis to begin conducting research. Thus, knowing how to write a hypothesis is very important.
Now that you have a firmer grasp on what a good hypothesis constitutes, the different kinds there are, and what process to follow, you will find it much easier to write your hypothesis, which ultimately helps your research.
Now it's easier than ever to streamline your research workflow with SciSpace Discover . Its integrated, comprehensive end-to-end platform for research allows scholars to easily discover, write and publish their research and fosters collaboration.
It includes everything you need, including a repository of over 270 million research papers across disciplines, SEO-optimized summaries and public profiles to show your expertise and experience.
If you found these tips on writing a research hypothesis useful, head over to our blog on Statistical Hypothesis Testing to learn about the top researchers, papers, and institutions in this domain.
Frequently Asked Questions (FAQs)
1. what is the definition of hypothesis.
According to the Oxford dictionary, a hypothesis is defined as “An idea or explanation of something that is based on a few known facts, but that has not yet been proved to be true or correct”.
2. What is an example of hypothesis?
The hypothesis is a statement that proposes a relationship between two or more variables. An example: "If we increase the number of new users who join our platform by 25%, then we will see an increase in revenue."
3. What is an example of null hypothesis?
A null hypothesis is a statement that there is no relationship between two variables. The null hypothesis is written as H0. The null hypothesis states that there is no effect. For example, if you're studying whether or not a particular type of exercise increases strength, your null hypothesis will be "there is no difference in strength between people who exercise and people who don't."
4. What are the types of research?
• Fundamental research
• Applied research
• Qualitative research
• Quantitative research
• Mixed research
• Exploratory research
• Longitudinal research
• Cross-sectional research
• Field research
• Laboratory research
• Fixed research
• Flexible research
• Action research
• Policy research
• Classification research
• Comparative research
• Causal research
• Inductive research
• Deductive research
5. How to write a hypothesis?
• Your hypothesis should be able to predict the relationship and outcome.
• Avoid wordiness by keeping it simple and brief.
• Your hypothesis should contain observable and testable outcomes.
• Your hypothesis should be relevant to the research question.
6. What are the 2 types of hypothesis?
• Null hypotheses are used to test the claim that "there is no difference between two groups of data".
• Alternative hypotheses test the claim that "there is a difference between two data groups".
7. Difference between research question and research hypothesis?
A research question is a broad, open-ended question you will try to answer through your research. A hypothesis is a statement based on prior research or theory that you expect to be true due to your study. Example - Research question: What are the factors that influence the adoption of the new technology? Research hypothesis: There is a positive relationship between age, education and income level with the adoption of the new technology.
8. What is plural for hypothesis?
The plural of hypothesis is hypotheses. Here's an example of how it would be used in a statement, "Numerous well-considered hypotheses are presented in this part, and they are supported by tables and figures that are well-illustrated."
9. What is the red queen hypothesis?
The red queen hypothesis in evolutionary biology states that species must constantly evolve to avoid extinction because if they don't, they will be outcompeted by other species that are evolving. Leigh Van Valen first proposed it in 1973; since then, it has been tested and substantiated many times.
10. Who is known as the father of null hypothesis?
The father of the null hypothesis is Sir Ronald Fisher. He published a paper in 1925 that introduced the concept of null hypothesis testing, and he was also the first to use the term itself.
11. When to reject null hypothesis?
You need to find a significant difference between your two populations to reject the null hypothesis. You can determine that by running statistical tests such as an independent sample t-test or a dependent sample t-test. You should reject the null hypothesis if the p-value is less than 0.05.
You might also like

Consensus GPT vs. SciSpace GPT: Choose the Best GPT for Research

Literature Review and Theoretical Framework: Understanding the Differences

Types of Essays in Academic Writing - Quick Guide (2024)
- Bipolar Disorder
- Therapy Center
- When To See a Therapist
- Types of Therapy
- Best Online Therapy
- Best Couples Therapy
- Best Family Therapy
- Managing Stress
- Sleep and Dreaming
- Understanding Emotions
- Self-Improvement
- Healthy Relationships
- Student Resources
- Personality Types
- Guided Meditations
- Verywell Mind Insights
- 2024 Verywell Mind 25
- Mental Health in the Classroom
- Editorial Process
- Meet Our Review Board
- Crisis Support
How to Write a Great Hypothesis
Hypothesis Definition, Format, Examples, and Tips
Kendra Cherry, MS, is a psychosocial rehabilitation specialist, psychology educator, and author of the "Everything Psychology Book."
:max_bytes(150000):strip_icc():format(webp)/IMG_9791-89504ab694d54b66bbd72cb84ffb860e.jpg "a research hypothesis is")
Amy Morin, LCSW, is a psychotherapist and international bestselling author. Her books, including "13 Things Mentally Strong People Don't Do," have been translated into more than 40 languages. Her TEDx talk, "The Secret of Becoming Mentally Strong," is one of the most viewed talks of all time.
:max_bytes(150000):strip_icc():format(webp)/VW-MIND-Amy-2b338105f1ee493f94d7e333e410fa76.jpg "a research hypothesis is")
Verywell / Alex Dos Diaz
- The Scientific Method
Hypothesis Format
Falsifiability of a hypothesis.
- Operationalization
Hypothesis Types
Hypotheses examples.
- Collecting Data
A hypothesis is a tentative statement about the relationship between two or more variables. It is a specific, testable prediction about what you expect to happen in a study. It is a preliminary answer to your question that helps guide the research process.
Consider a study designed to examine the relationship between sleep deprivation and test performance. The hypothesis might be: "This study is designed to assess the hypothesis that sleep-deprived people will perform worse on a test than individuals who are not sleep-deprived."
At a Glance
A hypothesis is crucial to scientific research because it offers a clear direction for what the researchers are looking to find. This allows them to design experiments to test their predictions and add to our scientific knowledge about the world. This article explores how a hypothesis is used in psychology research, how to write a good hypothesis, and the different types of hypotheses you might use.
The Hypothesis in the Scientific Method
In the scientific method , whether it involves research in psychology, biology, or some other area, a hypothesis represents what the researchers think will happen in an experiment. The scientific method involves the following steps:
- Forming a question
- Performing background research
- Creating a hypothesis
- Designing an experiment
- Collecting data
- Analyzing the results
- Drawing conclusions
- Communicating the results
The hypothesis is a prediction, but it involves more than a guess. Most of the time, the hypothesis begins with a question which is then explored through background research. At this point, researchers then begin to develop a testable hypothesis.
Unless you are creating an exploratory study, your hypothesis should always explain what you expect to happen.
In a study exploring the effects of a particular drug, the hypothesis might be that researchers expect the drug to have some type of effect on the symptoms of a specific illness. In psychology, the hypothesis might focus on how a certain aspect of the environment might influence a particular behavior.
Remember, a hypothesis does not have to be correct. While the hypothesis predicts what the researchers expect to see, the goal of the research is to determine whether this guess is right or wrong. When conducting an experiment, researchers might explore numerous factors to determine which ones might contribute to the ultimate outcome.
In many cases, researchers may find that the results of an experiment do not support the original hypothesis. When writing up these results, the researchers might suggest other options that should be explored in future studies.
In many cases, researchers might draw a hypothesis from a specific theory or build on previous research. For example, prior research has shown that stress can impact the immune system. So a researcher might hypothesize: "People with high-stress levels will be more likely to contract a common cold after being exposed to the virus than people who have low-stress levels."
In other instances, researchers might look at commonly held beliefs or folk wisdom. "Birds of a feather flock together" is one example of folk adage that a psychologist might try to investigate. The researcher might pose a specific hypothesis that "People tend to select romantic partners who are similar to them in interests and educational level."
Elements of a Good Hypothesis
So how do you write a good hypothesis? When trying to come up with a hypothesis for your research or experiments, ask yourself the following questions:
- Is your hypothesis based on your research on a topic?
- Can your hypothesis be tested?
- Does your hypothesis include independent and dependent variables?
Before you come up with a specific hypothesis, spend some time doing background research. Once you have completed a literature review, start thinking about potential questions you still have. Pay attention to the discussion section in the journal articles you read . Many authors will suggest questions that still need to be explored.
How to Formulate a Good Hypothesis
To form a hypothesis, you should take these steps:
- Collect as many observations about a topic or problem as you can.
- Evaluate these observations and look for possible causes of the problem.
- Create a list of possible explanations that you might want to explore.
- After you have developed some possible hypotheses, think of ways that you could confirm or disprove each hypothesis through experimentation. This is known as falsifiability.
In the scientific method , falsifiability is an important part of any valid hypothesis. In order to test a claim scientifically, it must be possible that the claim could be proven false.
Students sometimes confuse the idea of falsifiability with the idea that it means that something is false, which is not the case. What falsifiability means is that if something was false, then it is possible to demonstrate that it is false.
One of the hallmarks of pseudoscience is that it makes claims that cannot be refuted or proven false.
The Importance of Operational Definitions
A variable is a factor or element that can be changed and manipulated in ways that are observable and measurable. However, the researcher must also define how the variable will be manipulated and measured in the study.
Operational definitions are specific definitions for all relevant factors in a study. This process helps make vague or ambiguous concepts detailed and measurable.
For example, a researcher might operationally define the variable " test anxiety " as the results of a self-report measure of anxiety experienced during an exam. A "study habits" variable might be defined by the amount of studying that actually occurs as measured by time.
These precise descriptions are important because many things can be measured in various ways. Clearly defining these variables and how they are measured helps ensure that other researchers can replicate your results.
Replicability
One of the basic principles of any type of scientific research is that the results must be replicable.
Replication means repeating an experiment in the same way to produce the same results. By clearly detailing the specifics of how the variables were measured and manipulated, other researchers can better understand the results and repeat the study if needed.
Some variables are more difficult than others to define. For example, how would you operationally define a variable such as aggression ? For obvious ethical reasons, researchers cannot create a situation in which a person behaves aggressively toward others.
To measure this variable, the researcher must devise a measurement that assesses aggressive behavior without harming others. The researcher might utilize a simulated task to measure aggressiveness in this situation.
Hypothesis Checklist
- Does your hypothesis focus on something that you can actually test?
- Does your hypothesis include both an independent and dependent variable?
- Can you manipulate the variables?
- Can your hypothesis be tested without violating ethical standards?
The hypothesis you use will depend on what you are investigating and hoping to find. Some of the main types of hypotheses that you might use include:
- Simple hypothesis : This type of hypothesis suggests there is a relationship between one independent variable and one dependent variable.
- Complex hypothesis : This type suggests a relationship between three or more variables, such as two independent and dependent variables.
- Null hypothesis : This hypothesis suggests no relationship exists between two or more variables.
- Alternative hypothesis : This hypothesis states the opposite of the null hypothesis.
- Statistical hypothesis : This hypothesis uses statistical analysis to evaluate a representative population sample and then generalizes the findings to the larger group.
- Logical hypothesis : This hypothesis assumes a relationship between variables without collecting data or evidence.
A hypothesis often follows a basic format of "If {this happens} then {this will happen}." One way to structure your hypothesis is to describe what will happen to the dependent variable if you change the independent variable .
The basic format might be: "If {these changes are made to a certain independent variable}, then we will observe {a change in a specific dependent variable}."
A few examples of simple hypotheses:
- "Students who eat breakfast will perform better on a math exam than students who do not eat breakfast."
- "Students who experience test anxiety before an English exam will get lower scores than students who do not experience test anxiety."
- "Motorists who talk on the phone while driving will be more likely to make errors on a driving course than those who do not talk on the phone."
- "Children who receive a new reading intervention will have higher reading scores than students who do not receive the intervention."
Examples of a complex hypothesis include:
- "People with high-sugar diets and sedentary activity levels are more likely to develop depression."
- "Younger people who are regularly exposed to green, outdoor areas have better subjective well-being than older adults who have limited exposure to green spaces."
Examples of a null hypothesis include:
- "There is no difference in anxiety levels between people who take St. John's wort supplements and those who do not."
- "There is no difference in scores on a memory recall task between children and adults."
- "There is no difference in aggression levels between children who play first-person shooter games and those who do not."
Examples of an alternative hypothesis:
- "People who take St. John's wort supplements will have less anxiety than those who do not."
- "Adults will perform better on a memory task than children."
- "Children who play first-person shooter games will show higher levels of aggression than children who do not."
Collecting Data on Your Hypothesis
Once a researcher has formed a testable hypothesis, the next step is to select a research design and start collecting data. The research method depends largely on exactly what they are studying. There are two basic types of research methods: descriptive research and experimental research.
Descriptive Research Methods
Descriptive research such as case studies , naturalistic observations , and surveys are often used when conducting an experiment is difficult or impossible. These methods are best used to describe different aspects of a behavior or psychological phenomenon.
Once a researcher has collected data using descriptive methods, a correlational study can examine how the variables are related. This research method might be used to investigate a hypothesis that is difficult to test experimentally.
Experimental Research Methods
Experimental methods are used to demonstrate causal relationships between variables. In an experiment, the researcher systematically manipulates a variable of interest (known as the independent variable) and measures the effect on another variable (known as the dependent variable).
Unlike correlational studies, which can only be used to determine if there is a relationship between two variables, experimental methods can be used to determine the actual nature of the relationship—whether changes in one variable actually cause another to change.
The hypothesis is a critical part of any scientific exploration. It represents what researchers expect to find in a study or experiment. In situations where the hypothesis is unsupported by the research, the research still has value. Such research helps us better understand how different aspects of the natural world relate to one another. It also helps us develop new hypotheses that can then be tested in the future.
Thompson WH, Skau S. On the scope of scientific hypotheses . R Soc Open Sci . 2023;10(8):230607. doi:10.1098/rsos.230607
Taran S, Adhikari NKJ, Fan E. Falsifiability in medicine: what clinicians can learn from Karl Popper [published correction appears in Intensive Care Med. 2021 Jun 17;:]. Intensive Care Med . 2021;47(9):1054-1056. doi:10.1007/s00134-021-06432-z
Eyler AA. Research Methods for Public Health . 1st ed. Springer Publishing Company; 2020. doi:10.1891/9780826182067.0004
Nosek BA, Errington TM. What is replication ? PLoS Biol . 2020;18(3):e3000691. doi:10.1371/journal.pbio.3000691
Aggarwal R, Ranganathan P. Study designs: Part 2 - Descriptive studies . Perspect Clin Res . 2019;10(1):34-36. doi:10.4103/picr.PICR_154_18
Nevid J. Psychology: Concepts and Applications. Wadworth, 2013.
By Kendra Cherry, MSEd Kendra Cherry, MS, is a psychosocial rehabilitation specialist, psychology educator, and author of the "Everything Psychology Book."
- Privacy Policy
Home » What is a Hypothesis – Types, Examples and Writing Guide
What is a Hypothesis – Types, Examples and Writing Guide
Table of Contents

Definition:
Hypothesis is an educated guess or proposed explanation for a phenomenon, based on some initial observations or data. It is a tentative statement that can be tested and potentially proven or disproven through further investigation and experimentation.
Hypothesis is often used in scientific research to guide the design of experiments and the collection and analysis of data. It is an essential element of the scientific method, as it allows researchers to make predictions about the outcome of their experiments and to test those predictions to determine their accuracy.
Types of Hypothesis
Types of Hypothesis are as follows:
Research Hypothesis
A research hypothesis is a statement that predicts a relationship between variables. It is usually formulated as a specific statement that can be tested through research, and it is often used in scientific research to guide the design of experiments.
Null Hypothesis
The null hypothesis is a statement that assumes there is no significant difference or relationship between variables. It is often used as a starting point for testing the research hypothesis, and if the results of the study reject the null hypothesis, it suggests that there is a significant difference or relationship between variables.
Alternative Hypothesis
An alternative hypothesis is a statement that assumes there is a significant difference or relationship between variables. It is often used as an alternative to the null hypothesis and is tested against the null hypothesis to determine which statement is more accurate.
Directional Hypothesis
A directional hypothesis is a statement that predicts the direction of the relationship between variables. For example, a researcher might predict that increasing the amount of exercise will result in a decrease in body weight.
Non-directional Hypothesis
A non-directional hypothesis is a statement that predicts the relationship between variables but does not specify the direction. For example, a researcher might predict that there is a relationship between the amount of exercise and body weight, but they do not specify whether increasing or decreasing exercise will affect body weight.
Statistical Hypothesis
A statistical hypothesis is a statement that assumes a particular statistical model or distribution for the data. It is often used in statistical analysis to test the significance of a particular result.
Composite Hypothesis
A composite hypothesis is a statement that assumes more than one condition or outcome. It can be divided into several sub-hypotheses, each of which represents a different possible outcome.
Empirical Hypothesis
An empirical hypothesis is a statement that is based on observed phenomena or data. It is often used in scientific research to develop theories or models that explain the observed phenomena.
Simple Hypothesis
A simple hypothesis is a statement that assumes only one outcome or condition. It is often used in scientific research to test a single variable or factor.
Complex Hypothesis
A complex hypothesis is a statement that assumes multiple outcomes or conditions. It is often used in scientific research to test the effects of multiple variables or factors on a particular outcome.
Applications of Hypothesis
Hypotheses are used in various fields to guide research and make predictions about the outcomes of experiments or observations. Here are some examples of how hypotheses are applied in different fields:
- Science : In scientific research, hypotheses are used to test the validity of theories and models that explain natural phenomena. For example, a hypothesis might be formulated to test the effects of a particular variable on a natural system, such as the effects of climate change on an ecosystem.
- Medicine : In medical research, hypotheses are used to test the effectiveness of treatments and therapies for specific conditions. For example, a hypothesis might be formulated to test the effects of a new drug on a particular disease.
- Psychology : In psychology, hypotheses are used to test theories and models of human behavior and cognition. For example, a hypothesis might be formulated to test the effects of a particular stimulus on the brain or behavior.
- Sociology : In sociology, hypotheses are used to test theories and models of social phenomena, such as the effects of social structures or institutions on human behavior. For example, a hypothesis might be formulated to test the effects of income inequality on crime rates.
- Business : In business research, hypotheses are used to test the validity of theories and models that explain business phenomena, such as consumer behavior or market trends. For example, a hypothesis might be formulated to test the effects of a new marketing campaign on consumer buying behavior.
- Engineering : In engineering, hypotheses are used to test the effectiveness of new technologies or designs. For example, a hypothesis might be formulated to test the efficiency of a new solar panel design.
How to write a Hypothesis
Here are the steps to follow when writing a hypothesis:
Identify the Research Question
The first step is to identify the research question that you want to answer through your study. This question should be clear, specific, and focused. It should be something that can be investigated empirically and that has some relevance or significance in the field.
Conduct a Literature Review
Before writing your hypothesis, it’s essential to conduct a thorough literature review to understand what is already known about the topic. This will help you to identify the research gap and formulate a hypothesis that builds on existing knowledge.
Determine the Variables
The next step is to identify the variables involved in the research question. A variable is any characteristic or factor that can vary or change. There are two types of variables: independent and dependent. The independent variable is the one that is manipulated or changed by the researcher, while the dependent variable is the one that is measured or observed as a result of the independent variable.
Formulate the Hypothesis
Based on the research question and the variables involved, you can now formulate your hypothesis. A hypothesis should be a clear and concise statement that predicts the relationship between the variables. It should be testable through empirical research and based on existing theory or evidence.
Write the Null Hypothesis
The null hypothesis is the opposite of the alternative hypothesis, which is the hypothesis that you are testing. The null hypothesis states that there is no significant difference or relationship between the variables. It is important to write the null hypothesis because it allows you to compare your results with what would be expected by chance.
Refine the Hypothesis
After formulating the hypothesis, it’s important to refine it and make it more precise. This may involve clarifying the variables, specifying the direction of the relationship, or making the hypothesis more testable.
Examples of Hypothesis
Here are a few examples of hypotheses in different fields:
- Psychology : “Increased exposure to violent video games leads to increased aggressive behavior in adolescents.”
- Biology : “Higher levels of carbon dioxide in the atmosphere will lead to increased plant growth.”
- Sociology : “Individuals who grow up in households with higher socioeconomic status will have higher levels of education and income as adults.”
- Education : “Implementing a new teaching method will result in higher student achievement scores.”
- Marketing : “Customers who receive a personalized email will be more likely to make a purchase than those who receive a generic email.”
- Physics : “An increase in temperature will cause an increase in the volume of a gas, assuming all other variables remain constant.”
- Medicine : “Consuming a diet high in saturated fats will increase the risk of developing heart disease.”
Purpose of Hypothesis
The purpose of a hypothesis is to provide a testable explanation for an observed phenomenon or a prediction of a future outcome based on existing knowledge or theories. A hypothesis is an essential part of the scientific method and helps to guide the research process by providing a clear focus for investigation. It enables scientists to design experiments or studies to gather evidence and data that can support or refute the proposed explanation or prediction.
The formulation of a hypothesis is based on existing knowledge, observations, and theories, and it should be specific, testable, and falsifiable. A specific hypothesis helps to define the research question, which is important in the research process as it guides the selection of an appropriate research design and methodology. Testability of the hypothesis means that it can be proven or disproven through empirical data collection and analysis. Falsifiability means that the hypothesis should be formulated in such a way that it can be proven wrong if it is incorrect.
In addition to guiding the research process, the testing of hypotheses can lead to new discoveries and advancements in scientific knowledge. When a hypothesis is supported by the data, it can be used to develop new theories or models to explain the observed phenomenon. When a hypothesis is not supported by the data, it can help to refine existing theories or prompt the development of new hypotheses to explain the phenomenon.
When to use Hypothesis
Here are some common situations in which hypotheses are used:
- In scientific research , hypotheses are used to guide the design of experiments and to help researchers make predictions about the outcomes of those experiments.
- In social science research , hypotheses are used to test theories about human behavior, social relationships, and other phenomena.
- I n business , hypotheses can be used to guide decisions about marketing, product development, and other areas. For example, a hypothesis might be that a new product will sell well in a particular market, and this hypothesis can be tested through market research.
Characteristics of Hypothesis
Here are some common characteristics of a hypothesis:
- Testable : A hypothesis must be able to be tested through observation or experimentation. This means that it must be possible to collect data that will either support or refute the hypothesis.
- Falsifiable : A hypothesis must be able to be proven false if it is not supported by the data. If a hypothesis cannot be falsified, then it is not a scientific hypothesis.
- Clear and concise : A hypothesis should be stated in a clear and concise manner so that it can be easily understood and tested.
- Based on existing knowledge : A hypothesis should be based on existing knowledge and research in the field. It should not be based on personal beliefs or opinions.
- Specific : A hypothesis should be specific in terms of the variables being tested and the predicted outcome. This will help to ensure that the research is focused and well-designed.
- Tentative: A hypothesis is a tentative statement or assumption that requires further testing and evidence to be confirmed or refuted. It is not a final conclusion or assertion.
- Relevant : A hypothesis should be relevant to the research question or problem being studied. It should address a gap in knowledge or provide a new perspective on the issue.
Advantages of Hypothesis
Hypotheses have several advantages in scientific research and experimentation:
- Guides research: A hypothesis provides a clear and specific direction for research. It helps to focus the research question, select appropriate methods and variables, and interpret the results.
- Predictive powe r: A hypothesis makes predictions about the outcome of research, which can be tested through experimentation. This allows researchers to evaluate the validity of the hypothesis and make new discoveries.
- Facilitates communication: A hypothesis provides a common language and framework for scientists to communicate with one another about their research. This helps to facilitate the exchange of ideas and promotes collaboration.
- Efficient use of resources: A hypothesis helps researchers to use their time, resources, and funding efficiently by directing them towards specific research questions and methods that are most likely to yield results.
- Provides a basis for further research: A hypothesis that is supported by data provides a basis for further research and exploration. It can lead to new hypotheses, theories, and discoveries.
- Increases objectivity: A hypothesis can help to increase objectivity in research by providing a clear and specific framework for testing and interpreting results. This can reduce bias and increase the reliability of research findings.
Limitations of Hypothesis
Some Limitations of the Hypothesis are as follows:
- Limited to observable phenomena: Hypotheses are limited to observable phenomena and cannot account for unobservable or intangible factors. This means that some research questions may not be amenable to hypothesis testing.
- May be inaccurate or incomplete: Hypotheses are based on existing knowledge and research, which may be incomplete or inaccurate. This can lead to flawed hypotheses and erroneous conclusions.
- May be biased: Hypotheses may be biased by the researcher’s own beliefs, values, or assumptions. This can lead to selective interpretation of data and a lack of objectivity in research.
- Cannot prove causation: A hypothesis can only show a correlation between variables, but it cannot prove causation. This requires further experimentation and analysis.
- Limited to specific contexts: Hypotheses are limited to specific contexts and may not be generalizable to other situations or populations. This means that results may not be applicable in other contexts or may require further testing.
- May be affected by chance : Hypotheses may be affected by chance or random variation, which can obscure or distort the true relationship between variables.
About the author

Muhammad Hassan
Researcher, Academic Writer, Web developer
You may also like

Research Problem – Examples, Types and Guide

Appendix in Research Paper – Examples and...

Research Topics – Ideas and Examples

Research Techniques – Methods, Types and Examples

Thesis – Structure, Example and Writing Guide

Literature Review – Types Writing Guide and...
Have a language expert improve your writing
Run a free plagiarism check in 10 minutes, automatically generate references for free.
- Knowledge Base
- Methodology
- How to Write a Strong Hypothesis | Guide & Examples
How to Write a Strong Hypothesis | Guide & Examples
Published on 6 May 2022 by Shona McCombes .
A hypothesis is a statement that can be tested by scientific research. If you want to test a relationship between two or more variables, you need to write hypotheses before you start your experiment or data collection.
Table of contents
What is a hypothesis, developing a hypothesis (with example), hypothesis examples, frequently asked questions about writing hypotheses.
A hypothesis states your predictions about what your research will find. It is a tentative answer to your research question that has not yet been tested. For some research projects, you might have to write several hypotheses that address different aspects of your research question.
A hypothesis is not just a guess – it should be based on existing theories and knowledge. It also has to be testable, which means you can support or refute it through scientific research methods (such as experiments, observations, and statistical analysis of data).
Variables in hypotheses
Hypotheses propose a relationship between two or more variables . An independent variable is something the researcher changes or controls. A dependent variable is something the researcher observes and measures.
In this example, the independent variable is exposure to the sun – the assumed cause . The dependent variable is the level of happiness – the assumed effect .
Prevent plagiarism, run a free check.
Step 1: ask a question.
Writing a hypothesis begins with a research question that you want to answer. The question should be focused, specific, and researchable within the constraints of your project.
Step 2: Do some preliminary research
Your initial answer to the question should be based on what is already known about the topic. Look for theories and previous studies to help you form educated assumptions about what your research will find.
At this stage, you might construct a conceptual framework to identify which variables you will study and what you think the relationships are between them. Sometimes, you’ll have to operationalise more complex constructs.
Step 3: Formulate your hypothesis
Now you should have some idea of what you expect to find. Write your initial answer to the question in a clear, concise sentence.
Step 4: Refine your hypothesis
You need to make sure your hypothesis is specific and testable. There are various ways of phrasing a hypothesis, but all the terms you use should have clear definitions, and the hypothesis should contain:
- The relevant variables
- The specific group being studied
- The predicted outcome of the experiment or analysis
Step 5: Phrase your hypothesis in three ways
To identify the variables, you can write a simple prediction in if … then form. The first part of the sentence states the independent variable and the second part states the dependent variable.
In academic research, hypotheses are more commonly phrased in terms of correlations or effects, where you directly state the predicted relationship between variables.
If you are comparing two groups, the hypothesis can state what difference you expect to find between them.
Step 6. Write a null hypothesis
If your research involves statistical hypothesis testing , you will also have to write a null hypothesis. The null hypothesis is the default position that there is no association between the variables. The null hypothesis is written as H 0 , while the alternative hypothesis is H 1 or H a .
| Research question | Hypothesis | Null hypothesis |
|---|---|---|
| What are the health benefits of eating an apple a day? | Increasing apple consumption in over-60s will result in decreasing frequency of doctor’s visits. | Increasing apple consumption in over-60s will have no effect on frequency of doctor’s visits. |
| Which airlines have the most delays? | Low-cost airlines are more likely to have delays than premium airlines. | Low-cost and premium airlines are equally likely to have delays. |
| Can flexible work arrangements improve job satisfaction? | Employees who have flexible working hours will report greater job satisfaction than employees who work fixed hours. | There is no relationship between working hour flexibility and job satisfaction. |
| How effective is secondary school sex education at reducing teen pregnancies? | Teenagers who received sex education lessons throughout secondary school will have lower rates of unplanned pregnancy than teenagers who did not receive any sex education. | Secondary school sex education has no effect on teen pregnancy rates. |
| What effect does daily use of social media have on the attention span of under-16s? | There is a negative correlation between time spent on social media and attention span in under-16s. | There is no relationship between social media use and attention span in under-16s. |
Hypothesis testing is a formal procedure for investigating our ideas about the world using statistics. It is used by scientists to test specific predictions, called hypotheses , by calculating how likely it is that a pattern or relationship between variables could have arisen by chance.
A hypothesis is not just a guess. It should be based on existing theories and knowledge. It also has to be testable, which means you can support or refute it through scientific research methods (such as experiments, observations, and statistical analysis of data).
A research hypothesis is your proposed answer to your research question. The research hypothesis usually includes an explanation (‘ x affects y because …’).
A statistical hypothesis, on the other hand, is a mathematical statement about a population parameter. Statistical hypotheses always come in pairs: the null and alternative hypotheses. In a well-designed study , the statistical hypotheses correspond logically to the research hypothesis.
Cite this Scribbr article
If you want to cite this source, you can copy and paste the citation or click the ‘Cite this Scribbr article’ button to automatically add the citation to our free Reference Generator.
McCombes, S. (2022, May 06). How to Write a Strong Hypothesis | Guide & Examples. Scribbr. Retrieved 7 June 2024, from https://www.scribbr.co.uk/research-methods/hypothesis-writing/
Is this article helpful?

Shona McCombes
Other students also liked, operationalisation | a guide with examples, pros & cons, what is a conceptual framework | tips & examples, a quick guide to experimental design | 5 steps & examples.
The Research Hypothesis: Role and Construction
- First Online: 01 January 2012
Cite this chapter

- Phyllis G. Supino EdD 3
6034 Accesses
A hypothesis is a logical construct, interposed between a problem and its solution, which represents a proposed answer to a research question. It gives direction to the investigator’s thinking about the problem and, therefore, facilitates a solution. There are three primary modes of inference by which hypotheses are developed: deduction (reasoning from a general propositions to specific instances), induction (reasoning from specific instances to a general proposition), and abduction (formulation/acceptance on probation of a hypothesis to explain a surprising observation).
A research hypothesis should reflect an inference about variables; be stated as a grammatically complete, declarative sentence; be expressed simply and unambiguously; provide an adequate answer to the research problem; and be testable. Hypotheses can be classified as conceptual versus operational, single versus bi- or multivariable, causal or not causal, mechanistic versus nonmechanistic, and null or alternative. Hypotheses most commonly entail statements about “variables” which, in turn, can be classified according to their level of measurement (scaling characteristics) or according to their role in the hypothesis (independent, dependent, moderator, control, or intervening).
A hypothesis is rendered operational when its broadly (conceptually) stated variables are replaced by operational definitions of those variables. Hypotheses stated in this manner are called operational hypotheses, specific hypotheses, or predictions and facilitate testing.
Wrong hypotheses, rightly worked from, have produced more results than unguided observation
—Augustus De Morgan, 1872[ 1 ]—
This is a preview of subscription content, log in via an institution to check access.
Access this chapter
- Available as PDF
- Read on any device
- Instant download
- Own it forever
- Available as EPUB and PDF
- Compact, lightweight edition
- Dispatched in 3 to 5 business days
- Free shipping worldwide - see info
- Durable hardcover edition
Tax calculation will be finalised at checkout
Purchases are for personal use only
Institutional subscriptions
The Nature and Logic of Science: Testing Hypotheses

Abductive Research Methods in Psychological Science

Abductive Research Methods in Psychological Science
De Morgan A, De Morgan S. A budget of paradoxes. London: Longmans Green; 1872.
Google Scholar
Leedy Paul D. Practical research. Planning and design. 2nd ed. New York: Macmillan; 1960.
Bernard C. Introduction to the study of experimental medicine. New York: Dover; 1957.
Erren TC. The quest for questions—on the logical force of science. Med Hypotheses. 2004;62:635–40.
Article PubMed Google Scholar
Peirce CS. Collected papers of Charles Sanders Peirce, vol. 7. In: Hartshorne C, Weiss P, editors. Boston: The Belknap Press of Harvard University Press; 1966.
Aristotle. The complete works of Aristotle: the revised Oxford Translation. In: Barnes J, editor. vol. 2. Princeton/New Jersey: Princeton University Press; 1984.
Polit D, Beck CT. Conceptualizing a study to generate evidence for nursing. In: Polit D, Beck CT, editors. Nursing research: generating and assessing evidence for nursing practice. 8th ed. Philadelphia: Wolters Kluwer/Lippincott Williams and Wilkins; 2008. Chapter 4.
Jenicek M, Hitchcock DL. Evidence-based practice. Logic and critical thinking in medicine. Chicago: AMA Press; 2005.
Bacon F. The novum organon or a true guide to the interpretation of nature. A new translation by the Rev G.W. Kitchin. Oxford: The University Press; 1855.
Popper KR. Objective knowledge: an evolutionary approach (revised edition). New York: Oxford University Press; 1979.
Morgan AJ, Parker S. Translational mini-review series on vaccines: the Edward Jenner Museum and the history of vaccination. Clin Exp Immunol. 2007;147:389–94.
Article PubMed CAS Google Scholar
Pead PJ. Benjamin Jesty: new light in the dawn of vaccination. Lancet. 2003;362:2104–9.
Lee JA. The scientific endeavor: a primer on scientific principles and practice. San Francisco: Addison-Wesley Longman; 2000.
Allchin D. Lawson’s shoehorn, or should the philosophy of science be rated, ‘X’? Science and Education. 2003;12:315–29.
Article Google Scholar
Lawson AE. What is the role of induction and deduction in reasoning and scientific inquiry? J Res Sci Teach. 2005;42:716–40.
Peirce CS. Collected papers of Charles Sanders Peirce, vol. 2. In: Hartshorne C, Weiss P, editors. Boston: The Belknap Press of Harvard University Press; 1965.
Bonfantini MA, Proni G. To guess or not to guess? In: Eco U, Sebeok T, editors. The sign of three: Dupin, Holmes, Peirce. Bloomington: Indiana University Press; 1983. Chapter 5.
Peirce CS. Collected papers of Charles Sanders Peirce, vol. 5. In: Hartshorne C, Weiss P, editors. Boston: The Belknap Press of Harvard University Press; 1965.
Flach PA, Kakas AC. Abductive and inductive reasoning: background issues. In: Flach PA, Kakas AC, editors. Abduction and induction. Essays on their relation and integration. The Netherlands: Klewer; 2000. Chapter 1.
Murray JF. Voltaire, Walpole and Pasteur: variations on the theme of discovery. Am J Respir Crit Care Med. 2005;172:423–6.
Danemark B, Ekstrom M, Jakobsen L, Karlsson JC. Methodological implications, generalization, scientific inference, models (Part II) In: explaining society. Critical realism in the social sciences. New York: Routledge; 2002.
Pasteur L. Inaugural lecture as professor and dean of the faculty of sciences. In: Peterson H, editor. A treasury of the world’s greatest speeches. Douai, France: University of Lille 7 Dec 1954.
Swineburne R. Simplicity as evidence for truth. Milwaukee: Marquette University Press; 1997.
Sakar S, editor. Logical empiricism at its peak: Schlick, Carnap and Neurath. New York: Garland; 1996.
Popper K. The logic of scientific discovery. New York: Basic Books; 1959. 1934, trans. 1959.
Caws P. The philosophy of science. Princeton: D. Van Nostrand Company; 1965.
Popper K. Conjectures and refutations. The growth of scientific knowledge. 4th ed. London: Routledge and Keegan Paul; 1972.
Feyerabend PK. Against method, outline of an anarchistic theory of knowledge. London, UK: Verso; 1978.
Smith PG. Popper: conjectures and refutations (Chapter IV). In: Theory and reality: an introduction to the philosophy of science. Chicago: University of Chicago Press; 2003.
Blystone RV, Blodgett K. WWW: the scientific method. CBE Life Sci Educ. 2006;5:7–11.
Kleinbaum DG, Kupper LL, Morgenstern H. Epidemiological research. Principles and quantitative methods. New York: Van Nostrand Reinhold; 1982.
Fortune AE, Reid WJ. Research in social work. 3rd ed. New York: Columbia University Press; 1999.
Kerlinger FN. Foundations of behavioral research. 1st ed. New York: Hold, Reinhart and Winston; 1970.
Hoskins CN, Mariano C. Research in nursing and health. Understanding and using quantitative and qualitative methods. New York: Springer; 2004.
Tuckman BW. Conducting educational research. New York: Harcourt, Brace, Jovanovich; 1972.
Wang C, Chiari PC, Weihrauch D, Krolikowski JG, Warltier DC, Kersten JR, Pratt Jr PF, Pagel PS. Gender-specificity of delayed preconditioning by isoflurane in rabbits: potential role of endothelial nitric oxide synthase. Anesth Analg. 2006;103:274–80.
Beyer ME, Slesak G, Nerz S, Kazmaier S, Hoffmeister HM. Effects of endothelin-1 and IRL 1620 on myocardial contractility and myocardial energy metabolism. J Cardiovasc Pharmacol. 1995;26(Suppl 3):S150–2.
PubMed CAS Google Scholar
Stone J, Sharpe M. Amnesia for childhood in patients with unexplained neurological symptoms. J Neurol Neurosurg Psychiatry. 2002;72:416–7.
Naughton BJ, Moran M, Ghaly Y, Michalakes C. Computer tomography scanning and delirium in elder patients. Acad Emerg Med. 1997;4:1107–10.
Easterbrook PJ, Berlin JA, Gopalan R, Matthews DR. Publication bias in clinical research. Lancet. 1991;337:867–72.
Stern JM, Simes RJ. Publication bias: evidence of delayed publication in a cohort study of clinical research projects. BMJ. 1997;315:640–5.
Stevens SS. On the theory of scales and measurement. Science. 1946;103:677–80.
Knapp TR. Treating ordinal scales as interval scales: an attempt to resolve the controversy. Nurs Res. 1990;39:121–3.
The Cochrane Collaboration. Open Learning Material. www.cochrane-net.org/openlearning/html/mod14-3.htm . Accessed 12 Oct 2009.
MacCorquodale K, Meehl PE. On a distinction between hypothetical constructs and intervening variables. Psychol Rev. 1948;55:95–107.
Baron RM, Kenny DA. The moderator-mediator variable distinction in social psychological research: conceptual, strategic and statistical considerations. J Pers Soc Psychol. 1986;51:1173–82.
Williamson GM, Schultz R. Activity restriction mediates the association between pain and depressed affect: a study of younger and older adult cancer patients. Psychol Aging. 1995;10:369–78.
Song M, Lee EO. Development of a functional capacity model for the elderly. Res Nurs Health. 1998;21:189–98.
MacKinnon DP. Introduction to statistical mediation analysis. New York: Routledge; 2008.
Download references
Author information
Authors and affiliations.
Department of Medicine, College of Medicine, SUNY Downstate Medical Center, 450 Clarkson Avenue, 1199, Brooklyn, NY, 11203, USA
Phyllis G. Supino EdD
You can also search for this author in PubMed Google Scholar
Corresponding author
Correspondence to Phyllis G. Supino EdD .
Editor information
Editors and affiliations.
, Cardiovascular Medicine, SUNY Downstate Medical Center, Clarkson Avenue, box 1199 450, Brooklyn, 11203, USA
Phyllis G. Supino
, Cardiovascualr Medicine, SUNY Downstate Medical Center, Clarkson Avenue 450, Brooklyn, 11203, USA
Jeffrey S. Borer
Rights and permissions
Reprints and permissions
Copyright information
© 2012 Springer Science+Business Media, LLC
About this chapter
Supino, P.G. (2012). The Research Hypothesis: Role and Construction. In: Supino, P., Borer, J. (eds) Principles of Research Methodology. Springer, New York, NY. https://doi.org/10.1007/978-1-4614-3360-6_3
Download citation
DOI : https://doi.org/10.1007/978-1-4614-3360-6_3
Published : 18 April 2012
Publisher Name : Springer, New York, NY
Print ISBN : 978-1-4614-3359-0
Online ISBN : 978-1-4614-3360-6
eBook Packages : Medicine Medicine (R0)
Share this chapter
Anyone you share the following link with will be able to read this content:
Sorry, a shareable link is not currently available for this article.
Provided by the Springer Nature SharedIt content-sharing initiative
- Publish with us
Policies and ethics
- Find a journal
- Track your research
How to Write a Research Hypothesis
- Research Process
- Peer Review
Since grade school, we've all been familiar with hypotheses. The hypothesis is an essential step of the scientific method. But what makes an effective research hypothesis, how do you create one, and what types of hypotheses are there? We answer these questions and more.
Updated on April 27, 2022

What is a research hypothesis?
General hypothesis.
Since grade school, we've all been familiar with the term “hypothesis.” A hypothesis is a fact-based guess or prediction that has not been proven. It is an essential step of the scientific method. The hypothesis of a study is a drive for experimentation to either prove the hypothesis or dispute it.
Research Hypothesis
A research hypothesis is more specific than a general hypothesis. It is an educated, expected prediction of the outcome of a study that is testable.
What makes an effective research hypothesis?
A good research hypothesis is a clear statement of the relationship between a dependent variable(s) and independent variable(s) relevant to the study that can be disproven.
Research hypothesis checklist
Once you've written a possible hypothesis, make sure it checks the following boxes:
- It must be testable: You need a means to prove your hypothesis. If you can't test it, it's not a hypothesis.
- It must include a dependent and independent variable: At least one independent variable ( cause ) and one dependent variable ( effect ) must be included.
- The language must be easy to understand: Be as clear and concise as possible. Nothing should be left to interpretation.
- It must be relevant to your research topic: You probably shouldn't be talking about cats and dogs if your research topic is outer space. Stay relevant to your topic.
How to create an effective research hypothesis
Pose it as a question first.
Start your research hypothesis from a journalistic approach. Ask one of the five W's: Who, what, when, where, or why.
A possible initial question could be: Why is the sky blue?
Do the preliminary research
Once you have a question in mind, read research around your topic. Collect research from academic journals.
If you're looking for information about the sky and why it is blue, research information about the atmosphere, weather, space, the sun, etc.
Write a draft hypothesis
Once you're comfortable with your subject and have preliminary knowledge, create a working hypothesis. Don't stress much over this. Your first hypothesis is not permanent. Look at it as a draft.
Your first draft of a hypothesis could be: Certain molecules in the Earth's atmosphere are responsive to the sky being the color blue.
Make your working draft perfect
Take your working hypothesis and make it perfect. Narrow it down to include only the information listed in the “Research hypothesis checklist” above.
Now that you've written your working hypothesis, narrow it down. Your new hypothesis could be: Light from the sun hitting oxygen molecules in the sky makes the color of the sky appear blue.
Write a null hypothesis
Your null hypothesis should be the opposite of your research hypothesis. It should be able to be disproven by your research.
In this example, your null hypothesis would be: Light from the sun hitting oxygen molecules in the sky does not make the color of the sky appear blue.
Why is it important to have a clear, testable hypothesis?
One of the main reasons a manuscript can be rejected from a journal is because of a weak hypothesis. “Poor hypothesis, study design, methodology, and improper use of statistics are other reasons for rejection of a manuscript,” says Dr. Ish Kumar Dhammi and Dr. Rehan-Ul-Haq in Indian Journal of Orthopaedics.
According to Dr. James M. Provenzale in American Journal of Roentgenology , “The clear declaration of a research question (or hypothesis) in the Introduction is critical for reviewers to understand the intent of the research study. It is best to clearly state the study goal in plain language (for example, “We set out to determine whether condition x produces condition y.”) An insufficient problem statement is one of the more common reasons for manuscript rejection.”
Characteristics that make a hypothesis weak include:
- Unclear variables
- Unoriginality
- Too general
- Too specific
A weak hypothesis leads to weak research and methods . The goal of a paper is to prove or disprove a hypothesis - or to prove or disprove a null hypothesis. If the hypothesis is not a dependent variable of what is being studied, the paper's methods should come into question.
A strong hypothesis is essential to the scientific method. A hypothesis states an assumed relationship between at least two variables and the experiment then proves or disproves that relationship with statistical significance. Without a proven and reproducible relationship, the paper feeds into the reproducibility crisis. Learn more about writing for reproducibility .
In a study published in The Journal of Obstetrics and Gynecology of India by Dr. Suvarna Satish Khadilkar, she reviewed 400 rejected manuscripts to see why they were rejected. Her studies revealed that poor methodology was a top reason for the submission having a final disposition of rejection.
Aside from publication chances, Dr. Gareth Dyke believes a clear hypothesis helps efficiency.
“Developing a clear and testable hypothesis for your research project means that you will not waste time, energy, and money with your work,” said Dyke. “Refining a hypothesis that is both meaningful, interesting, attainable, and testable is the goal of all effective research.”
Types of research hypotheses
There can be overlap in these types of hypotheses.
Simple hypothesis
A simple hypothesis is a hypothesis at its most basic form. It shows the relationship of one independent and one independent variable.
Example: Drinking soda (independent variable) every day leads to obesity (dependent variable).
Complex hypothesis
A complex hypothesis shows the relationship of two or more independent and dependent variables.
Example: Drinking soda (independent variable) every day leads to obesity (dependent variable) and heart disease (dependent variable).
Directional hypothesis
A directional hypothesis guesses which way the results of an experiment will go. It uses words like increase, decrease, higher, lower, positive, negative, more, or less. It is also frequently used in statistics.
Example: Humans exposed to radiation have a higher risk of cancer than humans not exposed to radiation.
Non-directional hypothesis
A non-directional hypothesis says there will be an effect on the dependent variable, but it does not say which direction.
Associative hypothesis
An associative hypothesis says that when one variable changes, so does the other variable.
Alternative hypothesis
An alternative hypothesis states that the variables have a relationship.
- The opposite of a null hypothesis
Example: An apple a day keeps the doctor away.
Null hypothesis
A null hypothesis states that there is no relationship between the two variables. It is posed as the opposite of what the alternative hypothesis states.
Researchers use a null hypothesis to work to be able to reject it. A null hypothesis:
- Can never be proven
- Can only be rejected
- Is the opposite of an alternative hypothesis
Example: An apple a day does not keep the doctor away.
Logical hypothesis
A logical hypothesis is a suggested explanation while using limited evidence.
Example: Bats can navigate in the dark better than tigers.
In this hypothesis, the researcher knows that tigers cannot see in the dark, and bats mostly live in darkness.
Empirical hypothesis
An empirical hypothesis is also called a “working hypothesis.” It uses the trial and error method and changes around the independent variables.
- An apple a day keeps the doctor away.
- Two apples a day keep the doctor away.
- Three apples a day keep the doctor away.
In this case, the research changes the hypothesis as the researcher learns more about his/her research.
Statistical hypothesis
A statistical hypothesis is a look of a part of a population or statistical model. This type of hypothesis is especially useful if you are making a statement about a large population. Instead of having to test the entire population of Illinois, you could just use a smaller sample of people who live there.
Example: 70% of people who live in Illinois are iron deficient.
Causal hypothesis
A causal hypothesis states that the independent variable will have an effect on the dependent variable.
Example: Using tobacco products causes cancer.
Final thoughts
Make sure your research is error-free before you send it to your preferred journal . Check our our English Editing services to avoid your chances of desk rejection.

Jonny Rhein, BA
See our "Privacy Policy"
Ohio State nav bar
The Ohio State University
- BuckeyeLink
- Find People
- Search Ohio State
Research Questions & Hypotheses
Generally, in quantitative studies, reviewers expect hypotheses rather than research questions. However, both research questions and hypotheses serve different purposes and can be beneficial when used together.
Research Questions
Clarify the research’s aim (farrugia et al., 2010).
- Research often begins with an interest in a topic, but a deep understanding of the subject is crucial to formulate an appropriate research question.
- Descriptive: “What factors most influence the academic achievement of senior high school students?”
- Comparative: “What is the performance difference between teaching methods A and B?”
- Relationship-based: “What is the relationship between self-efficacy and academic achievement?”
- Increasing knowledge about a subject can be achieved through systematic literature reviews, in-depth interviews with patients (and proxies), focus groups, and consultations with field experts.
- Some funding bodies, like the Canadian Institute for Health Research, recommend conducting a systematic review or a pilot study before seeking grants for full trials.
- The presence of multiple research questions in a study can complicate the design, statistical analysis, and feasibility.
- It’s advisable to focus on a single primary research question for the study.
- The primary question, clearly stated at the end of a grant proposal’s introduction, usually specifies the study population, intervention, and other relevant factors.
- The FINER criteria underscore aspects that can enhance the chances of a successful research project, including specifying the population of interest, aligning with scientific and public interest, clinical relevance, and contribution to the field, while complying with ethical and national research standards.
| Feasible | ||
| Interesting | ||
| Novel | ||
| Ethical | ||
| Relevant |
- The P ICOT approach is crucial in developing the study’s framework and protocol, influencing inclusion and exclusion criteria and identifying patient groups for inclusion.
| Population (patients) | ||
| Intervention (for intervention studies only) | ||
| Comparison group | ||
| Outcome of interest | ||
| Time |
- Defining the specific population, intervention, comparator, and outcome helps in selecting the right outcome measurement tool.
- The more precise the population definition and stricter the inclusion and exclusion criteria, the more significant the impact on the interpretation, applicability, and generalizability of the research findings.
- A restricted study population enhances internal validity but may limit the study’s external validity and generalizability to clinical practice.
- A broadly defined study population may better reflect clinical practice but could increase bias and reduce internal validity.
- An inadequately formulated research question can negatively impact study design, potentially leading to ineffective outcomes and affecting publication prospects.
Checklist: Good research questions for social science projects (Panke, 2018)

Research Hypotheses
Present the researcher’s predictions based on specific statements.
- These statements define the research problem or issue and indicate the direction of the researcher’s predictions.
- Formulating the research question and hypothesis from existing data (e.g., a database) can lead to multiple statistical comparisons and potentially spurious findings due to chance.
- The research or clinical hypothesis, derived from the research question, shapes the study’s key elements: sampling strategy, intervention, comparison, and outcome variables.
- Hypotheses can express a single outcome or multiple outcomes.
- After statistical testing, the null hypothesis is either rejected or not rejected based on whether the study’s findings are statistically significant.
- Hypothesis testing helps determine if observed findings are due to true differences and not chance.
- Hypotheses can be 1-sided (specific direction of difference) or 2-sided (presence of a difference without specifying direction).
- 2-sided hypotheses are generally preferred unless there’s a strong justification for a 1-sided hypothesis.
- A solid research hypothesis, informed by a good research question, influences the research design and paves the way for defining clear research objectives.
Types of Research Hypothesis
- In a Y-centered research design, the focus is on the dependent variable (DV) which is specified in the research question. Theories are then used to identify independent variables (IV) and explain their causal relationship with the DV.
- Example: “An increase in teacher-led instructional time (IV) is likely to improve student reading comprehension scores (DV), because extensive guided practice under expert supervision enhances learning retention and skill mastery.”
- Hypothesis Explanation: The dependent variable (student reading comprehension scores) is the focus, and the hypothesis explores how changes in the independent variable (teacher-led instructional time) affect it.
- In X-centered research designs, the independent variable is specified in the research question. Theories are used to determine potential dependent variables and the causal mechanisms at play.
- Example: “Implementing technology-based learning tools (IV) is likely to enhance student engagement in the classroom (DV), because interactive and multimedia content increases student interest and participation.”
- Hypothesis Explanation: The independent variable (technology-based learning tools) is the focus, with the hypothesis exploring its impact on a potential dependent variable (student engagement).
- Probabilistic hypotheses suggest that changes in the independent variable are likely to lead to changes in the dependent variable in a predictable manner, but not with absolute certainty.
- Example: “The more teachers engage in professional development programs (IV), the more their teaching effectiveness (DV) is likely to improve, because continuous training updates pedagogical skills and knowledge.”
- Hypothesis Explanation: This hypothesis implies a probable relationship between the extent of professional development (IV) and teaching effectiveness (DV).
- Deterministic hypotheses state that a specific change in the independent variable will lead to a specific change in the dependent variable, implying a more direct and certain relationship.
- Example: “If the school curriculum changes from traditional lecture-based methods to project-based learning (IV), then student collaboration skills (DV) are expected to improve because project-based learning inherently requires teamwork and peer interaction.”
- Hypothesis Explanation: This hypothesis presumes a direct and definite outcome (improvement in collaboration skills) resulting from a specific change in the teaching method.
- Example : “Students who identify as visual learners will score higher on tests that are presented in a visually rich format compared to tests presented in a text-only format.”
- Explanation : This hypothesis aims to describe the potential difference in test scores between visual learners taking visually rich tests and text-only tests, without implying a direct cause-and-effect relationship.
- Example : “Teaching method A will improve student performance more than method B.”
- Explanation : This hypothesis compares the effectiveness of two different teaching methods, suggesting that one will lead to better student performance than the other. It implies a direct comparison but does not necessarily establish a causal mechanism.
- Example : “Students with higher self-efficacy will show higher levels of academic achievement.”
- Explanation : This hypothesis predicts a relationship between the variable of self-efficacy and academic achievement. Unlike a causal hypothesis, it does not necessarily suggest that one variable causes changes in the other, but rather that they are related in some way.
Tips for developing research questions and hypotheses for research studies
- Perform a systematic literature review (if one has not been done) to increase knowledge and familiarity with the topic and to assist with research development.
- Learn about current trends and technological advances on the topic.
- Seek careful input from experts, mentors, colleagues, and collaborators to refine your research question as this will aid in developing the research question and guide the research study.
- Use the FINER criteria in the development of the research question.
- Ensure that the research question follows PICOT format.
- Develop a research hypothesis from the research question.
- Ensure that the research question and objectives are answerable, feasible, and clinically relevant.
If your research hypotheses are derived from your research questions, particularly when multiple hypotheses address a single question, it’s recommended to use both research questions and hypotheses. However, if this isn’t the case, using hypotheses over research questions is advised. It’s important to note these are general guidelines, not strict rules. If you opt not to use hypotheses, consult with your supervisor for the best approach.
Farrugia, P., Petrisor, B. A., Farrokhyar, F., & Bhandari, M. (2010). Practical tips for surgical research: Research questions, hypotheses and objectives. Canadian journal of surgery. Journal canadien de chirurgie , 53 (4), 278–281.
Hulley, S. B., Cummings, S. R., Browner, W. S., Grady, D., & Newman, T. B. (2007). Designing clinical research. Philadelphia.
Panke, D. (2018). Research design & method selection: Making good choices in the social sciences. Research Design & Method Selection , 1-368.

- Manuscript Preparation
What is and How to Write a Good Hypothesis in Research?
- 4 minute read
- 324.2K views
Table of Contents
One of the most important aspects of conducting research is constructing a strong hypothesis. But what makes a hypothesis in research effective? In this article, we’ll look at the difference between a hypothesis and a research question, as well as the elements of a good hypothesis in research. We’ll also include some examples of effective hypotheses, and what pitfalls to avoid.
What is a Hypothesis in Research?
Simply put, a hypothesis is a research question that also includes the predicted or expected result of the research. Without a hypothesis, there can be no basis for a scientific or research experiment. As such, it is critical that you carefully construct your hypothesis by being deliberate and thorough, even before you set pen to paper. Unless your hypothesis is clearly and carefully constructed, any flaw can have an adverse, and even grave, effect on the quality of your experiment and its subsequent results.
Research Question vs Hypothesis
It’s easy to confuse research questions with hypotheses, and vice versa. While they’re both critical to the Scientific Method, they have very specific differences. Primarily, a research question, just like a hypothesis, is focused and concise. But a hypothesis includes a prediction based on the proposed research, and is designed to forecast the relationship of and between two (or more) variables. Research questions are open-ended, and invite debate and discussion, while hypotheses are closed, e.g. “The relationship between A and B will be C.”
A hypothesis is generally used if your research topic is fairly well established, and you are relatively certain about the relationship between the variables that will be presented in your research. Since a hypothesis is ideally suited for experimental studies, it will, by its very existence, affect the design of your experiment. The research question is typically used for new topics that have not yet been researched extensively. Here, the relationship between different variables is less known. There is no prediction made, but there may be variables explored. The research question can be casual in nature, simply trying to understand if a relationship even exists, descriptive or comparative.
How to Write Hypothesis in Research
Writing an effective hypothesis starts before you even begin to type. Like any task, preparation is key, so you start first by conducting research yourself, and reading all you can about the topic that you plan to research. From there, you’ll gain the knowledge you need to understand where your focus within the topic will lie.
Remember that a hypothesis is a prediction of the relationship that exists between two or more variables. Your job is to write a hypothesis, and design the research, to “prove” whether or not your prediction is correct. A common pitfall is to use judgments that are subjective and inappropriate for the construction of a hypothesis. It’s important to keep the focus and language of your hypothesis objective.
An effective hypothesis in research is clearly and concisely written, and any terms or definitions clarified and defined. Specific language must also be used to avoid any generalities or assumptions.
Use the following points as a checklist to evaluate the effectiveness of your research hypothesis:
- Predicts the relationship and outcome
- Simple and concise – avoid wordiness
- Clear with no ambiguity or assumptions about the readers’ knowledge
- Observable and testable results
- Relevant and specific to the research question or problem
Research Hypothesis Example
Perhaps the best way to evaluate whether or not your hypothesis is effective is to compare it to those of your colleagues in the field. There is no need to reinvent the wheel when it comes to writing a powerful research hypothesis. As you’re reading and preparing your hypothesis, you’ll also read other hypotheses. These can help guide you on what works, and what doesn’t, when it comes to writing a strong research hypothesis.
Here are a few generic examples to get you started.
Eating an apple each day, after the age of 60, will result in a reduction of frequency of physician visits.
Budget airlines are more likely to receive more customer complaints. A budget airline is defined as an airline that offers lower fares and fewer amenities than a traditional full-service airline. (Note that the term “budget airline” is included in the hypothesis.
Workplaces that offer flexible working hours report higher levels of employee job satisfaction than workplaces with fixed hours.
Each of the above examples are specific, observable and measurable, and the statement of prediction can be verified or shown to be false by utilizing standard experimental practices. It should be noted, however, that often your hypothesis will change as your research progresses.
Language Editing Plus
Elsevier’s Language Editing Plus service can help ensure that your research hypothesis is well-designed, and articulates your research and conclusions. Our most comprehensive editing package, you can count on a thorough language review by native-English speakers who are PhDs or PhD candidates. We’ll check for effective logic and flow of your manuscript, as well as document formatting for your chosen journal, reference checks, and much more.

- Research Process
Systematic Literature Review or Literature Review?

What is a Problem Statement? [with examples]
You may also like.

Page-Turner Articles are More Than Just Good Arguments: Be Mindful of Tone and Structure!

A Must-see for Researchers! How to Ensure Inclusivity in Your Scientific Writing

Make Hook, Line, and Sinker: The Art of Crafting Engaging Introductions

Can Describing Study Limitations Improve the Quality of Your Paper?

A Guide to Crafting Shorter, Impactful Sentences in Academic Writing

6 Steps to Write an Excellent Discussion in Your Manuscript

How to Write Clear and Crisp Civil Engineering Papers? Here are 5 Key Tips to Consider

The Clear Path to An Impactful Paper: ②
Input your search keywords and press Enter.

An official website of the United States government
The .gov means it’s official. Federal government websites often end in .gov or .mil. Before sharing sensitive information, make sure you’re on a federal government site.
The site is secure. The https:// ensures that you are connecting to the official website and that any information you provide is encrypted and transmitted securely.
- Publications
- Account settings
Preview improvements coming to the PMC website in October 2024. Learn More or Try it out now .
- Advanced Search
- Journal List
- v.53(4); 2010 Aug
Research questions, hypotheses and objectives
Patricia farrugia.
* Michael G. DeGroote School of Medicine, the
Bradley A. Petrisor
† Division of Orthopaedic Surgery and the
Forough Farrokhyar
‡ Departments of Surgery and
§ Clinical Epidemiology and Biostatistics, McMaster University, Hamilton, Ont
Mohit Bhandari
There is an increasing familiarity with the principles of evidence-based medicine in the surgical community. As surgeons become more aware of the hierarchy of evidence, grades of recommendations and the principles of critical appraisal, they develop an increasing familiarity with research design. Surgeons and clinicians are looking more and more to the literature and clinical trials to guide their practice; as such, it is becoming a responsibility of the clinical research community to attempt to answer questions that are not only well thought out but also clinically relevant. The development of the research question, including a supportive hypothesis and objectives, is a necessary key step in producing clinically relevant results to be used in evidence-based practice. A well-defined and specific research question is more likely to help guide us in making decisions about study design and population and subsequently what data will be collected and analyzed. 1
Objectives of this article
In this article, we discuss important considerations in the development of a research question and hypothesis and in defining objectives for research. By the end of this article, the reader will be able to appreciate the significance of constructing a good research question and developing hypotheses and research objectives for the successful design of a research study. The following article is divided into 3 sections: research question, research hypothesis and research objectives.
Research question
Interest in a particular topic usually begins the research process, but it is the familiarity with the subject that helps define an appropriate research question for a study. 1 Questions then arise out of a perceived knowledge deficit within a subject area or field of study. 2 Indeed, Haynes suggests that it is important to know “where the boundary between current knowledge and ignorance lies.” 1 The challenge in developing an appropriate research question is in determining which clinical uncertainties could or should be studied and also rationalizing the need for their investigation.
Increasing one’s knowledge about the subject of interest can be accomplished in many ways. Appropriate methods include systematically searching the literature, in-depth interviews and focus groups with patients (and proxies) and interviews with experts in the field. In addition, awareness of current trends and technological advances can assist with the development of research questions. 2 It is imperative to understand what has been studied about a topic to date in order to further the knowledge that has been previously gathered on a topic. Indeed, some granting institutions (e.g., Canadian Institute for Health Research) encourage applicants to conduct a systematic review of the available evidence if a recent review does not already exist and preferably a pilot or feasibility study before applying for a grant for a full trial.
In-depth knowledge about a subject may generate a number of questions. It then becomes necessary to ask whether these questions can be answered through one study or if more than one study needed. 1 Additional research questions can be developed, but several basic principles should be taken into consideration. 1 All questions, primary and secondary, should be developed at the beginning and planning stages of a study. Any additional questions should never compromise the primary question because it is the primary research question that forms the basis of the hypothesis and study objectives. It must be kept in mind that within the scope of one study, the presence of a number of research questions will affect and potentially increase the complexity of both the study design and subsequent statistical analyses, not to mention the actual feasibility of answering every question. 1 A sensible strategy is to establish a single primary research question around which to focus the study plan. 3 In a study, the primary research question should be clearly stated at the end of the introduction of the grant proposal, and it usually specifies the population to be studied, the intervention to be implemented and other circumstantial factors. 4
Hulley and colleagues 2 have suggested the use of the FINER criteria in the development of a good research question ( Box 1 ). The FINER criteria highlight useful points that may increase the chances of developing a successful research project. A good research question should specify the population of interest, be of interest to the scientific community and potentially to the public, have clinical relevance and further current knowledge in the field (and of course be compliant with the standards of ethical boards and national research standards).
FINER criteria for a good research question
| Feasible | ||
| Interesting | ||
| Novel | ||
| Ethical | ||
| Relevant |
Adapted with permission from Wolters Kluwer Health. 2
Whereas the FINER criteria outline the important aspects of the question in general, a useful format to use in the development of a specific research question is the PICO format — consider the population (P) of interest, the intervention (I) being studied, the comparison (C) group (or to what is the intervention being compared) and the outcome of interest (O). 3 , 5 , 6 Often timing (T) is added to PICO ( Box 2 ) — that is, “Over what time frame will the study take place?” 1 The PICOT approach helps generate a question that aids in constructing the framework of the study and subsequently in protocol development by alluding to the inclusion and exclusion criteria and identifying the groups of patients to be included. Knowing the specific population of interest, intervention (and comparator) and outcome of interest may also help the researcher identify an appropriate outcome measurement tool. 7 The more defined the population of interest, and thus the more stringent the inclusion and exclusion criteria, the greater the effect on the interpretation and subsequent applicability and generalizability of the research findings. 1 , 2 A restricted study population (and exclusion criteria) may limit bias and increase the internal validity of the study; however, this approach will limit external validity of the study and, thus, the generalizability of the findings to the practical clinical setting. Conversely, a broadly defined study population and inclusion criteria may be representative of practical clinical practice but may increase bias and reduce the internal validity of the study.
PICOT criteria 1
| Population (patients) | ||
| Intervention (for intervention studies only) | ||
| Comparison group | ||
| Outcome of interest | ||
| Time |
A poorly devised research question may affect the choice of study design, potentially lead to futile situations and, thus, hamper the chance of determining anything of clinical significance, which will then affect the potential for publication. Without devoting appropriate resources to developing the research question, the quality of the study and subsequent results may be compromised. During the initial stages of any research study, it is therefore imperative to formulate a research question that is both clinically relevant and answerable.
Research hypothesis
The primary research question should be driven by the hypothesis rather than the data. 1 , 2 That is, the research question and hypothesis should be developed before the start of the study. This sounds intuitive; however, if we take, for example, a database of information, it is potentially possible to perform multiple statistical comparisons of groups within the database to find a statistically significant association. This could then lead one to work backward from the data and develop the “question.” This is counterintuitive to the process because the question is asked specifically to then find the answer, thus collecting data along the way (i.e., in a prospective manner). Multiple statistical testing of associations from data previously collected could potentially lead to spuriously positive findings of association through chance alone. 2 Therefore, a good hypothesis must be based on a good research question at the start of a trial and, indeed, drive data collection for the study.
The research or clinical hypothesis is developed from the research question and then the main elements of the study — sampling strategy, intervention (if applicable), comparison and outcome variables — are summarized in a form that establishes the basis for testing, statistical and ultimately clinical significance. 3 For example, in a research study comparing computer-assisted acetabular component insertion versus freehand acetabular component placement in patients in need of total hip arthroplasty, the experimental group would be computer-assisted insertion and the control/conventional group would be free-hand placement. The investigative team would first state a research hypothesis. This could be expressed as a single outcome (e.g., computer-assisted acetabular component placement leads to improved functional outcome) or potentially as a complex/composite outcome; that is, more than one outcome (e.g., computer-assisted acetabular component placement leads to both improved radiographic cup placement and improved functional outcome).
However, when formally testing statistical significance, the hypothesis should be stated as a “null” hypothesis. 2 The purpose of hypothesis testing is to make an inference about the population of interest on the basis of a random sample taken from that population. The null hypothesis for the preceding research hypothesis then would be that there is no difference in mean functional outcome between the computer-assisted insertion and free-hand placement techniques. After forming the null hypothesis, the researchers would form an alternate hypothesis stating the nature of the difference, if it should appear. The alternate hypothesis would be that there is a difference in mean functional outcome between these techniques. At the end of the study, the null hypothesis is then tested statistically. If the findings of the study are not statistically significant (i.e., there is no difference in functional outcome between the groups in a statistical sense), we cannot reject the null hypothesis, whereas if the findings were significant, we can reject the null hypothesis and accept the alternate hypothesis (i.e., there is a difference in mean functional outcome between the study groups), errors in testing notwithstanding. In other words, hypothesis testing confirms or refutes the statement that the observed findings did not occur by chance alone but rather occurred because there was a true difference in outcomes between these surgical procedures. The concept of statistical hypothesis testing is complex, and the details are beyond the scope of this article.
Another important concept inherent in hypothesis testing is whether the hypotheses will be 1-sided or 2-sided. A 2-sided hypothesis states that there is a difference between the experimental group and the control group, but it does not specify in advance the expected direction of the difference. For example, we asked whether there is there an improvement in outcomes with computer-assisted surgery or whether the outcomes worse with computer-assisted surgery. We presented a 2-sided test in the above example because we did not specify the direction of the difference. A 1-sided hypothesis states a specific direction (e.g., there is an improvement in outcomes with computer-assisted surgery). A 2-sided hypothesis should be used unless there is a good justification for using a 1-sided hypothesis. As Bland and Atlman 8 stated, “One-sided hypothesis testing should never be used as a device to make a conventionally nonsignificant difference significant.”
The research hypothesis should be stated at the beginning of the study to guide the objectives for research. Whereas the investigators may state the hypothesis as being 1-sided (there is an improvement with treatment), the study and investigators must adhere to the concept of clinical equipoise. According to this principle, a clinical (or surgical) trial is ethical only if the expert community is uncertain about the relative therapeutic merits of the experimental and control groups being evaluated. 9 It means there must exist an honest and professional disagreement among expert clinicians about the preferred treatment. 9
Designing a research hypothesis is supported by a good research question and will influence the type of research design for the study. Acting on the principles of appropriate hypothesis development, the study can then confidently proceed to the development of the research objective.
Research objective
The primary objective should be coupled with the hypothesis of the study. Study objectives define the specific aims of the study and should be clearly stated in the introduction of the research protocol. 7 From our previous example and using the investigative hypothesis that there is a difference in functional outcomes between computer-assisted acetabular component placement and free-hand placement, the primary objective can be stated as follows: this study will compare the functional outcomes of computer-assisted acetabular component insertion versus free-hand placement in patients undergoing total hip arthroplasty. Note that the study objective is an active statement about how the study is going to answer the specific research question. Objectives can (and often do) state exactly which outcome measures are going to be used within their statements. They are important because they not only help guide the development of the protocol and design of study but also play a role in sample size calculations and determining the power of the study. 7 These concepts will be discussed in other articles in this series.
From the surgeon’s point of view, it is important for the study objectives to be focused on outcomes that are important to patients and clinically relevant. For example, the most methodologically sound randomized controlled trial comparing 2 techniques of distal radial fixation would have little or no clinical impact if the primary objective was to determine the effect of treatment A as compared to treatment B on intraoperative fluoroscopy time. However, if the objective was to determine the effect of treatment A as compared to treatment B on patient functional outcome at 1 year, this would have a much more significant impact on clinical decision-making. Second, more meaningful surgeon–patient discussions could ensue, incorporating patient values and preferences with the results from this study. 6 , 7 It is the precise objective and what the investigator is trying to measure that is of clinical relevance in the practical setting.
The following is an example from the literature about the relation between the research question, hypothesis and study objectives:
Study: Warden SJ, Metcalf BR, Kiss ZS, et al. Low-intensity pulsed ultrasound for chronic patellar tendinopathy: a randomized, double-blind, placebo-controlled trial. Rheumatology 2008;47:467–71.
Research question: How does low-intensity pulsed ultrasound (LIPUS) compare with a placebo device in managing the symptoms of skeletally mature patients with patellar tendinopathy?
Research hypothesis: Pain levels are reduced in patients who receive daily active-LIPUS (treatment) for 12 weeks compared with individuals who receive inactive-LIPUS (placebo).
Objective: To investigate the clinical efficacy of LIPUS in the management of patellar tendinopathy symptoms.
The development of the research question is the most important aspect of a research project. A research project can fail if the objectives and hypothesis are poorly focused and underdeveloped. Useful tips for surgical researchers are provided in Box 3 . Designing and developing an appropriate and relevant research question, hypothesis and objectives can be a difficult task. The critical appraisal of the research question used in a study is vital to the application of the findings to clinical practice. Focusing resources, time and dedication to these 3 very important tasks will help to guide a successful research project, influence interpretation of the results and affect future publication efforts.
Tips for developing research questions, hypotheses and objectives for research studies
- Perform a systematic literature review (if one has not been done) to increase knowledge and familiarity with the topic and to assist with research development.
- Learn about current trends and technological advances on the topic.
- Seek careful input from experts, mentors, colleagues and collaborators to refine your research question as this will aid in developing the research question and guide the research study.
- Use the FINER criteria in the development of the research question.
- Ensure that the research question follows PICOT format.
- Develop a research hypothesis from the research question.
- Develop clear and well-defined primary and secondary (if needed) objectives.
- Ensure that the research question and objectives are answerable, feasible and clinically relevant.
FINER = feasible, interesting, novel, ethical, relevant; PICOT = population (patients), intervention (for intervention studies only), comparison group, outcome of interest, time.
Competing interests: No funding was received in preparation of this paper. Dr. Bhandari was funded, in part, by a Canada Research Chair, McMaster University.

How to Develop a Good Research Hypothesis
The story of a research study begins by asking a question. Researchers all around the globe are asking curious questions and formulating research hypothesis. However, whether the research study provides an effective conclusion depends on how well one develops a good research hypothesis. Research hypothesis examples could help researchers get an idea as to how to write a good research hypothesis.
This blog will help you understand what is a research hypothesis, its characteristics and, how to formulate a research hypothesis
Table of Contents
What is Hypothesis?
Hypothesis is an assumption or an idea proposed for the sake of argument so that it can be tested. It is a precise, testable statement of what the researchers predict will be outcome of the study. Hypothesis usually involves proposing a relationship between two variables: the independent variable (what the researchers change) and the dependent variable (what the research measures).
What is a Research Hypothesis?
Research hypothesis is a statement that introduces a research question and proposes an expected result. It is an integral part of the scientific method that forms the basis of scientific experiments. Therefore, you need to be careful and thorough when building your research hypothesis. A minor flaw in the construction of your hypothesis could have an adverse effect on your experiment. In research, there is a convention that the hypothesis is written in two forms, the null hypothesis, and the alternative hypothesis (called the experimental hypothesis when the method of investigation is an experiment).
Characteristics of a Good Research Hypothesis
As the hypothesis is specific, there is a testable prediction about what you expect to happen in a study. You may consider drawing hypothesis from previously published research based on the theory.
A good research hypothesis involves more effort than just a guess. In particular, your hypothesis may begin with a question that could be further explored through background research.
To help you formulate a promising research hypothesis, you should ask yourself the following questions:
- Is the language clear and focused?
- What is the relationship between your hypothesis and your research topic?
- Is your hypothesis testable? If yes, then how?
- What are the possible explanations that you might want to explore?
- Does your hypothesis include both an independent and dependent variable?
- Can you manipulate your variables without hampering the ethical standards?
- Does your research predict the relationship and outcome?
- Is your research simple and concise (avoids wordiness)?
- Is it clear with no ambiguity or assumptions about the readers’ knowledge
- Is your research observable and testable results?
- Is it relevant and specific to the research question or problem?

The questions listed above can be used as a checklist to make sure your hypothesis is based on a solid foundation. Furthermore, it can help you identify weaknesses in your hypothesis and revise it if necessary.
Source: Educational Hub
How to formulate a research hypothesis.
A testable hypothesis is not a simple statement. It is rather an intricate statement that needs to offer a clear introduction to a scientific experiment, its intentions, and the possible outcomes. However, there are some important things to consider when building a compelling hypothesis.
1. State the problem that you are trying to solve.
Make sure that the hypothesis clearly defines the topic and the focus of the experiment.
2. Try to write the hypothesis as an if-then statement.
Follow this template: If a specific action is taken, then a certain outcome is expected.
3. Define the variables
Independent variables are the ones that are manipulated, controlled, or changed. Independent variables are isolated from other factors of the study.
Dependent variables , as the name suggests are dependent on other factors of the study. They are influenced by the change in independent variable.
4. Scrutinize the hypothesis
Evaluate assumptions, predictions, and evidence rigorously to refine your understanding.
Types of Research Hypothesis
The types of research hypothesis are stated below:
1. Simple Hypothesis
It predicts the relationship between a single dependent variable and a single independent variable.
2. Complex Hypothesis
It predicts the relationship between two or more independent and dependent variables.
3. Directional Hypothesis
It specifies the expected direction to be followed to determine the relationship between variables and is derived from theory. Furthermore, it implies the researcher’s intellectual commitment to a particular outcome.
4. Non-directional Hypothesis
It does not predict the exact direction or nature of the relationship between the two variables. The non-directional hypothesis is used when there is no theory involved or when findings contradict previous research.
5. Associative and Causal Hypothesis
The associative hypothesis defines interdependency between variables. A change in one variable results in the change of the other variable. On the other hand, the causal hypothesis proposes an effect on the dependent due to manipulation of the independent variable.
6. Null Hypothesis
Null hypothesis states a negative statement to support the researcher’s findings that there is no relationship between two variables. There will be no changes in the dependent variable due the manipulation of the independent variable. Furthermore, it states results are due to chance and are not significant in terms of supporting the idea being investigated.
7. Alternative Hypothesis
It states that there is a relationship between the two variables of the study and that the results are significant to the research topic. An experimental hypothesis predicts what changes will take place in the dependent variable when the independent variable is manipulated. Also, it states that the results are not due to chance and that they are significant in terms of supporting the theory being investigated.
Research Hypothesis Examples of Independent and Dependent Variables
Research Hypothesis Example 1 The greater number of coal plants in a region (independent variable) increases water pollution (dependent variable). If you change the independent variable (building more coal factories), it will change the dependent variable (amount of water pollution).
Research Hypothesis Example 2 What is the effect of diet or regular soda (independent variable) on blood sugar levels (dependent variable)? If you change the independent variable (the type of soda you consume), it will change the dependent variable (blood sugar levels)
You should not ignore the importance of the above steps. The validity of your experiment and its results rely on a robust testable hypothesis. Developing a strong testable hypothesis has few advantages, it compels us to think intensely and specifically about the outcomes of a study. Consequently, it enables us to understand the implication of the question and the different variables involved in the study. Furthermore, it helps us to make precise predictions based on prior research. Hence, forming a hypothesis would be of great value to the research. Here are some good examples of testable hypotheses.
More importantly, you need to build a robust testable research hypothesis for your scientific experiments. A testable hypothesis is a hypothesis that can be proved or disproved as a result of experimentation.
Importance of a Testable Hypothesis
To devise and perform an experiment using scientific method, you need to make sure that your hypothesis is testable. To be considered testable, some essential criteria must be met:
- There must be a possibility to prove that the hypothesis is true.
- There must be a possibility to prove that the hypothesis is false.
- The results of the hypothesis must be reproducible.
Without these criteria, the hypothesis and the results will be vague. As a result, the experiment will not prove or disprove anything significant.
What are your experiences with building hypotheses for scientific experiments? What challenges did you face? How did you overcome these challenges? Please share your thoughts with us in the comments section.
Frequently Asked Questions
The steps to write a research hypothesis are: 1. Stating the problem: Ensure that the hypothesis defines the research problem 2. Writing a hypothesis as an 'if-then' statement: Include the action and the expected outcome of your study by following a ‘if-then’ structure. 3. Defining the variables: Define the variables as Dependent or Independent based on their dependency to other factors. 4. Scrutinizing the hypothesis: Identify the type of your hypothesis
Hypothesis testing is a statistical tool which is used to make inferences about a population data to draw conclusions for a particular hypothesis.
Hypothesis in statistics is a formal statement about the nature of a population within a structured framework of a statistical model. It is used to test an existing hypothesis by studying a population.
Research hypothesis is a statement that introduces a research question and proposes an expected result. It forms the basis of scientific experiments.
The different types of hypothesis in research are: • Null hypothesis: Null hypothesis is a negative statement to support the researcher’s findings that there is no relationship between two variables. • Alternate hypothesis: Alternate hypothesis predicts the relationship between the two variables of the study. • Directional hypothesis: Directional hypothesis specifies the expected direction to be followed to determine the relationship between variables. • Non-directional hypothesis: Non-directional hypothesis does not predict the exact direction or nature of the relationship between the two variables. • Simple hypothesis: Simple hypothesis predicts the relationship between a single dependent variable and a single independent variable. • Complex hypothesis: Complex hypothesis predicts the relationship between two or more independent and dependent variables. • Associative and casual hypothesis: Associative and casual hypothesis predicts the relationship between two or more independent and dependent variables. • Empirical hypothesis: Empirical hypothesis can be tested via experiments and observation. • Statistical hypothesis: A statistical hypothesis utilizes statistical models to draw conclusions about broader populations.

Wow! You really simplified your explanation that even dummies would find it easy to comprehend. Thank you so much.
Thanks a lot for your valuable guidance.
I enjoy reading the post. Hypotheses are actually an intrinsic part in a study. It bridges the research question and the methodology of the study.
Useful piece!
This is awesome.Wow.
It very interesting to read the topic, can you guide me any specific example of hypothesis process establish throw the Demand and supply of the specific product in market
Nicely explained
It is really a useful for me Kindly give some examples of hypothesis
It was a well explained content ,can you please give me an example with the null and alternative hypothesis illustrated
clear and concise. thanks.
So Good so Amazing
Good to learn
Thanks a lot for explaining to my level of understanding
Explained well and in simple terms. Quick read! Thank you
It awesome. It has really positioned me in my research project
Rate this article Cancel Reply
Your email address will not be published.

Enago Academy's Most Popular Articles

- Reporting Research
Choosing the Right Analytical Approach: Thematic analysis vs. content analysis for data interpretation
In research, choosing the right approach to understand data is crucial for deriving meaningful insights.…

Comparing Cross Sectional and Longitudinal Studies: 5 steps for choosing the right approach
The process of choosing the right research design can put ourselves at the crossroads of…

- Industry News
COPE Forum Discussion Highlights Challenges and Urges Clarity in Institutional Authorship Standards
The COPE forum discussion held in December 2023 initiated with a fundamental question — is…

- Career Corner
Unlocking the Power of Networking in Academic Conferences
Embarking on your first academic conference experience? Fear not, we got you covered! Academic conferences…

Research Recommendations – Guiding policy-makers for evidence-based decision making
Research recommendations play a crucial role in guiding scholars and researchers toward fruitful avenues of…
Choosing the Right Analytical Approach: Thematic analysis vs. content analysis for…
Comparing Cross Sectional and Longitudinal Studies: 5 steps for choosing the right…
How to Design Effective Research Questionnaires for Robust Findings

Sign-up to read more
Subscribe for free to get unrestricted access to all our resources on research writing and academic publishing including:
- 2000+ blog articles
- 50+ Webinars
- 10+ Expert podcasts
- 50+ Infographics
- 10+ Checklists
- Research Guides
We hate spam too. We promise to protect your privacy and never spam you.
I am looking for Editing/ Proofreading services for my manuscript Tentative date of next journal submission:

As a researcher, what do you consider most when choosing an image manipulation detector?
Have a language expert improve your writing
Run a free plagiarism check in 10 minutes, generate accurate citations for free.
- Knowledge Base
Hypothesis Testing | A Step-by-Step Guide with Easy Examples
Published on November 8, 2019 by Rebecca Bevans . Revised on June 22, 2023.
Hypothesis testing is a formal procedure for investigating our ideas about the world using statistics . It is most often used by scientists to test specific predictions, called hypotheses, that arise from theories.
There are 5 main steps in hypothesis testing:
- State your research hypothesis as a null hypothesis and alternate hypothesis (H o ) and (H a or H 1 ).
- Collect data in a way designed to test the hypothesis.
- Perform an appropriate statistical test .
- Decide whether to reject or fail to reject your null hypothesis.
- Present the findings in your results and discussion section.
Though the specific details might vary, the procedure you will use when testing a hypothesis will always follow some version of these steps.
Table of contents
Step 1: state your null and alternate hypothesis, step 2: collect data, step 3: perform a statistical test, step 4: decide whether to reject or fail to reject your null hypothesis, step 5: present your findings, other interesting articles, frequently asked questions about hypothesis testing.
After developing your initial research hypothesis (the prediction that you want to investigate), it is important to restate it as a null (H o ) and alternate (H a ) hypothesis so that you can test it mathematically.
The alternate hypothesis is usually your initial hypothesis that predicts a relationship between variables. The null hypothesis is a prediction of no relationship between the variables you are interested in.
- H 0 : Men are, on average, not taller than women. H a : Men are, on average, taller than women.
Prevent plagiarism. Run a free check.
For a statistical test to be valid , it is important to perform sampling and collect data in a way that is designed to test your hypothesis. If your data are not representative, then you cannot make statistical inferences about the population you are interested in.
There are a variety of statistical tests available, but they are all based on the comparison of within-group variance (how spread out the data is within a category) versus between-group variance (how different the categories are from one another).
If the between-group variance is large enough that there is little or no overlap between groups, then your statistical test will reflect that by showing a low p -value . This means it is unlikely that the differences between these groups came about by chance.
Alternatively, if there is high within-group variance and low between-group variance, then your statistical test will reflect that with a high p -value. This means it is likely that any difference you measure between groups is due to chance.
Your choice of statistical test will be based on the type of variables and the level of measurement of your collected data .
- an estimate of the difference in average height between the two groups.
- a p -value showing how likely you are to see this difference if the null hypothesis of no difference is true.
Based on the outcome of your statistical test, you will have to decide whether to reject or fail to reject your null hypothesis.
In most cases you will use the p -value generated by your statistical test to guide your decision. And in most cases, your predetermined level of significance for rejecting the null hypothesis will be 0.05 – that is, when there is a less than 5% chance that you would see these results if the null hypothesis were true.
In some cases, researchers choose a more conservative level of significance, such as 0.01 (1%). This minimizes the risk of incorrectly rejecting the null hypothesis ( Type I error ).
The results of hypothesis testing will be presented in the results and discussion sections of your research paper , dissertation or thesis .
In the results section you should give a brief summary of the data and a summary of the results of your statistical test (for example, the estimated difference between group means and associated p -value). In the discussion , you can discuss whether your initial hypothesis was supported by your results or not.
In the formal language of hypothesis testing, we talk about rejecting or failing to reject the null hypothesis. You will probably be asked to do this in your statistics assignments.
However, when presenting research results in academic papers we rarely talk this way. Instead, we go back to our alternate hypothesis (in this case, the hypothesis that men are on average taller than women) and state whether the result of our test did or did not support the alternate hypothesis.
If your null hypothesis was rejected, this result is interpreted as “supported the alternate hypothesis.”
These are superficial differences; you can see that they mean the same thing.
You might notice that we don’t say that we reject or fail to reject the alternate hypothesis . This is because hypothesis testing is not designed to prove or disprove anything. It is only designed to test whether a pattern we measure could have arisen spuriously, or by chance.
If we reject the null hypothesis based on our research (i.e., we find that it is unlikely that the pattern arose by chance), then we can say our test lends support to our hypothesis . But if the pattern does not pass our decision rule, meaning that it could have arisen by chance, then we say the test is inconsistent with our hypothesis .
If you want to know more about statistics , methodology , or research bias , make sure to check out some of our other articles with explanations and examples.
- Normal distribution
- Descriptive statistics
- Measures of central tendency
- Correlation coefficient
Methodology
- Cluster sampling
- Stratified sampling
- Types of interviews
- Cohort study
- Thematic analysis
Research bias
- Implicit bias
- Cognitive bias
- Survivorship bias
- Availability heuristic
- Nonresponse bias
- Regression to the mean
Hypothesis testing is a formal procedure for investigating our ideas about the world using statistics. It is used by scientists to test specific predictions, called hypotheses , by calculating how likely it is that a pattern or relationship between variables could have arisen by chance.
A hypothesis states your predictions about what your research will find. It is a tentative answer to your research question that has not yet been tested. For some research projects, you might have to write several hypotheses that address different aspects of your research question.
A hypothesis is not just a guess — it should be based on existing theories and knowledge. It also has to be testable, which means you can support or refute it through scientific research methods (such as experiments, observations and statistical analysis of data).
Null and alternative hypotheses are used in statistical hypothesis testing . The null hypothesis of a test always predicts no effect or no relationship between variables, while the alternative hypothesis states your research prediction of an effect or relationship.
Cite this Scribbr article
If you want to cite this source, you can copy and paste the citation or click the “Cite this Scribbr article” button to automatically add the citation to our free Citation Generator.
Bevans, R. (2023, June 22). Hypothesis Testing | A Step-by-Step Guide with Easy Examples. Scribbr. Retrieved June 7, 2024, from https://www.scribbr.com/statistics/hypothesis-testing/
Is this article helpful?

Rebecca Bevans
Other students also liked, choosing the right statistical test | types & examples, understanding p values | definition and examples, what is your plagiarism score.
- Foundations
- Write Paper
Search form
- Experiments
- Anthropology
- Self-Esteem
- Social Anxiety
Research Hypothesis
A research hypothesis (H 1 ) is the statement created by researchers when they speculate upon the outcome of a research or experiment.
This article is a part of the guide:
- Null Hypothesis
- Defining a Research Problem
- Selecting Method
- Test Hypothesis
Browse Full Outline
- 1 Scientific Method
- 2.1.1 Null Hypothesis
- 2.1.2 Research Hypothesis
- 2.2 Prediction
- 2.3 Conceptual Variable
- 3.1 Operationalization
- 3.2 Selecting Method
- 3.3 Measurements
- 3.4 Scientific Observation
- 4.1 Empirical Evidence
- 5.1 Generalization
- 5.2 Errors in Conclusion
Every true experimental design must have this statement at the core of its structure, as the ultimate aim of any experiment.
The hypothesis is generated via a number of means, but is usually the result of a process of inductive reasoning where observations lead to the formation of a theory. Scientists then use a large battery of deductive methods to arrive at a hypothesis that is testable , falsifiable and realistic.

The precursor to a hypothesis is a research problem , usually framed as a question . It might ask what, or why, something is happening.
For example, we might wonder why the stocks of cod in the North Atlantic are declining. The problem question might be ‘Why are the numbers of Cod in the North Atlantic declining?’
This is too broad as a statement and is not testable by any reasonable scientific means. It is merely a tentative question arising from literature reviews and intuition. Many people would think that instinct and intuition are unscientific, but many of the greatest scientific leaps were a result of ‘hunches’.
The research hypothesis is a paring down of the problem into something testable and falsifiable. In the above example, a researcher might speculate that the decline in the fish stocks is due to prolonged over fishing. Scientists must generate a realistic and testable hypothesis around which they can build the experiment.
This might be a question, a statement or an ‘If/Or’ statement. Some examples could be:
Over-fishing affects the stocks of cod.
If over-fishing is causing a decline in the numbers of Cod, reducing the amount of trawlers will increase cod stocks.
These are acceptable statements and they all give the researcher a focus for constructing a research experiment. The last example formalizes things and uses an ‘If’ statement, measuring the effect that manipulating one variable has upon another. Though the other one is perfectly acceptable, an ideal research hypothesis should contain a prediction, which is why the more formal ones are favored.
A scientist who becomes fixated on proving a research hypothesis loses their impartiality and credibility. Statistical tests often uncover trends, but rarely give a clear-cut answer, with other factors often affecting the outcome and influencing the results .
Whilst gut instinct and logic tells us that fish stocks are affected by over fishing, it is not necessarily true and the researcher must consider that outcome. Perhaps environmental factors or pollution are causal effects influencing fish stocks.
A hypothesis must be testable , taking into account current knowledge and techniques, and be realistic. If the researcher does not have a multi-million dollar budget then there is no point in generating complicated hypotheses. A hypothesis must be verifiable by statistical and analytical means, to allow a verification or falsification .
In fact, a hypothesis is never proved, and it is better practice to use the terms ‘supported’ or ‘verified’. This means that the research showed that the evidence supported the hypothesis and further research is built upon that.
Your hypothesis should... Be written in clear, concise language Have both an independent and dependent variable Be falsifiable – is it possible to prove or disprove the statement? Make a prediction or speculate on an outcome Be practicable – can you measure the variables in question? Hypothesize about a proposed relationship between two variables, or an intervention into this relationship
A research hypothesis , which stands the test of time, eventually becomes a theory, such as Einstein’s General Relativity. Even then, as with Newton’s Laws, they can still be falsified or adapted.
The research hypothesis is often also callen H 1 and opposes the current view, called the null hypothesis (H 0 ).

Consider the following hypotheses. Are they likely to lead to sound research and conclusions, and if not, how could they be improved?
Adding mica to a plastic compound will decrease its viscosity.
Those who drink a cup of green tea daily experience enhanced wellness.
Prolonged staring into solar eclipses confers extrasensory powers.
A decline in family values is lowering the marriage rate.
Children with insecure attachment style are more likely to engage in political dissent as adults.
Sub-Saharan Africa experiences more deaths due to Tuberculosis because the HIV rate is higher there.
This is an ideal hypothesis statement. It is well-phrased, clear, falsifiable and merely by reading it, one gets an idea of the kind of research design it would inspire.
This hypothesis is less clear, and the problem is with the dependent variable. Cups of green tea can be easily quantified, but how will the researchers measure “wellness”? A better hypothesis might be: those who drink a cup of green tea daily display lower levels of inflammatory markers in the blood.
Though this hypothesis looks a little ridiculous, it is actually quite simple, falsifiable and easy to operationalize. The obvious problem is that scientific research seldom occupies itself with supernatural phenomenon and worse, putting this research into action will likely cause damage to its participants. When it comes to hypotheses, not all questions need to be answered!
Provided the researchers have a solid method for quantifying “family values” this hypothesis is not too bad. However, scientists should always be alert for their own possible biases creeping into research, and this can occur right from the start. Normative topics with moral elements are seldom neutral. A better hypothesis will remove any contentious, subjective elements. A better hypothesis: decrease in total discretionary income corresponds to lower marriage rate in people 20 – 30 years of age.
This hypothesis may yield very interesting and useful results, but practically, how will the researchers gather the data? Even if research is logically sound, it may not be feasible in the real world. A researcher might instead choose to make a more manageable hypothesis: high scores on an insecure attachment style questionnaire will correlate with high scores on a political dissention questionnaire.
Though complex, this is a good hypothesis. It is falsifiable, has clearly identified variables and can be supported or rejected using the right statistical methods.
- Psychology 101
- Flags and Countries
- Capitals and Countries
Martyn Shuttleworth , Lyndsay T Wilson (Mar 17, 2008). Research Hypothesis. Retrieved Jun 08, 2024 from Explorable.com: https://explorable.com/research-hypothesis
You Are Allowed To Copy The Text
The text in this article is licensed under the Creative Commons-License Attribution 4.0 International (CC BY 4.0) .
This means you're free to copy, share and adapt any parts (or all) of the text in the article, as long as you give appropriate credit and provide a link/reference to this page.
That is it. You don't need our permission to copy the article; just include a link/reference back to this page. You can use it freely (with some kind of link), and we're also okay with people reprinting in publications like books, blogs, newsletters, course-material, papers, wikipedia and presentations (with clear attribution).

Want to stay up to date? Follow us!
Get all these articles in 1 guide.
Want the full version to study at home, take to school or just scribble on?
Whether you are an academic novice, or you simply want to brush up your skills, this book will take your academic writing skills to the next level.

Download electronic versions: - Epub for mobiles and tablets - For Kindle here - PDF version here
Save this course for later
Don't have time for it all now? No problem, save it as a course and come back to it later.
Footer bottom
- Privacy Policy

- Subscribe to our RSS Feed
- Like us on Facebook
- Follow us on Twitter

- school Campus Bookshelves
- menu_book Bookshelves
- perm_media Learning Objects
- login Login
- how_to_reg Request Instructor Account
- hub Instructor Commons
Margin Size
- Download Page (PDF)
- Download Full Book (PDF)
- Periodic Table
- Physics Constants
- Scientific Calculator
- Reference & Cite
- Tools expand_more
- Readability
selected template will load here
This action is not available.
4.2.3: Hypothesis Testing- Slope to ANOVAs
- Last updated
- Save as PDF
- Page ID 44947

- Michelle Oja
- Taft College
\( \newcommand{\vecs}[1]{\overset { \scriptstyle \rightharpoonup} {\mathbf{#1}} } \)
\( \newcommand{\vecd}[1]{\overset{-\!-\!\rightharpoonup}{\vphantom{a}\smash {#1}}} \)
\( \newcommand{\id}{\mathrm{id}}\) \( \newcommand{\Span}{\mathrm{span}}\)
( \newcommand{\kernel}{\mathrm{null}\,}\) \( \newcommand{\range}{\mathrm{range}\,}\)
\( \newcommand{\RealPart}{\mathrm{Re}}\) \( \newcommand{\ImaginaryPart}{\mathrm{Im}}\)
\( \newcommand{\Argument}{\mathrm{Arg}}\) \( \newcommand{\norm}[1]{\| #1 \|}\)
\( \newcommand{\inner}[2]{\langle #1, #2 \rangle}\)
\( \newcommand{\Span}{\mathrm{span}}\)
\( \newcommand{\id}{\mathrm{id}}\)
\( \newcommand{\kernel}{\mathrm{null}\,}\)
\( \newcommand{\range}{\mathrm{range}\,}\)
\( \newcommand{\RealPart}{\mathrm{Re}}\)
\( \newcommand{\ImaginaryPart}{\mathrm{Im}}\)
\( \newcommand{\Argument}{\mathrm{Arg}}\)
\( \newcommand{\norm}[1]{\| #1 \|}\)
\( \newcommand{\Span}{\mathrm{span}}\) \( \newcommand{\AA}{\unicode[.8,0]{x212B}}\)
\( \newcommand{\vectorA}[1]{\vec{#1}} % arrow\)
\( \newcommand{\vectorAt}[1]{\vec{\text{#1}}} % arrow\)
\( \newcommand{\vectorB}[1]{\overset { \scriptstyle \rightharpoonup} {\mathbf{#1}} } \)
\( \newcommand{\vectorC}[1]{\textbf{#1}} \)
\( \newcommand{\vectorD}[1]{\overrightarrow{#1}} \)
\( \newcommand{\vectorDt}[1]{\overrightarrow{\text{#1}}} \)
\( \newcommand{\vectE}[1]{\overset{-\!-\!\rightharpoonup}{\vphantom{a}\smash{\mathbf {#1}}}} \)
In regression, we are interested in predicting \(Y\) scores and explaining variance using a line, the slope of which is what allows us to get closer to our observed scores than the mean of \(Y\) can. Thus, our hypotheses can concern the slope of the line, which is estimated in the prediction equation by \(b\).
Research Hypothesis
Specifically, we want to test that the slope is not zero. The research hypothesis will be that there is an explanatory relation between the variables.
- RH: \(\beta>0\ \)
- RH: \(\beta<0\ \)
- RH: \(\beta \neq 0\ \)
A non-zero slope indicates that we can explain values in \(Y\) based on \(X\) and therefore predict future values of \(Y\) based on \(X\).
Null Hypothesis
Thus, the null hypothesis is that the slope is zero, that there is no explanatory relation between our variables
\[\text{Null Hypothesis}: \beta=0 \nonumber \]
Regression Uses a ANOVA Summary Table
DId you notice that we don't have a test statistic yet (like \(t\), F of ANOVA, or Pearson's \(r\) yet? To test the null hypothesis, we use the \(F\) statistic of ANOVA from an ANOVA Summary Table compared to a critical value from the \(F\) distribution table.
Our ANOVA table in regression follows the exact same format as it did for ANOVA ( Table \(\PageIndex{1}\) ). Our top row is our observed effect, our middle row is our error, and our bottom row is our total. The columns take on the same interpretations as well: from left to right, we have our sums of squares, our degrees of freedom, our mean squares, and our \(F\) statistic.
| Source | \(SS\) | \(df\) | \(MS\) | \(F\) |
|---|---|---|---|---|
| Model | \(\sum(\widehat{Y}-\overline{Y})^{2}\) | 1 | \(SS_M / df_M\) | \(MS_M / MS_E\) |
| Error | \(\sum(Y-\widehat{Y})^{2}\) | \(N-2\) | \(SS_E/ df_E\) | N/A |
| Total | \(\sum(Y-\overline{Y})^{2}\) | \(N-1\) | N/A | N/A |
As with ANOVA, getting the values for the \(SS\) column is a straightforward but somewhat arduous process. First, you take the raw scores of \(X\) and \(Y\) and calculate the means, variances, and covariance using the sum of products table introduced in our chapter on correlations. Next, you use the variance of \(X\) and the covariance of \(X\) and \(Y\) to calculate the slope of the line, \(b\), the formula for which is given above. After that, you use the means and the slope to find the intercept, \(a\), which is given alongside \(b\). After that, you use the full prediction equation for the line of best fit to get predicted \(Y\) scores (\(\widehat{Y}\)) for each person. Finally, you use the observed \(Y\) scores, predicted \(Y\) scores, and mean of \(Y\) to find the appropriate deviation scores for each person for each sum of squares source in the table and sum them to get the Sum of Squares Model, Sum of Squares Error, and Sum of Squares Total. As with ANOVA, you won’t be required to compute the \(SS\) values by hand, but you will need to know what they represent and how they fit together.
The other columns in the ANOVA table are all familiar. The degrees of freedom column still has \(N – 1\) for our total, but now we have \(N – 2\) for our error degrees of freedom and 1 for our model degrees of freedom; this is because simple linear regression only has one predictor, so our degrees of freedom for the model is always 1 and does not change. The total degrees of freedom must still be the sum of the other two, so our degrees of freedom error will always be \(N – 2\) for simple linear regression. The mean square columns are still the \(SS\) column divided by the \(df\) column, and the test statistic \(F\) is still the ratio of the mean squares. Based on this, it is now explicitly clear that not only do regression and ANOVA have the same goal but they are, in fact, the same analysis entirely. The only difference is the type of data we have for the IV (predictor): a quantitative variable for for regression and groups (qualitative) for ANOVA. The DV is quantitative for both ANOVAs and regressions/correlations.
With a completed ANOVA Table, we follow the same process of null hypothesis significance testing by comparing our calculated F-score to a critical F-score to determine if we retain or reject the null hypothesis. In ANOVAs, the null hypothesis was that all of the means would be similar, but with correlations (which are what regression is based on), the null hypothesis says that there is no linear relationship. However, what we are really testing is how much variability in the criterion variable (y) can be explained by variation in the predictor variable (y). So, for regression using ANOVA, the null hypothesis is saying that the predictor variable does not explain variation in the criterion variable.
This is a little confusing, so let's take a look at an example of regression in action.
- Skip to primary navigation
- Skip to main content
- Skip to primary sidebar
- Skip to footer
Understanding Science
How science REALLY works...
- Understanding Science 101
- Misconceptions
- Testing ideas with evidence from the natural world is at the core of science.
- Scientific testing involves figuring out what we would expect to observe if an idea were correct and comparing that expectation to what we actually observe.
- Scientific arguments are built from an idea and the evidence relevant to that idea.
- Scientific arguments can be built in any order. Sometimes a scientific idea precedes any evidence relevant to it, and other times the evidence helps inspire the idea.
Misconception: Science proves ideas.
Misconception: Science can only disprove ideas.
Correction: Science neither proves nor disproves. It accepts or rejects ideas based on supporting and refuting evidence, but may revise those conclusions if warranted by new evidence or perspectives. Read more about it.
The core of science: Relating evidence and ideas
In this case, the term argument refers not to a disagreement between two people, but to an evidence-based line of reasoning — so scientific arguments are more like the closing argument in a court case (a logical description of what we think and why we think it) than they are like the fights you may have had with siblings. Scientific arguments involve three components: the idea (a hypothesis or theory), the expectations generated by that idea (frequently called predictions), and the actual observations relevant to those expectations (the evidence). These components are always related in the same logical way:
- What would we expect to see if this idea were true (i.e., what is our expected observation)?
- What do we actually observe?
- Do our expectations match our observations?
PREDICTIONS OR EXPECTATIONS?
When scientists describe their arguments, they frequently talk about their expectations in terms of what a hypothesis or theory predicts: “If it were the case that smoking causes lung cancer, then we’d predict that countries with higher rates of smoking would have higher rates of lung cancer.” At first, it might seem confusing to talk about a prediction that doesn’t deal with the future, but that refers to something going on right now or that may have already happened. In fact, this is just another way of discussing the expectations that the hypothesis or theory generates. So when a scientist talks about the predicted rates of lung cancer, he or she really means something like “the rates that we’d expect to see if our hypothesis were correct.”
If the idea generates expectations that hold true (are actually observed), then the idea is more likely to be accurate. If the idea generates expectations that don’t hold true (are not observed), then we are less likely to accept the idea. For example, consider the idea that cells are the building blocks of life. If that idea were true, we’d expect to see cells in all kinds of living tissues observed under a microscope — that’s our expected observation. In fact, we do observe this (our actual observation), so evidence supports the idea that living things are built from cells.
Though the structure of this argument is consistent (hypothesis, then expectation, then actual observation), its pieces may be assembled in different orders. For example, the first observations of cells were made in the 1600s, but cell theory was not postulated until 200 years later — so in this case, the evidence actually helped inspire the idea. Whether the idea comes first or the evidence comes first, the logic relating them remains the same.
Here, we’ll explore scientific arguments and how to build them. You can investigate:
Putting the pieces together: The hard work of building arguments
- Predicting the past
- Arguments with legs to stand on
Or just click the Next button to dive right in!
- Take a sidetrip
- Teaching resources
Scientific arguments rely on testable ideas. To learn what makes an idea testable, review our Science Checklist .
- Forming hypotheses — scientific explanations — can be difficult for students. It is often easier for students to generate an expectation (what they think will happen or what they expect to observe) based on prior experience than to formulate a potential explanation for that phenomena. You can help students go beyond expectations to generate real, explanatory hypotheses by providing sentence stems for them to fill in: “I expect to observe A because B.” Once students have filled in this sentence you can explain that B is a hypothesis and A is the expectation generated by that hypothesis.
- You can help students learn to distinguish between hypotheses and the expectations generated by them by regularly asking students to analyze lecture material, text, or video. Students should try to figure out which aspects of the content were hypotheses and which were expectations.
Summing up the process
Subscribe to our newsletter
- The science flowchart
- Science stories
- Grade-level teaching guides
- Teaching resource database
- Journaling tool
Chi-Square (Χ²) Test & How To Calculate Formula Equation
Benjamin Frimodig
Science Expert
B.A., History and Science, Harvard University
Ben Frimodig is a 2021 graduate of Harvard College, where he studied the History of Science.
Learn about our Editorial Process
Saul Mcleod, PhD
Editor-in-Chief for Simply Psychology
BSc (Hons) Psychology, MRes, PhD, University of Manchester
Saul Mcleod, PhD., is a qualified psychology teacher with over 18 years of experience in further and higher education. He has been published in peer-reviewed journals, including the Journal of Clinical Psychology.
On This Page:
Chi-square (χ2) is used to test hypotheses about the distribution of observations into categories with no inherent ranking.
What Is a Chi-Square Statistic?
The Chi-square test (pronounced Kai) looks at the pattern of observations and will tell us if certain combinations of the categories occur more frequently than we would expect by chance, given the total number of times each category occurred.
It looks for an association between the variables. We cannot use a correlation coefficient to look for the patterns in this data because the categories often do not form a continuum.
There are three main types of Chi-square tests, tests of goodness of fit, the test of independence, and the test for homogeneity. All three tests rely on the same formula to compute a test statistic.
These tests function by deciphering relationships between observed sets of data and theoretical or “expected” sets of data that align with the null hypothesis.
What is a Contingency Table?
Contingency tables (also known as two-way tables) are grids in which Chi-square data is organized and displayed. They provide a basic picture of the interrelation between two variables and can help find interactions between them.
In contingency tables, one variable and each of its categories are listed vertically, and the other variable and each of its categories are listed horizontally.
Additionally, including column and row totals, also known as “marginal frequencies,” will help facilitate the Chi-square testing process.
In order for the Chi-square test to be considered trustworthy, each cell of your expected contingency table must have a value of at least five.
Each Chi-square test will have one contingency table representing observed counts (see Fig. 1) and one contingency table representing expected counts (see Fig. 2).
 Test & How To Calculate Formula Equation 1")
Figure 1. Observed table (which contains the observed counts).
To obtain the expected frequencies for any cell in any cross-tabulation in which the two variables are assumed independent, multiply the row and column totals for that cell and divide the product by the total number of cases in the table.
 Test & How To Calculate Formula Equation 2")
Figure 2. Expected table (what we expect the two-way table to look like if the two categorical variables are independent).
To decide if our calculated value for χ2 is significant, we also need to work out the degrees of freedom for our contingency table using the following formula: df= (rows – 1) x (columns – 1).
Formula Calculation
 Test & How To Calculate Formula Equation 3")
Calculate the chi-square statistic (χ2) by completing the following steps:
- Calculate the expected frequencies and the observed frequencies.
- For each observed number in the table, subtract the corresponding expected number (O — E).
- Square the difference (O —E)².
- Divide the squares obtained for each cell in the table by the expected number for that cell (O – E)² / E.
- Sum all the values for (O – E)² / E. This is the chi-square statistic.
- Calculate the degrees of freedom for the contingency table using the following formula; df= (rows – 1) x (columns – 1).
Once we have calculated the degrees of freedom (df) and the chi-squared value (χ2), we can use the χ2 table (often at the back of a statistics book) to check if our value for χ2 is higher than the critical value given in the table. If it is, then our result is significant at the level given.
Interpretation
The chi-square statistic tells you how much difference exists between the observed count in each table cell to the counts you would expect if there were no relationship at all in the population.
Small Chi-Square Statistic: If the chi-square statistic is small and the p-value is large (usually greater than 0.05), this often indicates that the observed frequencies in the sample are close to what would be expected under the null hypothesis.
The null hypothesis usually states no association between the variables being studied or that the observed distribution fits the expected distribution.
In theory, if the observed and expected values were equal (no difference), then the chi-square statistic would be zero — but this is unlikely to happen in real life.
Large Chi-Square Statistic : If the chi-square statistic is large and the p-value is small (usually less than 0.05), then the conclusion is often that the data does not fit the model well, i.e., the observed and expected values are significantly different. This often leads to the rejection of the null hypothesis.
How to Report
To report a chi-square output in an APA-style results section, always rely on the following template:
χ2 ( degrees of freedom , N = sample size ) = chi-square statistic value , p = p value .
 Test & How To Calculate Formula Equation 4")
In the case of the above example, the results would be written as follows:
A chi-square test of independence showed that there was a significant association between gender and post-graduation education plans, χ2 (4, N = 101) = 54.50, p < .001.
APA Style Rules
- Do not use a zero before a decimal when the statistic cannot be greater than 1 (proportion, correlation, level of statistical significance).
- Report exact p values to two or three decimals (e.g., p = .006, p = .03).
- However, report p values less than .001 as “ p < .001.”
- Put a space before and after a mathematical operator (e.g., minus, plus, greater than, less than, equals sign).
- Do not repeat statistics in both the text and a table or figure.
p -value Interpretation
You test whether a given χ2 is statistically significant by testing it against a table of chi-square distributions , according to the number of degrees of freedom for your sample, which is the number of categories minus 1. The chi-square assumes that you have at least 5 observations per category.
If you are using SPSS then you will have an expected p -value.
For a chi-square test, a p-value that is less than or equal to the .05 significance level indicates that the observed values are different to the expected values.
Thus, low p-values (p< .05) indicate a likely difference between the theoretical population and the collected sample. You can conclude that a relationship exists between the categorical variables.
Remember that p -values do not indicate the odds that the null hypothesis is true but rather provide the probability that one would obtain the sample distribution observed (or a more extreme distribution) if the null hypothesis was true.
A level of confidence necessary to accept the null hypothesis can never be reached. Therefore, conclusions must choose to either fail to reject the null or accept the alternative hypothesis, depending on the calculated p-value.
The four steps below show you how to analyze your data using a chi-square goodness-of-fit test in SPSS (when you have hypothesized that you have equal expected proportions).
Step 1 : Analyze > Nonparametric Tests > Legacy Dialogs > Chi-square… on the top menu as shown below:
Step 2 : Move the variable indicating categories into the “Test Variable List:” box.
Step 3 : If you want to test the hypothesis that all categories are equally likely, click “OK.”
Step 4 : Specify the expected count for each category by first clicking the “Values” button under “Expected Values.”
Step 5 : Then, in the box to the right of “Values,” enter the expected count for category one and click the “Add” button. Now enter the expected count for category two and click “Add.” Continue in this way until all expected counts have been entered.
Step 6 : Then click “OK.”
The four steps below show you how to analyze your data using a chi-square test of independence in SPSS Statistics.
Step 1 : Open the Crosstabs dialog (Analyze > Descriptive Statistics > Crosstabs).
Step 2 : Select the variables you want to compare using the chi-square test. Click one variable in the left window and then click the arrow at the top to move the variable. Select the row variable and the column variable.
Step 3 : Click Statistics (a new pop-up window will appear). Check Chi-square, then click Continue.
Step 4 : (Optional) Check the box for Display clustered bar charts.
Step 5 : Click OK.
Goodness-of-Fit Test
The Chi-square goodness of fit test is used to compare a randomly collected sample containing a single, categorical variable to a larger population.
This test is most commonly used to compare a random sample to the population from which it was potentially collected.
The test begins with the creation of a null and alternative hypothesis. In this case, the hypotheses are as follows:
Null Hypothesis (Ho) : The null hypothesis (Ho) is that the observed frequencies are the same (except for chance variation) as the expected frequencies. The collected data is consistent with the population distribution.
Alternative Hypothesis (Ha) : The collected data is not consistent with the population distribution.
The next step is to create a contingency table that represents how the data would be distributed if the null hypothesis were exactly correct.
The sample’s overall deviation from this theoretical/expected data will allow us to draw a conclusion, with a more severe deviation resulting in smaller p-values.
Test for Independence
The Chi-square test for independence looks for an association between two categorical variables within the same population.
Unlike the goodness of fit test, the test for independence does not compare a single observed variable to a theoretical population but rather two variables within a sample set to one another.
The hypotheses for a Chi-square test of independence are as follows:
Null Hypothesis (Ho) : There is no association between the two categorical variables in the population of interest.
Alternative Hypothesis (Ha) : There is no association between the two categorical variables in the population of interest.
The next step is to create a contingency table of expected values that reflects how a data set that perfectly aligns the null hypothesis would appear.
The simplest way to do this is to calculate the marginal frequencies of each row and column; the expected frequency of each cell is equal to the marginal frequency of the row and column that corresponds to a given cell in the observed contingency table divided by the total sample size.
Test for Homogeneity
The Chi-square test for homogeneity is organized and executed exactly the same as the test for independence.
The main difference to remember between the two is that the test for independence looks for an association between two categorical variables within the same population, while the test for homogeneity determines if the distribution of a variable is the same in each of several populations (thus allocating population itself as the second categorical variable).
Null Hypothesis (Ho) : There is no difference in the distribution of a categorical variable for several populations or treatments.
Alternative Hypothesis (Ha) : There is a difference in the distribution of a categorical variable for several populations or treatments.
The difference between these two tests can be a bit tricky to determine, especially in the practical applications of a Chi-square test. A reliable rule of thumb is to determine how the data was collected.
If the data consists of only one random sample with the observations classified according to two categorical variables, it is a test for independence. If the data consists of more than one independent random sample, it is a test for homogeneity.
What is the chi-square test?
The Chi-square test is a non-parametric statistical test used to determine if there’s a significant association between two or more categorical variables in a sample.
It works by comparing the observed frequencies in each category of a cross-tabulation with the frequencies expected under the null hypothesis, which assumes there is no relationship between the variables.
This test is often used in fields like biology, marketing, sociology, and psychology for hypothesis testing.
What does chi-square tell you?
The Chi-square test informs whether there is a significant association between two categorical variables. Suppose the calculated Chi-square value is above the critical value from the Chi-square distribution.
In that case, it suggests a significant relationship between the variables, rejecting the null hypothesis of no association.
How to calculate chi-square?
To calculate the Chi-square statistic, follow these steps:
1. Create a contingency table of observed frequencies for each category.
2. Calculate expected frequencies for each category under the null hypothesis.
3. Compute the Chi-square statistic using the formula: Χ² = Σ [ (O_i – E_i)² / E_i ], where O_i is the observed frequency and E_i is the expected frequency.
4. Compare the calculated statistic with the critical value from the Chi-square distribution to draw a conclusion.
Related Articles

Exploratory Data Analysis

Research Methodology , Statistics
What Is Face Validity In Research? Importance & How To Measure

Criterion Validity: Definition & Examples

Convergent Validity: Definition and Examples

Content Validity in Research: Definition & Examples

Construct Validity In Psychology Research
Thank you for visiting nature.com. You are using a browser version with limited support for CSS. To obtain the best experience, we recommend you use a more up to date browser (or turn off compatibility mode in Internet Explorer). In the meantime, to ensure continued support, we are displaying the site without styles and JavaScript.
- View all journals
- Explore content
- About the journal
- Publish with us
- Sign up for alerts
- Perspective
- Published: 03 June 2024
A self-reinforcing cycle hypothesis in heart failure pathogenesis
- Carlos Fernandez-Patron ORCID: orcid.org/0000-0002-8033-0645 1 ,
- Gary D. Lopaschuk ORCID: orcid.org/0000-0003-1010-0454 2 &
- Eugenio Hardy ORCID: orcid.org/0000-0002-8351-4255 3
Nature Cardiovascular Research ( 2024 ) Cite this article
109 Accesses
8 Altmetric
Metrics details
- Energy metabolism
- Heart failure
- Metabolic diseases
- Multienzyme complexes
Heart failure is a progressive syndrome with high morbidity and mortality rates. Here, we suggest that chronic exposure of the heart to risk factors for heart failure damages heart mitochondria, thereby impairing energy production to levels that can suppress the heart’s ability to pump blood and repair mitochondria (both energy-consuming processes). As damaged mitochondria accumulate, the heart becomes deprived of energy in a ‘self-reinforcing cycle’, which can persist after the heart is no longer chronically exposed to (or after antagonism of) the risk factors that initiated the cycle. Together with other previously described pathological mechanisms, this proposed cycle can help explain (1) why heart failure progresses, (2) why it can recur after cessation of treatment, and (3) why heart failure is often accompanied by dysfunction of multiple organs. Ideally, therapy of heart failure syndrome would be best attempted before the self-reinforcing cycle is triggered or designed to break the self-reinforcing cycle.
This is a preview of subscription content, access via your institution
Access options
Subscribe to this journal
Receive 12 digital issues and online access to articles
111,21 € per year
only 9,27 € per issue
Buy this article
- Purchase on Springer Link
- Instant access to full article PDF
Prices may be subject to local taxes which are calculated during checkout
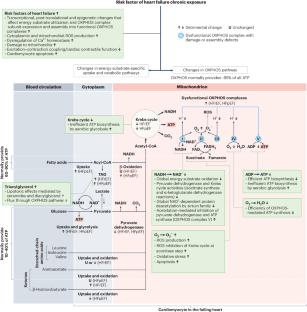
Mitochondrial Ca2+ regulation in the etiology of heart failure: physiological and pathophysiological implications

Metabolic mechanisms in physiological and pathological cardiac hypertrophy: new paradigms and challenges

Cellular and molecular pathobiology of heart failure with preserved ejection fraction
Savarese, G. et al. Global burden of heart failure: a comprehensive and updated review of epidemiology. Cardiovasc. Res. 118 , 3272–3287 (2023).
Article PubMed Google Scholar
Neubauer, S. The failing heart—an engine out of fuel. N. Engl. J. Med. 356 , 1140–1151 (2007). Critical appraisal of the cardiac inefficiency model of heart failure with a focus on the interactions between the cardiac mitochondrial OXPHOS pathway and the phosphagen system involving creatine .
Lopaschuk, G. D., Karwi, Q. G., Tian, R., Wende, A. R. & Abel, E. D. Cardiac energy metabolism in heart failure. Circ. Res. 128 , 1487–1513 (2021).
Article CAS PubMed PubMed Central Google Scholar
Packer, M., Lam, C. S. P., Lund, L. H., Maurer, M. S. & Borlaug, B. A. Characterization of the inflammatory–metabolic phenotype of heart failure with a preserved ejection fraction: a hypothesis to explain influence of sex on the evolution and potential treatment of the disease. Eur. J. Heart Fail. 22 , 1551–1567 (2020).
Decherd, G. & Visscher, M. B. Energy metabolism of the failing heart. J. Exp. Med. 59 , 195–199 (1934). A cardiac inefficiency model is first proposed to explain heart failure .
Packer, M. How should physicians view heart failure? The philosophical and physiological evolution of three conceptual models of the disease. Am. J. Cardiol. 71 , 3C–11C (1993). Three distinct conceptual models of heart failure developed over the span of 50 years have provided a rational basis for the treatment of the disease .
Article CAS PubMed Google Scholar
Seta, Y., Shan, K., Bozkurt, B., Oral, H. & Mann, D. L. Basic mechanisms in heart failure: the cytokine hypothesis. J. Card. Fail. 2 , 243–249 (1996). Cytokines, much like the neurohormones, may contribute to the development and progression of heart failure .
Brown, D. A. et al. Expert consensus document: mitochondrial function as a therapeutic target in heart failure. Nat. Rev. Cardiol. 14 , 238–250 (2017).
Packer, M. et al. Blinded withdrawal of long-term randomized treatment with empagliflozin or placebo in patients with heart failure. Circulation 148 , 1011–1022 (2023). Effects of empagliflozin treatment in patients with heart failure dissipate rapidly after withdrawal of the drug .
Mann, D. L., Barger, P. M. & Burkhoff, D. Myocardial recovery and the failing heart: myth, magic, or molecular target? J. Am. Coll. Cardiol. 60 , 2465–2472 (2012).
Article PubMed PubMed Central Google Scholar
Zhou, B. & Tian, R. Mitochondrial dysfunction in pathophysiology of heart failure. J. Clin. Invest. 128 , 3716–3726 (2018). Mitochondria-mediated mechanisms may drive the demise of the heart before the ultimate ATP depletion .
Allard, M. F., Schonekess, B. O., Henning, S. L., English, D. R. & Lopaschuk, G. D. Contribution of oxidative metabolism and glycolysis to ATP production in hypertrophied hearts. Am. J. Physiol. 267 , H742–H750 (1994).
CAS PubMed Google Scholar
Jaswal, J. S., Keung, W., Wang, W., Ussher, J. R. & Lopaschuk, G. D. Targeting fatty acid and carbohydrate oxidation—a novel therapeutic intervention in the ischemic and failing heart. Biochim. Biophys. Acta 1813 , 1333–1350 (2011).
Luptak, I. et al. Long-term effects of increased glucose entry on mouse hearts during normal aging and ischemic stress. Circulation 116 , 901–909 (2007).
Aubert, G., Vega, R. B. & Kelly, D. P. Perturbations in the gene regulatory pathways controlling mitochondrial energy production in the failing heart. Biochim. Biophys. Acta 1833 , 840–847 (2013).
Fillmore, N., Wagg, C. S., Zhang, L., Fukushima, A. & Lopaschuk, G. D. Cardiac branched-chain amino acid oxidation is reduced during insulin resistance in the heart. Am. J. Physiol. Endocrinol. Metab. 315 , E1046–E1052 (2018).
Letts, J. A. & Sazanov, L. A. Clarifying the supercomplex: the higher-order organization of the mitochondrial electron transport chain. Nat. Struct. Mol. Biol. 24 , 800–808 (2017).
Mitchell, P. Coupling of phosphorylation to electron and hydrogen transfer by a chemi-osmotic type of mechanism. Nature 191 , 144–148 (1961).
Ciccarelli, M. et al. Reciprocal organ interactions during heart failure: a position paper from the ESC Working Group on Myocardial Function. Cardiovasc. Res. 117 , 2416–2433 (2021).
Bang, C. et al. Intercellular communication lessons in heart failure. Eur. J. Heart Fail. 17 , 1091–1103 (2015).
Ingwall, J. S. & Weiss, R. G. Is the failing heart energy starved? On using chemical energy to support cardiac function. Circ. Res. 95 , 135–145 (2004).
Ingwall, J. S. Energy metabolism in heart failure and remodelling. Cardiovasc. Res. 81 , 412–419 (2009). Critical appraisal of the cardiac inefficiency model .
Luptak, I. et al. Decreased ATP production and myocardial contractile reserve in metabolic heart disease. J. Mol. Cell. Cardiol. 116 , 106–114 (2018).
Abo Alrob, O. & Lopaschuk, G. D. Role of CoA and acetyl-CoA in regulating cardiac fatty acid and glucose oxidation. Biochem. Soc. Trans. 42 , 1043–1051 (2014).
Bertero, E. & Maack, C. Calcium signaling and reactive oxygen species in mitochondria. Circ. Res. 122 , 1460–1478 (2018). Alterations of intermediate substrate metabolism and oxidative stress, rather than an ATP deficit per se, are proposed to account for maladaptive remodeling and dysfunction during resting conditions .
Lopaschuk, G. D., Ussher, J. R., Folmes, C. D., Jaswal, J. S. & Stanley, W. C. Myocardial fatty acid metabolism in health and disease. Physiol. Rev. 90 , 207–258 (2010).
Bertero, E. & Maack, C. Metabolic remodelling in heart failure. Nat. Rev. Cardiol. 15 , 457–470 (2018).
Miller, B. F. & Hamilton, K. L. A perspective on the determination of mitochondrial biogenesis. Am. J. Physiol. Endocrinol. Metab. 302 , E496–E499 (2012).
Signes, A. & Fernandez-Vizarra, E. Assembly of mammalian oxidative phosphorylation complexes I–V and supercomplexes. Essays Biochem. 62 , 255–270 (2018).
Levine, B., Kalman, J., Mayer, L., Fillit, H. M. & Packer, M. Elevated circulating levels of tumour necrosis factor in severe chronic heart failure. N. Engl. J. Med. 323 , 236–241 (1990).
Packer, M. Heart failure: the most important, preventable, and treatable cardiovascular complication of type 2 diabetes. Diabetes Care 41 , 11–13 (2018).
De Jong, K. A. & Lopaschuk, G. D. Complex energy metabolic changes in heart failure with preserved ejection fraction and heart failure with reduced ejection fraction. Can. J. Cardiol. 33 , 860–871 (2017).
Murashige, D. et al. Extra-cardiac BCAA catabolism lowers blood pressure and protects from heart failure. Cell Metab. 34 , 1749–1764 (2022).
Liu, S. et al. OXPHOS deficiency activates global adaptation pathways to maintain mitochondrial membrane potential. EMBO Rep. 22 , e51606 (2021).
Lopaschuk, G. D., Rebeyka, I. M. & Allard, M. F. Metabolic modulation: a means to mend a broken heart. Circulation 105 , 140–142 (2002).
Kumar, A. A., Kelly, D. P. & Chirinos, J. A. Mitochondrial dysfunction in heart failure with preserved ejection fraction. Circulation 139 , 1435–1450 (2019).
Ridker, P. M. & Rane, M. Interleukin-6 signaling and anti-interleukin-6 therapeutics in cardiovascular disease. Circ. Res. 128 , 1728–1746 (2021).
Packer, M. et al. Empagliflozin in patients with heart failure, reduced ejection fraction, and volume overload: EMPEROR-Reduced Trial. J. Am. Coll. Cardiol. 77 , 1381–1392 (2021).
Hartupee, J. & Mann, D. L. Neurohormonal activation in heart failure with reduced ejection fraction. Nat. Rev. Cardiol. 14 , 30–38 (2017).
Shah, A. M. Parsing the role of NADPH oxidase enzymes and reactive oxygen species in heart failure. Circulation 131 , 602–604 (2015).
Teuber, J. P., Essandoh, K., Hummel, S. L., Madamanchi, N. R. & Brody, M. J. NADPH oxidases in diastolic dysfunction and heart failure with preserved ejection fraction. Antioxidants 11 , 1822 (2022).
Wang, X., Bosonea, A. M. & Fernandez-Patron, C. Metalloproteinases: key and common mediators of multiple GPCRs and candidate therapeutic targets in models of hypertensive cardiac disease. Drug Discov. Today Dis. Models 9 , e103–e108 (2012).
Hao, L., Nishimura, T., Wo, H. & Fernandez-Patron, C. Vascular responses to α1-adrenergic receptors in small rat mesenteric arteries depend on mitochondrial reactive oxygen species. Arterioscler. Thromb. Vasc. Biol. 26 , 819–825 (2006).
Gallo, L. A., Wright, E. M. & Vallon, V. Probing SGLT2 as a therapeutic target for diabetes: basic physiology and consequences. Diab. Vasc. Dis. Res. 12 , 78–89 (2015).
Packer, M. et al. Effect of empagliflozin on worsening heart failure events in patients with heart failure and preserved ejection fraction: EMPEROR-Preserved Trial. Circulation 144 , 1284–1294 (2021).
Lopaschuk, G. D. & Verma, S. Mechanisms of cardiovascular benefits of sodium glucose co-transporter 2 (SGLT2) inhibitors: a state-of-the-art review. JACC Basic Transl. Sci. 5 , 632–644 (2020).
Mazidi, M., Rezaie, P., Gao, H. K. & Kengne, A. P. Effect of sodium–glucose cotransport-2 inhibitors on blood pressure in people with type 2 diabetes mellitus: a systematic review and meta-analysis of 43 randomized control trials with 22 528 patients. J. Am. Heart Assoc. 6 , e004007 (2017).
Packer, M. Evolution of the neurohormonal hypothesis to explain the progression of chronic heart failure. Eur. Heart J. 16 , 4–6 (1995).
Byrne, N. J. et al. Empagliflozin blunts worsening cardiac dysfunction associated with reduced NLRP3 (nucleotide-binding domain-like receptor protein 3) inflammasome activation in heart failure. Circ. Heart. Fail. 13 , e006277 (2020).
Pereira, M. J. & Eriksson, J. W. Emerging role of SGLT-2 inhibitors for the treatment of obesity. Drugs 79 , 219–230 (2019).
Packer, M., Anker, S. D., Butler, J., Filippatos, G. & Zannad, F. Effects of sodium–glucose cotransporter 2 inhibitors for the treatment of patients with heart failure: proposal of a novel mechanism of action. JAMA Cardiol. 2 , 1025–1029 (2017).
Baartscheer, A. et al. Empagliflozin decreases myocardial cytoplasmic Na + through inhibition of the cardiac Na + /H + exchanger in rats and rabbits. Diabetologia 60 , 568–573 (2017).
Mentzer, R. M. Jr. et al. Sodium–hydrogen exchange inhibition by cariporide to reduce the risk of ischemic cardiac events in patients undergoing coronary artery bypass grafting: results of the EXPEDITION study. Ann. Thorac. Surg. 85 , 1261–1270 (2008).
Drakos, S. G. et al. Distinct transcriptomic and proteomic profile specifies patients who have heart failure with potential of myocardial recovery on mechanical unloading and circulatory support. Circulation 147 , 409–424 (2023).
Lopez-Campistrous, A. et al. Mitochondrial dysfunction in the hypertensive rat brain: respiratory complexes exhibit assembly defects in hypertension. Hypertension 51 , 412–419 (2008).
Ghezzi, D. & Zeviani, M. Human diseases associated with defects in assembly of OXPHOS complexes. Essays Biochem. 62 , 271–286 (2018).
Ait-Aissa, K. et al. Mitochondrial oxidative phosphorylation defect in the heart of subjects with coronary artery disease. Sci. Rep. 9 , 7623 (2019).
Gureev, A. P., Shaforostova, E. A. & Popov, V. N. Regulation of mitochondrial biogenesis as a way for active longevity: interaction between the Nrf2 and PGC-1α signaling pathways. Front. Genet. 10 , 435 (2019).
Teintze, M., Slaughter, M., Weiss, H. & Neupert, W. Biogenesis of mitochondrial ubiquinol:cytochrome c reductase (cytochrome bc 1 complex). Precursor proteins and their transfer into mitochondria. J. Biol. Chem. 257 , 10364–10371 (1982).
Tang, J. X., Thompson, K., Taylor, R. W. & Olahova, M. Mitochondrial OXPHOS biogenesis: co-regulation of protein synthesis, import, and assembly pathways. Int. J. Mol. Sci. 21 , 3820 (2020).
Marchingo, J. M. & Cantrell, D. A. Protein synthesis, degradation, and energy metabolism in T cell immunity. Cell. Mol. Immunol. 19 , 303–315 (2022).
Dyck, J. R. & Lopaschuk, G. D. AMPK alterations in cardiac physiology and pathology: enemy or ally? J. Physiol. 574 , 95–112 (2006).
Litvinukova, M. et al. Cells of the adult human heart. Nature 588 , 466–472 (2020).
Mann, D. L. Innate immunity and the failing heart: the cytokine hypothesis revisited. Circ. Res. 116 , 1254–1268 (2015).
Diebold, L. P. et al. Mitochondrial complex III is necessary for endothelial cell proliferation during angiogenesis. Nat. Metab. 1 , 158–171 (2019).
Hargreaves, M. & Spriet, L. L. Skeletal muscle energy metabolism during exercise. Nat. Metab. 2 , 817–828 (2020).
Shulman, R. G. & Rothman, D. L. The ‘glycogen shunt’ in exercising muscle: a role for glycogen in muscle energetics and fatigue. Proc. Natl Acad. Sci. USA 98 , 457–461 (2001).
Pandey, A. et al. Exercise intolerance in older adults with heart failure with preserved ejection fraction: JACC State-of-the-Art Review. J. Am. Coll. Cardiol. 78 , 1166–1187 (2021).
Nilsson, K. R., Duscha, B. D., Hranitzky, P. M. & Kraus, W. E. Chronic heart failure and exercise intolerance: the hemodynamic paradox. Curr. Cardiol. Rev. 4 , 92–100 (2008).
Lawson, C. A. et al. Outcome trends in people with heart failure, type 2 diabetes mellitus and chronic kidney disease in the UK over twenty years. EClinicalMedicine 32 , 100739 (2021).
Hajduk, A. M., Kiefe, C. I., Person, S. D., Gore, J. G. & Saczynski, J. S. Cognitive change in heart failure: a systematic review. Circ. Cardiovasc. Qual. Outcomes 6 , 451–460 (2013).
Packer, M. Does a target dose or a target heart rate matter to outcomes when prescribing β-blockers to patients with chronic heart failure? Circ. Cardiovasc. Qual. Outcomes 11 , e004605 (2018).
Ide, T. et al. Mitochondrial electron transport complex I is a potential source of oxygen free radicals in the failing myocardium. Circ. Res. 85 , 357–363 (1999).
Hansson, A. et al. A switch in metabolism precedes increased mitochondrial biogenesis in respiratory chain-deficient mouse hearts. Proc. Natl Acad. Sci. USA 101 , 3136–3141 (2004).
Bugger, H. et al. Proteomic remodelling of mitochondrial oxidative pathways in pressure overload-induced heart failure. Cardiovasc. Res. 85 , 376–384 (2010).
Wang, X. et al. Cardiac disruption of SDHAF4-mediated mitochondrial complex II assembly promotes dilated cardiomyopathy. Nat. Commun. 13 , 3947 (2022).
Sihag, S., Cresci, S., Li, A. Y., Sucharov, C. C. & Lehman, J. J. PGC-1α and ERRα target gene downregulation is a signature of the failing human heart. J. Mol. Cell. Cardiol. 46 , 201–212 (2009).
Karamanlidis, G. et al. Mitochondrial complex I deficiency increases protein acetylation and accelerates heart failure. Cell Metab. 18 , 239–250 (2013).
Ke, B. X. et al. Tissue-specific splicing of an Ndufs6 gene-trap insertion generates a mitochondrial complex I deficiency-specific cardiomyopathy. Proc. Natl Acad. Sci. USA 109 , 6165–6170 (2012).
Arany, Z. et al. Transcriptional coactivator PGC-1α controls the energy state and contractile function of cardiac muscle. Cell Metab. 1 , 259–271 (2005).
Liu, T. et al. Mitochondrial proteome remodelling in ischemic heart failure. Life Sci. 101 , 27–36 (2014).
Hou, T. et al. NDUFAB1 confers cardio-protection by enhancing mitochondrial bioenergetics through coordination of respiratory complex and supercomplex assembly. Cell Res. 29 , 754–766 (2019).
Sebastiao, M. J. et al. Unveiling human proteome signatures of heart failure with preserved ejection fraction. Biomedicines 10 , 2943 (2022).
Marin-Garcia, J., Goldenthal, M. J., Pierpont, M. E. & Ananthakrishnan, R. Impaired mitochondrial function in idiopathic dilated cardiomyopathy: biochemical and molecular analysis. J. Card. Fail. 1 , 285–291 (1995).
Unverferth, D. V., Lee, S. W. & Wallick, E. T. Human myocardial adenosine triphosphatase activities in health and heart failure. Am. Heart J. 115 , 139–146 (1988).
Ide, T. et al. Mitochondrial DNA damage and dysfunction associated with oxidative stress in failing hearts after myocardial infarction. Circ. Res. 88 , 529–535 (2001).
Jullig, M. et al. Is the failing heart out of fuel or a worn engine running rich? A study of mitochondria in old spontaneously hypertensive rats. Proteomics 8 , 2556–2572 (2008).
Quigley, A. F., Kapsa, R. M., Esmore, D., Hale, G. & Byrne, E. Mitochondrial respiratory chain activity in idiopathic dilated cardiomyopathy. J. Card. Fail. 6 , 47–55 (2000).
Rosca, M. G. et al. Cardiac mitochondria in heart failure: decrease in respirasomes and oxidative phosphorylation. Cardiovasc. Res. 80 , 30–39 (2008).
Gomez, L. A., Monette, J. S., Chavez, J. D., Maier, C. S. & Hagen, T. M. Supercomplexes of the mitochondrial electron transport chain decline in the aging rat heart. Arch. Biochem. Biophys. 490 , 30–35 (2009).
Goldberg, I. J., Trent, C. M. & Schulze, P. C. Lipid metabolism and toxicity in the heart. Cell Metab. 15 , 805–812 (2012).
Mookerjee, S. A., Gerencser, A. A., Nicholls, D. G. & Brand, M. D. Quantifying intracellular rates of glycolytic and oxidative ATP production and consumption using extracellular flux measurements. J. Biol. Chem. 293 , 12649–12652 (2018).
Martinez-Reyes, I. & Chandel, N. S. Mitochondrial TCA cycle metabolites control physiology and disease. Nat. Commun. 11 , 102 (2020).
Shi, Y. et al. Epigenetic regulation in cardiovascular disease: mechanisms and advances in clinical trials. Signal Transduct. Target. Ther. 7 , 200 (2022).
Zhang, X. et al. MicroRNA-195 regulates metabolism in failing myocardium via alterations in sirtuin 3 expression and mitochondrial protein acetylation. Circulation 137 , 2052–2067 (2018).
Vinothkumar, K. R., Zhu, J. & Hirst, J. Architecture of mammalian respiratory complex I. Nature 515 , 80–84 (2014).
Du, Z. et al. Structure of the human respiratory complex II. Proc. Natl Acad. Sci. USA 120 , e2216713120 (2023).
Solmaz, S. R. & Hunte, C. Structure of complex III with bound cytochrome c in reduced state and definition of a minimal core interface for electron transfer. J. Biol. Chem. 283 , 17542–17549 (2008).
Watt, I. N., Montgomery, M. G., Runswick, M. J., Leslie, A. G. & Walker, J. E. Bioenergetic cost of making an adenosine triphosphate molecule in animal mitochondria. Proc. Natl Acad. Sci. USA 107 , 16823–16827 (2010).
He, J. et al. Assembly of the membrane domain of ATP synthase in human mitochondria. Proc. Natl Acad. Sci. USA 115 , 2988–2993 (2018).
Download references
Author information
Authors and affiliations.
Cardiovascular Research Centre, Department of Biochemistry, Faculty of Medicine and Dentistry, College of Health Sciences, University of Alberta, Edmonton, Alberta, Canada
Carlos Fernandez-Patron
Cardiovascular Research Centre, Department of Pediatrics, University of Alberta, Edmonton, Alberta, Canada
Gary D. Lopaschuk
Center of Molecular Immunology, Havana, Cuba
Eugenio Hardy
You can also search for this author in PubMed Google Scholar
Contributions
C.F.-P. conceived the hypothesis. C.F.-P. and E.H. conceived, wrote and edited the manuscript and drafted the figures. G.D.L. made key edits and additions to the intellectual content and figures. All authors contributed to the critical analysis of the literature.
Corresponding authors
Correspondence to Carlos Fernandez-Patron or Eugenio Hardy .
Ethics declarations
Competing interests.
The authors declare no competing interests.
Peer review
Peer review information.
Nature Cardiovascular Research thanks Edoardo Bertero and the other, anonymous, reviewer(s) for their contribution to the peer review of this work.
Additional information
Publisher’s note Springer Nature remains neutral with regard to jurisdictional claims in published maps and institutional affiliations.
Rights and permissions
Springer Nature or its licensor (e.g. a society or other partner) holds exclusive rights to this article under a publishing agreement with the author(s) or other rightsholder(s); author self-archiving of the accepted manuscript version of this article is solely governed by the terms of such publishing agreement and applicable law.
Reprints and permissions
About this article
Cite this article.
Fernandez-Patron, C., Lopaschuk, G.D. & Hardy, E. A self-reinforcing cycle hypothesis in heart failure pathogenesis. Nat Cardiovasc Res (2024). https://doi.org/10.1038/s44161-024-00480-6
Download citation
Received : 04 January 2024
Accepted : 25 April 2024
Published : 03 June 2024
DOI : https://doi.org/10.1038/s44161-024-00480-6
Share this article
Anyone you share the following link with will be able to read this content:
Sorry, a shareable link is not currently available for this article.
Provided by the Springer Nature SharedIt content-sharing initiative
Quick links
- Explore articles by subject
- Guide to authors
- Editorial policies
Sign up for the Nature Briefing newsletter — what matters in science, free to your inbox daily.

IMAGES
VIDEO
COMMENTS
It seeks to explore and understand a particular aspect of the research subject. In contrast, a research hypothesis is a specific statement or prediction that suggests an expected relationship between variables. It is formulated based on existing knowledge or theories and guides the research design and data analysis. 7.
6. Write a null hypothesis. If your research involves statistical hypothesis testing, you will also have to write a null hypothesis. The null hypothesis is the default position that there is no association between the variables. The null hypothesis is written as H 0, while the alternative hypothesis is H 1 or H a.
A research hypothesis (also called a scientific hypothesis) is a statement about the expected outcome of a study (for example, a dissertation or thesis). To constitute a quality hypothesis, the statement needs to have three attributes - specificity, clarity and testability. Let's take a look at these more closely.
The research hypothesis links theories to real-world evidence and gives researchers a clear path to explore and make discoveries. QuestionPro Research Suite is a helpful tool for researchers. It makes creating surveys, collecting data, and analyzing information easily. It supports all kinds of research, from exploring new ideas to forming ...
3. Simple hypothesis. A simple hypothesis is a statement made to reflect the relation between exactly two variables. One independent and one dependent. Consider the example, "Smoking is a prominent cause of lung cancer." The dependent variable, lung cancer, is dependent on the independent variable, smoking. 4.
A hypothesis is a tentative statement about the relationship between two or more variables. It is a specific, testable prediction about what you expect to happen in a study. It is a preliminary answer to your question that helps guide the research process. Consider a study designed to examine the relationship between sleep deprivation and test ...
A research hypothesis, in its plural form "hypotheses," is a specific, testable prediction about the anticipated results of a study, established at its outset. It is a key component of the scientific method. Hypotheses connect theory to data and guide the research process towards expanding scientific understanding.
Definition: Hypothesis is an educated guess or proposed explanation for a phenomenon, based on some initial observations or data. It is a tentative statement that can be tested and potentially proven or disproven through further investigation and experimentation. Hypothesis is often used in scientific research to guide the design of experiments ...
A research hypothesis is your proposed answer to your research question. The research hypothesis usually includes an explanation ('x affects y because …'). A statistical hypothesis, on the other hand, is a mathematical statement about a population parameter. Statistical hypotheses always come in pairs: the null and alternative hypotheses.
A hypothesis (from the Greek, foundation) is a logical construct, interposed between a problem and its solution, which represents a proposed answer to a research question. It gives direction to the investigator's thinking about the problem and, therefore, facilitates a solution. Unlike facts and assumptions (presumed true and, therefore, not ...
What they need at the start of their research is to formulate a scientific hypothesis that revisits conventional theories, real-world processes, and related evidence to propose new studies and test ideas in an ethical way.3 Such a hypothesis can be of most benefit if published in an ethical journal with wide visibility and exposure to relevant ...
A research hypothesis is more specific than a general hypothesis. It is an educated, expected prediction of the outcome of a study that is testable. What makes an effective research hypothesis? A good research hypothesis is a clear statement of the relationship between a dependent variable(s) and independent variable(s) relevant to the study ...
INTRODUCTION. Scientific research is usually initiated by posing evidenced-based research questions which are then explicitly restated as hypotheses.1,2 The hypotheses provide directions to guide the study, solutions, explanations, and expected results.3,4 Both research questions and hypotheses are essentially formulated based on conventional theories and real-world processes, which allow the ...
Hypothesis Explanation: The dependent variable (student reading comprehension scores) is the focus, and the hypothesis explores how changes in the independent variable (teacher-led instructional time) affect it. X-Centered Research Design Hypothesis In X-centered research designs, the independent variable is specified in the research question.
An effective hypothesis in research is clearly and concisely written, and any terms or definitions clarified and defined. Specific language must also be used to avoid any generalities or assumptions. Use the following points as a checklist to evaluate the effectiveness of your research hypothesis: Predicts the relationship and outcome.
Research hypothesis. The primary research question should be driven by the hypothesis rather than the data. 1, 2 That is, the research question and hypothesis should be developed before the start of the study. This sounds intuitive; however, if we take, for example, a database of information, it is potentially possible to perform multiple ...
A research hypothesis is your proposed answer to your research question. The research hypothesis usually includes an explanation ("x affects y because …"). A statistical hypothesis, on the other hand, is a mathematical statement about a population parameter. Statistical hypotheses always come in pairs: the null and alternative hypotheses.
The steps to write a research hypothesis are: 1. Stating the problem: Ensure that the hypothesis defines the research problem. 2. Writing a hypothesis as an 'if-then' statement: Include the action and the expected outcome of your study by following a 'if-then' structure. 3.
Step 5: Present your findings. The results of hypothesis testing will be presented in the results and discussion sections of your research paper, dissertation or thesis.. In the results section you should give a brief summary of the data and a summary of the results of your statistical test (for example, the estimated difference between group means and associated p-value).
Your hypothesis is what you propose to "prove" by your research. As a result of your research, you will arrive at a conclusion, a theory, or understanding that will be useful or applicable beyond the research itself. 3. Avoid judgmental words in your hypothesis. Value judgments are subjective and are not appropriate for a hypothesis.
A research hypothesis is a mathematical way of stating a research question. A research hypothesis names the groups (we'll start with a sample and a population), what was measured, and which we think will have a higher mean. The last one gives the research hypothesis a direction. In other words, a research hypothesis should include:
A research hypothesis (H 1) is the statement created by researchers when they speculate upon the outcome of a research or experiment. Every true experimental design must have this statement at the core of its structure, as the ultimate aim of any experiment. The hypothesis is generated via a number of means, but is usually the result of a ...
Applied Research. The account in this subsection is limited to simple research problems and hypotheses. The case where the study includes a research problem, but not a research hypothesis, is discussed first, followed by an analysis of the case where a hypothesis is added to the problem and tested.
Research Hypothesis. Specifically, we want to test that the slope is not zero. The research hypothesis will be that there is an explanatory relation between the variables. RH: β > 0 β > 0. RH: β < 0 β < 0. RH: β ≠ 0 β ≠ 0. A non-zero slope indicates that we can explain values in Y Y based on X X and therefore predict future values of ...
Understanding Science 101. Testing ideas with evidence from the natural world is at the core of science. Scientific testing involves figuring out what we would expect to observe if an idea were correct and comparing that expectation to what we actually observe. Scientific arguments are built from an idea and the evidence relevant to that idea ...
Formula Calculation. Calculate the chi-square statistic (χ2) by completing the following steps: Calculate the expected frequencies and the observed frequencies. For each observed number in the table, subtract the corresponding expected number (O — E). Square the difference (O —E)². Sum all the values for (O - E)² / E.
The self-reinforcing cycle hypothesis identifies two interconnected pathological events affecting mitochondria in the failing heart: (1) occurrence and accumulation of assembly defects or damage ...
A common low-calorie sweetener called xylitol, found in gum, candy, toothpaste and more, may cause clots that can lead to heart attack and stroke, a new study found.
Pahkala has devoted her research career to examining early life determinants of cardiometabolic health with the ultimate aim to improve primordial prevention of cardiometabolic diseases. She is a long-standing senior researcher and the vice director of the Research Centre of Applied and Preventive Cardiovascular Medicine at the University of Turku.
Growing evidence supports the hypothesis that temperate herbivores surf the green wave of emerging plants during spring migration. Despite the importance of autumn migration, few studies have conceptualized resource tracking of temperate herbivores during this critical season. We adapted the frost wave hypothesis (FWH), which posits that animals pace their autumn migration to reduce exposure to sn